

Abstract
To investigate the folding behavior of amyloidogenic proteins under extreme temperatures, the kinetics of fibrillation and accompanying secondary structure transitions of bovine insulin were studied for temperatures ranging up to 140°C. The presence of extreme heat stress had traditionally been associated with irreversible denaturation of protein while the initial steps of such a denaturation process may be common with a fibril formation pathway of amyloidogenic proteins. The present work demonstrates the ability of insulin to form amyloid fibrils at above 100°C. Amyloid formation was gradually replaced by random coil generation after ~80°C until no amyloid was detected at 140°C. The morphology of insulin amyloid fibrils underwent sharp changes with increasing the temperature. The dependence of amyloid formation rate on incubation temperature followed non-Arrhenius kinetics, which is explained by temperature-dependent enthalpy change for amyloid formation. The intermediate stage of amyloid formation and random coil generation consisted of a partially folded intermediate common to both pathways. The fully unfolded monomers in random coil conformation showed partial reversibility through this intermediate by reverting back to the amyloid pathway when formed at 140°C and incubated at 100°C. This study highlights the non-Arrhenius kinetics of amyloid fibrillation under extreme temperatures, and elucidates its intermediate stage common with random coil formation.
Keywords: amyloid, insulin, extreme temperature, random coil, partially folded intermediate
The boiling of protein solutions typically leads to irreversible and amorphous aggregation caused by breakage of hydrogen bonds, salt bridges, and disulfide bonds in a native protein structure (Hespenheide et al. 2002; Meersman and Heremans 2003). Thermal stress provides conformational freedom to polypeptide chains and rotational freedom to individual groups, thereby inducing the initial formation of partially folded intermediates (Makhatadze and Privalov 1995; Jayaraman et al. 1996). These intermediate structures with exposed hydrophobic patches coagulate together to form amorphous aggregates and precipitate out of the solution (Galani and Apenten 1999). In contrast, extremely thermostable proteins had been found in microorganisms isolated from habitats such as volcanoes, deep-sea hydrothermal vents, and hot springs (Stetter 1999; Huber et al. 2000). This extraordinary stability was attributed to a number of factors including increased rigidity, high packing efficiency, reduction of conformational strain, cooperative association, and absence of loose ends (Vieille and Zeikus 1996; Vieille et al. 1996; Robb and Maeder 1998). Despite their differences in thermostability, proteins from mesophilic or thermophilic sources are active only in a very narrow range of temperature, showing no activity outside this temperature range. The present work investigates the folding of bovine insulin that is functionally active under ambient conditions, but undergoes transformation to another “ordered” secondary structure instead of amorphous aggregation when subjected to elevated temperatures.
A number of structurally unrelated proteins are known to form amyloid fibrils under denaturing conditions, and present a contrasting case of an alternative protein folding pathway (Kusumoto et al. 1998; Nielsen et al. 2001). Environmental stress triggers off the alternate folding pathway for amyloidogenic proteins, leading to partial unfolding of proteins followed by the formation of amyloid fibrils having a dominant cross β-sheet secondary structure (Harper and Lansbury 1997; McLaurin et al. 2000). Amyloid formation is believed to play a central role in the pathogenesis of many diseases such as Alzheimer’s, Parkinson’s, Huntington’s, mad cow disease, and type II diabetes (Harper and Lansbury 1997; Murphy 2002), but it still remains unresolved how normal and soluble proteins assemble into fibrils (Kisilevsky 2000). Amyloidogenic proteins such as insulin had been reported to form partially folded intermediates analogous to those in the amorphous aggregation of proteins caused by environmental stresses (Kusumoto et al. 1998; Nielsen et al. 2001; Rafikova et al. 2003). A few such intermediates then coalesce by hydrophobic and electrostatic interactions to form nuclei, which serve as a starting point of amyloid fibrillation (Whittingham et al. 2002; Ahmad et al. 2003). Partially folded intermediates, which appear during amorphous aggregation as well as in amyloid formation, resemble molten globule-like structures, which have a loosely packed hydrophobic core accessible to solvents and serve as the site for hydrophobic interaction with other such intermediates (Ptitsyn 1992; Dzwolak et al. 2003).
Folding of amyloidogenic proteins under extreme temperatures had been rarely studied. Insights from such works may be employed for understanding amyloid folding mechanism as well as stability of pathogenic conformations formed by amyloidogenic proteins. For example, prion proteins, which are infectious amyloids associated with mad cow disease, scrapie, and others (Prusiner 1987; El-Bastawissy et al. 2001), were reported to be stable in boiling water (Steelman 1994). The beef from cattle affected with mad cow disease may further be subjected to extreme temperature during cooking, thereby causing conformational transitions. Therefore, changes in structure of amyloidogenic proteins with extreme heat stress and the effect of such changes on thermal stability may be of relevance for propagation of such diseases.
The aim of this work was to investigate insulin amyloid formation under extreme temperatures ranging up to 140°C. Insulin exists as a hexamer in its native state, but forms long unbranched fibrils in vitro under denaturing conditions (Bouchard et al. 2000; Nielsen et al. 2001; Ahmad et al. 2003). According to our work, insulin formed amyloid fibrils even at and above 100°C, and the amyloid formation rate was observed to follow non-Arrhenius folding kinetics. In addition, gradual replacement of amyloid fibrils by random coil formation was observed with increase in temperatures above 80°C. Changes in fibrillar morphology in terms of increased flexibility and spatial arrangement were also observed with increasing temperature. A partially folded intermediate was established as a common stage for both amyloid fibrillation as well as for random coil formation, thus linking ordered secondary structure formation with a generation of unfolded conformations.
Results
Non-Arrhenius folding of insulin amyloid
According to ThT-induced fluorescence analysis, insulin formed amyloid fibrils under incubation temperatures ranging up to ~130°C (Fig. 1 ▶). It was found that the lag times, amyloid formation rates, as well as the maximal ThT fluorescence values were highly dependent on the temperature of incubation. The lag time decreased significantly with increasing temperature, and became almost independent of temperature at and above 100°C. The maximal fluorescence values increased up to ~80°C, after which they decreased up to 140°C (data not shown). No amyloid formation was observed in incubations carried out at and over 140°C. In Figure 2 ▶, the logarithm of the amyloid formation rate was plotted against the inverse of the incubation temperature, which increased to ~80°C, followed by a subsequent gradual decrease. This observation suggests that amyloid fibrillation follows non-Arrhenius kinetics over the broad temperature range tested in this work. Earlier studies (Chen et al. 1989; Oliveberg et al. 1995) showed non-Arrhenius dependence for refolding of barnase and chymotrypsin inhibitor 2, but no such work was reported for amyloid formation.
Figure 1.

Time profiles for thioflavin T-induced fluorescence of insulin samples incubated at and above 100°C. Inset shows insulin amyloid formation at and below 50°C. Lag time was found to be almost independent of temperature above 100°C. All insulin samples were prepared at a concentration of 1 mg/mL in glycine buffer (pH 2, 20 mM). Each reading represents average of triplet measurements, with the error bar representing standard deviation from the mean value.
Figure 2.

Amyloid formation rate as a function of inverse temperature. Amyloid formation rate was calculated as the slope of the ThT-induced fluorescence increase during the exponential growth phase, and the logarithm of the rate was plotted against the inverse of the incubation temperature. The calculated rate increased to ~80°C and gradually decreased to 140°C, yielding a bell-shaped curve characteristic of non-Arrhenius kinetics.
Secondary structure transitions at 100°C and 140°C
The CD spectrum of native insulin had been reported to show two minima at 208 and 222 nm, indicating a dominant α-helical structure (Bouchard et al. 2000). Amyloid formation is indicated by the disappearance of these two minima and the appearance of a single minimum at 216 nm, which is characteristic of a cross β-sheet structure in amyloid fibrils. On the other hand, fully unfolded monomers having a random coil conformation are characterized by the presence of a single minimum below 200 nm. In this work, the CD analysis of the insulin sample incubated at 100°C confirmed the presence of minima at 208 nm and 222 nm during the initial stage of incubation, which is typical of native insulin (Fig. 3A ▶). The time profile of CD spectra showed a gradual decrease of minima at 208 nm and 222 nm, indicating a decrease of an α-helical structure followed by the formation of a new minimum at 216 nm, which is characteristic of a cross β-sheet secondary structure. When insulin was incubated at 140°C, the CD spectra initially followed the trend observed at 100°C, with a decrease of minima at 208 nm and 222 nm, but no new minimum at 216 nm was observed afterward, indicating a lack of β-sheet formation at this temperature (Fig. 3B ▶). Instead, a minimum was observed below 200 nm, which is characteristic of a random coil secondary structure. Thus, insulin transformed to a random coil conformation at 140°C as against the ordered cross β-sheet structure to ~130°C.
Figure 3.
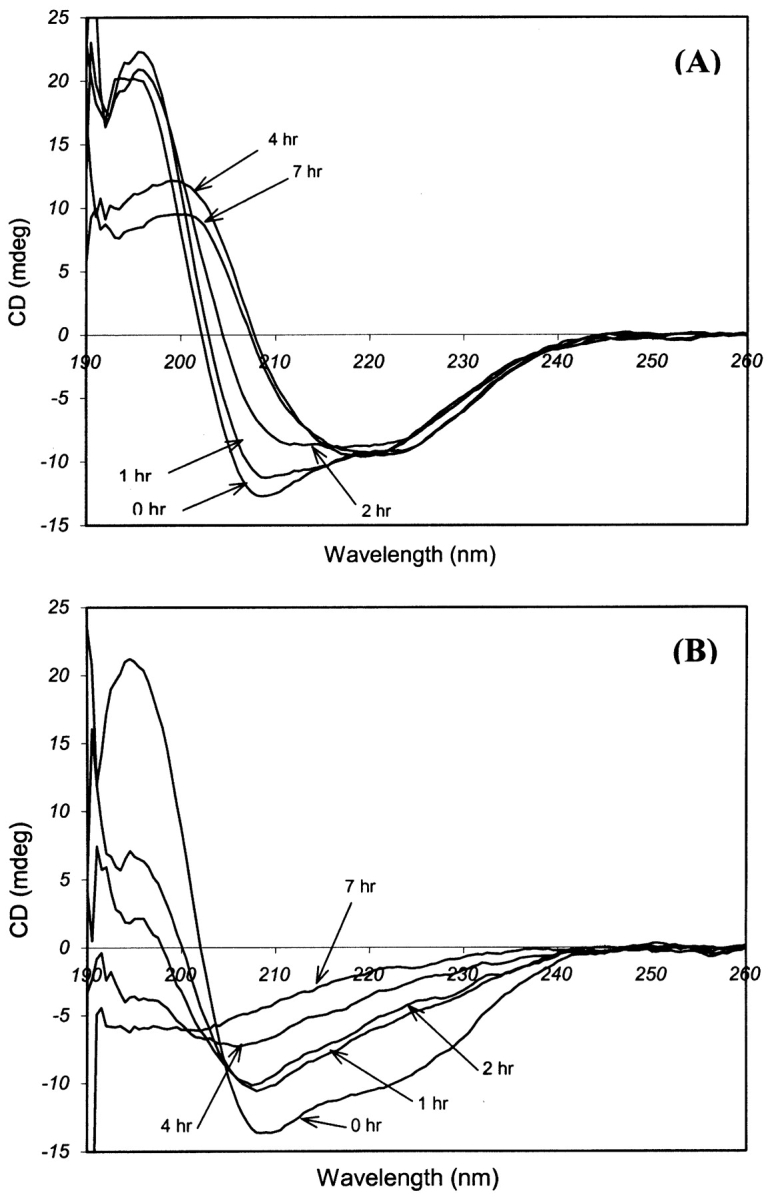
Time evolution pattern of CD spectra for insulin under extreme temperatures. (A) 100°C: Reduction of minima at 208 nm and 222 nm indicates a decrease in the α-helical structure. Appearance of a new minimum at 216 nm represents the cross β-sheet structure due to the amyloid formation. (B) 140°C: Appearance of a new minimum below 200 nm represents formation of a random coil structure.
Effect of temperature on fibril morphology
Characteristic long and unbranched amyloid fibrils were formed during the current study at various temperatures, as shown in AFM images (Fig. 4 ▶). However, the morphology of these fibrils underwent sharp changes with increasing the temperature. At 50°C, as shown in Figure 4 ▶, the fibrils were straight and showed distinct nodes suggestive of intertwined protofibrils as reported in previous work (Jiménez et al. 2002). At 100°C, the shape of the fibrils became more curvilinear, suggesting increased flexibility (Fig. 4 ▶). Very few fibrils were observed at 120°C, in agreement with the decreased fluorescence at higher temperatures. Also, the fibrils were found to be stacked together as bundles, with some nodes still distinguishable in individual fibrils. No fibrils or aggregates were found at 140°C, confirming the absence of amyloid formation at this temperature.
Figure 4.
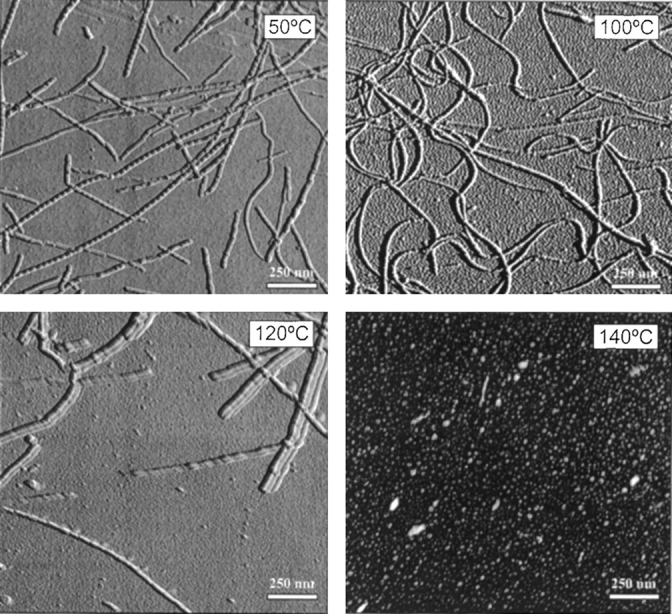
Representative atomic force microscope images at selected incubation temperatures showing the effect of temperature on insulin amyloid morphology. 50°C: Straight fibrils with visible nodes due to twisted protofibrils. 100°C: Curved fibrils indicating increased flexibility. 120°C: Short fibrils bundled together. 140°C: Neither amyloid fibrils nor amorphous aggregates were observed at this temperature. Samples were collected at the saturation phase in each case except for 140°C, where the sample was incubated for 48 h.
Partially folded intermediate as a common stage of amyloid and random coil formation
The CD spectra after 2 h incubation at 100°C and 140°C in Figure 3 ▶ indicate a substantial decrease in the α-helical structure under both conditions. This suggested a loosening of the secondary structure and the presence of a common partially folded intermediate during amyloid formation as well as random coil generation. These observations prompted a temperature transition experiment, which consisted of incubation at 140°C for 3 h, subsequent incubation at 100°C for 4 h, followed by incubation at 140°C for the remainder of the experiment. There was no increase in ThT-induced fluorescence during incubation at 140°C, but the fluorescence value increased soon after switching the temperature down to 100°C (Fig. 5A ▶). The minima at 208 nm and 222 nm in the CD spectra were suppressed, signifying a reduction in the α-helical structure during incubation at 140°C (Fig. 5B ▶). This was followed by the appearance of a new minimum at 216 nm, signifying amyloid formation when the incubation temperature was switched to 100°C. When the temperature was again raised to 140°C after total incubation duration of 7 h, ThT fluorescence dropped sharply as a result of heat shock, thus confirming the inability of amyloid growth at 140°C.
Figure 5.
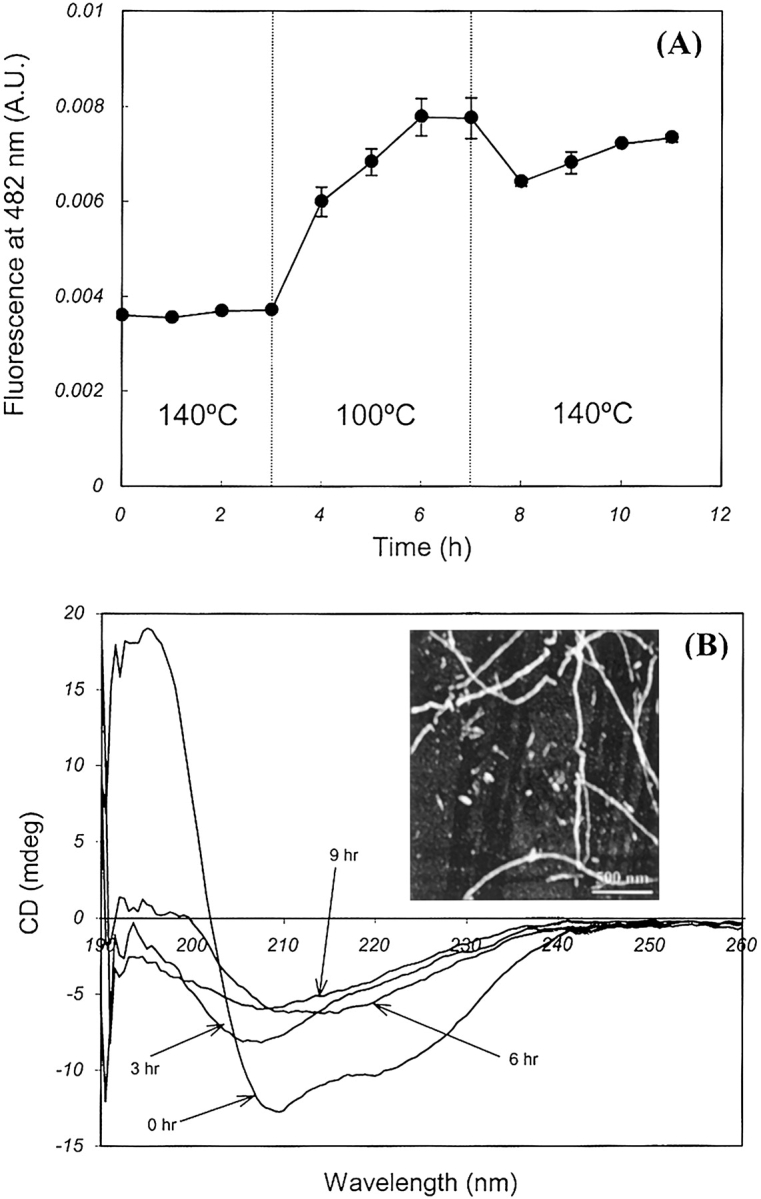
Temperature transition experiment for establishing a partially folded intermediate as a common stage of amyloid fibrillation and random coil formation. (A) Time profile of ThT-induced fluorescence showing the absence of amyloid formation during incubation at 140°C followed by rapid fibrillation at 100°C. Amyloid growth was quenched when the temperature was switched back to 140°C. (B) Time evolution pattern of CD spectra showing partial unfolding at 140°C and an amyloid formation at 100°C. The inset shows the AFM image of amyloid fibrils formed after incubation at 140°C for the first 3 h followed by incubation at 100°C for 120 h.
The unfolded insulin in the random coil conformation at 140°C could be directed toward amyloid fibrillation by switching the incubation temperature to 100°C from 140°C, which implied the presence of a partially folded intermediate as a common stage in both pathways. The AFM image obtained after incubation for 3 h at 140°C followed by prolonged incubation at 100°C showed insulin fibrils confirming amyloid formation as shown in the inset of Figure 5B ▶. The difference in magnitude of minima at 216 nm between incubations at 100°C (Fig. 3A ▶) to that of the temperature transition experiment (Fig. 5B ▶) could be explained by partially irreversible denaturation of the insulin monomers during incubation at 140°C leading to a lesser amount of monomers for amyloid formation.
Discussion
Amyloid fibrillation had been observed with a number of structurally different proteins such as insulin, Aβ peptide, α-synuclein, and transthyretin (Lai et al. 1996; Rochet and Lansbury 2000; Nielsen et al. 2001; Uversky et al. 2001). The detailed mechanism underlying the formation of such fibrils having a dominant cross-β secondary structure is still unknown, but the presence of stresses in the form of an elevated temperature, low pH, high ionic strength, and shear stress had been associated with accelerated formation of such “ordered” structure (Lai et al. 1996; Brange et al. 1997a; Dzwolak et al. 2003). On the other hand, application of extreme heat to proteins had been traditionally associated with “amorphous” protein aggregation (Thomas and Scopes 1998; Rafikova et al. 2003). Therefore, in vitro study with application of extreme heat stress provides a plausible and effective way for studying the folding of amyloidogenic proteins under conditions promoting amorphous aggregation.
An insulin monomer consists of two polypeptide chains, A and B, linked by two disulfide bridges (Baker et al. 1988; Nettleton et al. 2000). Chain A consists of two α-helices while chain B has one α-helix. In addition, chain B forms a β-sheet strand with the adjacent monomer. Insulin exists as a hexamer at physiological pH with a zinc ion at the center, but forms a dimer at low pH due to its inability to coordinate with the zinc ion (Whittingham et al. 2002). The secondary structure of the monomer is predominantly α-helical at this low pH, which explains the CD spectra obtained at the start of the incubations (Fig. 3A, B ▶). Application of heat stress destabilizes and partially unfolds insulin monomers. These partially folded intermediates interact through their hydrophobic residues, resulting in nuclei formation and induce amyloid fibril formation (Millican and Brems 1994; Brange et al. 1997b; Nielsen et al. 2001). Other amyloidogenic proteins such as transthyretin also undergo a similar pathway under acidic pH with dissociation into monomers followed by formation of partially folded intermediates before fibril formation (Furuya et al. 1991; Lai et al. 1996).
The overall process of insulin fibrillation induced by extreme heat stress and low pH observed in this work can be schematically represented as the following pathway:
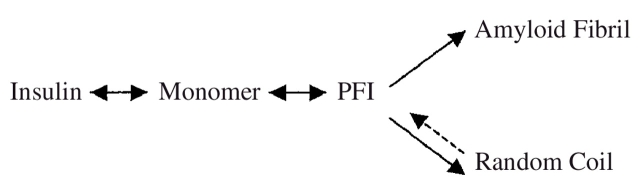
With increasing the temperature, more insulin monomers are expected to form partially folded intermediates (PFI) and follow the amyloid formation pathway. However, suppression in ThT-induced fluorescence levels at above 80°C strongly suggests an increase in concentration of fully unfolded monomers in random coil conformation instead of PFI. Similar observations were reported by Ahmad et al. (2003) in their study on insulin denaturation induced by guanidium hydrochloride. Thus, complete unfolding of insulin monomers into random coils becomes the dominant pathway at higher temperatures accompanied by a decrease in amyloid formation. These inferences are summarized in Figure 6 ▶, which illustrates a variation of the dominant secondary structure of insulin with temperature. Insulin has an α/β structure in the native state, which changes to a cross-β sheet structure of amyloid. According to this work, amyloid fibrillation was gradually replaced by random coil formation, with no amyloid being observed at or above 140°C. No amorphous aggregation was observed at the extreme temperatures, which can be attributed to lack of interactions between random coils. The presence of PFI as a common intermediate for random coil formation as well as for amyloid fibrillation was also established by the temperature transition experiment in this work. The CD spectra for 100°C (Fig. 3A ▶) and 140°C (Fig. 3B ▶) incubations suggest the presence of PFI after an ~2-h incubation period, which then followed the amyloid fibrillation pathway or random coil formation, depending on the temperature. This intermediate did show partial reversibility by reverting to amyloid formation when the temperature was switched from 140°C to 100°C (Fig. 5 ▶). However, all intermediates do not seem to convert to amyloid fibrils, explaining the lower ellipticity values in the CD spectra in the temperature transition experiment compared to incubation at 100°C.
Figure 6.

Schematic representation for temperature dependence of the amyloid formation rate and secondary structure. Insulin exists in its native conformation with an α/β structure under ambient conditions. With increasing the temperature, insulin forms a cross-β sheet, yielding place to the random coil structure at ~140°C. The random coil formation was found to be partially reversible to the amyloid fibrillation through a partially folded intermediate.
Unlike the vast array of chemical reactions that typically follow Arrhenius law over broad temperature ranges, insulin amyloid fibrillation was found to follow non-Arrhenius kinetics according to this work. It is known that rate constants for chemical reactions increase with temperature due to constant activation energy (Chen et al. 1989; Oliveberg et al. 1995; Kusumoto et al. 1998). This may hold true for insulin amyloid formation over a “narrow” temperature range as reported for Aβ fibrillation from 4°C to 40°C by Kusumoto et al. (1998). However, continuous increase of rate constants in amyloid fibrillation may not occur over the “broader” temperature range due to variable free energy. Similar observations of variable free energy and non-Arrhenius folding kinetics were made previously for refolding of barnase and chymotrypsin inhibitor 2 for temperatures up to 88°C by Oliveberg et al. (1995). Thus, based on our observations and previous reports, we hypothesize that insulin amyloid formation followed non-Arrhenius kinetics due to temperature-dependent free energy of the amyloid formation from PFI and corresponding changes in specific heat capacity.
The differential scanning calorimetry measurements done by Dzwolak et al. (2003) showed the endothermic nature of bovine insulin during formation of PFI from the monomer with an increase in specific heat capacity. Formation of PFI was followed by a sharp decrease in specific heat capacity during amyloid formation from PFI, signifying the exothermic nature of fibrillation. The basis for the specific heat capacity change depending on conformational evolution observed at a fixed temperature and corresponding enthalpy change is the increase in the molecular surface area of insulin monomers as they unfold (Oliveberg et al. 1995). A larger surface area implies a more extensive hydration shell around the PFI compared to the insulin monomer, which translates to an increased specific heat capacity, as it is the heat that is required to melt the hydration shell (Makhatadze and Privalov 1995). Similarly, the specific heat capacity of the folded state decreases during amyloid formation from PFI as the fibrillation process is accompanied by folding and a subsequent decrease of surface area. In addition to conformational dependence, specific heat capacity and corresponding enthalpy changes are known to be temperature dependent. Specific heat capacity and enthalpy of PFI increase with elevation in temperature as fewer water molecules are present around the hydrophobic groups at higher temperatures (Fersht 2002). Because the formation of PFI from native insulin is endothermic and will have a positive enthalpy change (Naiki and Gejyo 1999; Dzwolak et al. 2003), the overall negative enthalpy values for insulin fibrillation should be due to the exothermic process of PFI conversion to amyloid fibrils.
The free energy change during amyloid formation from PFI can be represented as:
 |
This process will have a negative entropy contribution (ΔSAmyloid–PFI), as the amyloid fibril will have a more ordered structure compared to PFI. An increasingly negative enthalpy change (ΔHAmyloid–PFI), coupled with a negative entropy contribution for PFI conversion to amyloid, gives a minimum for free energy of fibrillation that corresponds to a point of maximum amyloid growth rate. In our work, this point was reached at ~80°C. It is hypothesized here that the increase in magnitude of enthalpy change for the folding process reaches a saturation phase for temperatures above 80°C. Saturation in the enthalpy change will lead to an increase in magnitude of free energy after this minimum, as the entropy term (TΔSAmyloid–PFI) will become dominant with a further increase in temperature. Therefore, the free energy value (ΔGAmyloid–PFI) increases on either side of this minimum, resulting in a non-Arrhenius amyloid fibrillation. Unfortunately, no specific heat capacity data or enthalpy change data could be found for temperatures above 75°C, and it may be very difficult to experimentally verify the same according to previous reports (Dzwolak et al. 2003).
In conclusion, this work confirms the formation of an amyloid structure by insulin at or above 100°C. We have established that the insulin amyloid formation follows non-Arrhenius kinetics in the temperature range from 37°C to 140°C. The rate of amyloid formation increased from an ambient temperature up to the threshold temperature of ~80°C, followed by a subsequent decrease, and was gradually replaced by random coil formation to 140°C. This trend is successfully explained by our hypothesis for the underlying thermodynamics in terms of variable enthalpy of amyloid formation at elevated temperatures leading to a minimum in free energy change. The presence of a partially folded intermediate with a reversible nature is shown as a common stage for the amyloid fibrillation pathway as well as in random coil formation. The schematic for this mechanism suggested in this work may be useful in elucidating pathways in fibrillation of other amyloidogenic proteins over a broad temperature range.
Materials and methods
In vitro amyloid fibrillation
All chemicals and reagents were purchased from Sigma-Aldrich Co. Bovine insulin stock solution was freshly prepared at 1 mg/mL in glycine buffer (pH 2, 20 mM). Storage of solutions was avoided to prevent any possible aggregation under storage conditions. Incubations were carried out at temperatures ranging from 37°C to 140°C in glass vials with a capacity of 1.8 mL. The vials were tightly sealed with a rubberized aluminum seal to prevent any possible evaporation. All the experiments in Figure 1 ▶–4 ▶ were performed at constant temperatures. In the case of Figure 5 ▶, temperature adjustments were completed within 5 min to minimize any possible effect of temperature variation during transition. The length of incubation was set as the time taken to reach the saturation phase of the amyloid formation in each case.
Thioflavin T (ThT) fluorescence measurement
ThT stock solution was prepared in Tris buffer (pH 8, 20 mM) at a concentration of 500 μM and stored at 4°C. Samples (5 μL) were mixed with a 1.5-mL ThT working solution at 50 μM in a quartz cuvette. All fluorescence measurements were carried out at ambient temperature with a spectrofluorophotometer (Model RF5301, Shimadzu Co.) according to Levine (1993). The samples were excited at a wavelength of 450 nm, with emission measured at 482 nm. The excitation and emission slit widths were set at 5 nm each. Readings were done in triplicate, and the average was used for data analysis.
Circular dichroism (CD) spectroscopy
Sample volumes (40 μL) were diluted with glycine buffer (pH 2, 20 mM) to 300 μL in a quartz cell with a 0.1-mm pathlength for use in CD spectra measurement. Spectra were measured on a spectropolarimeter (Model J-710, Jasco Co.) by a scanning sample from 190 nm to 260 nm and ran at a scan speed of 50 nm/min and resolution of 0.5 nm. For analysis, the spectrum of the glycine buffer was subtracted from the sample spectra.
Atomic force microscopy (AFM)
AFM was used to visualize fibrils as per method described by Stine et al. (1996). Briefly, an aliquot of 5 μL from the incubated solution was placed on freshly cleaved mica at room temperature for a few seconds. Samples were diluted twice with 50 μL of deionized water followed by drying with nitrogen gas. AFM tips were used at a resonant frequency of 306–444 kHz for imaging fibrils with Nanoprobe III (Digital Instruments Inc.). Each image was acquired in a tapping mode under ambient conditions at a scan frequency of 1~2 Hz. At least two different samples and five spots with area of 2 × 2 μm2 were analyzed in each case. Representative images were selected for comparative studies.
Analysis of amyloid growth rate
The growth of the amyloid structure was monitored by ThT-induced fluorescence and followed the typical sigmoidal curve; having an initial lag phase with no increase of fluorescence, followed by elongation and then a saturation phase (Cerny et al. 1981; Naiki and Gejyo 1999). The rate of amyloid formation was calculated as the slope of fluorescence increases during the elongation phase and plotted against the inverse of temperature.
The publication costs of this article were defrayed in part by payment of page charges. This article must therefore be hereby marked “advertisement” in accordance with 18 USC section 1734 solely to indicate this fact.
Article published online ahead of print. Article and publication date are at http://www.proteinscience.org/cgi/doi/10.1110/ps.04823504.
References
- Ahmad, A., Millett, I.S., Doniach, S., Uversky, V.N., and Fink, A.L. 2003. Partially folded intermediates in insulin fibrillation. Biochemistry 42 11404–11416. [DOI] [PubMed] [Google Scholar]
- Baker, E.N., Blundell, T.L., Cutfield, J.F., Cutfield, S.M., Dodson, E.J., and Dodson, G.G. 1988. The structure of 2Zn pig insulin crystals at 1.5Å resolution. Philos. Trans. R. Soc. Lond. 319 369–456. [DOI] [PubMed] [Google Scholar]
- Bouchard, M., Zurdo, J., Nettleton, E.J., Dobson, C.M., and Robinson, C.V. 2000. Formation of insulin amyloid fibrils followed by FTIR simultaneously with CD and electron microscopy. Protein Sci. 9 1960–1967. [DOI] [PMC free article] [PubMed] [Google Scholar]
- Brange, J., Andersen, L., Laursen, E.D., Meyn, G., and Rasmussen, E. 1997a. Toward understanding insulin fibrillation. J. Pharm. Sci. 86 517–525. [DOI] [PubMed] [Google Scholar]
- Brange, J., Dodson, G.G., Edwards, D.J., Holden, P.H., and Whittingham, J.L. 1997b. A model of insulin fibrils derived from the X-ray crystal structure of a monomeric insulin (despentapeptide insulin). Proteins 27 507–516. [PubMed] [Google Scholar]
- Cerny, L.C., Stasiw, D.M., and Zuk, W. 1981. The logistic curve for the fitting of sigmoidal data. Physiol. Chem. Phys. 13 221–230. [PubMed] [Google Scholar]
- Chen, B., Baase, W.A., and Schellman, J.A. 1989. Low-temperature unfolding of a mutant of phage T4 lysozyme. 2. Kinetic investigations. Biochemistry 26 691–699. [DOI] [PubMed] [Google Scholar]
- Dzwolak, W., Ravindra, R., Lendermann, J., and Winter, R. 2003. Aggregation of bovine insulin probed by DSC/PPC calorimetry and FTIR spectroscopy. Biochemistry 42 11347–11355. [DOI] [PubMed] [Google Scholar]
- El-Bastawissy, E., Knaggs, M.H., and Gilbert, I.H. 2001. Molecular dynamics simulations of wild-type and point mutation human prion protein at normal and elevated temperature. J. Mol. Graph. Modell. 20 145–154. [DOI] [PubMed] [Google Scholar]
- Fersht, A. 2002. Protein stability. In Structure and mechanism in protein science, pp. 508–538. W.H. Freeman and Company, New York.
- Furuya, H., Saravia, M.J.M., Gawinowicz, M.A., Alves, I.L., Costa, P.P., Sasaki, H., Goto, I., and Sakaki, Y. 1991. Production of recombinant human transthyretin with biological activities toward the understanding of the molecular basis of familial amyloidotic polyneuropathy (FAP). Biochemistry 30 2415–2421. [DOI] [PubMed] [Google Scholar]
- Galani, D. and Apenten, R.K.O. 1999. Heat-induced denaturation and aggregation of β-lactoglobulin: Kinetics of formation of hydrophobic and disulphide-linked aggregates. Int. J. Food Sci. Tech. 34 467–476. [Google Scholar]
- Harper, J.D. and Lansbury, P.T. 1997. Models of amyloid seeding in Alzheimer’s disease and scrapie: Mechanistic truths and physiological consequences of the time-dependent solubility of amyloid proteins. Annu. Rev. Biochem. 66 385–407. [DOI] [PubMed] [Google Scholar]
- Hespenheide, B.M., Rader, A.J., Thorpe, M.F., and Kuhn, L.A. 2002. Identifying protein folding cores from the evolution of flexible regions during unfolding. J. Mol. Graph. Modell. 21 195–207. [DOI] [PubMed] [Google Scholar]
- Huber, R., Huber, H., and Stetter, K.O. 2000. Towards the ecology of hyperthermophiles: biotopes, new isolation strategies and novel metabolic properties. FEMS Microbiol. Rev. 24 615–623. [DOI] [PubMed] [Google Scholar]
- Jayaraman, G., Kumar, T.K.S., Sivaraman, T., Lin, W.Y., Chang, D.K., and Yu, C. 1996. Thermal denaturation of an all β-sheet protein—Identification of a stable partially structured intermediate at high temperature. Int. J. Biol. Macromol. 18 303–306. [DOI] [PubMed] [Google Scholar]
- Jiménez, J.L., Nettleton, E.J., Bouchard, M., Robinson, C.V., Dobson, C.M., and Saibil., H.R. 2002. The protofilament structure of insulin amyloid fibrils. Proc. Natl. Acad. Sci. 99 9196–9201. [DOI] [PMC free article] [PubMed] [Google Scholar]
- Kisilevsky, R. 2000. Review: Amyloidogenesis—Unquestioned answers and unanswered questions. J. Struct. Biol. 130 99–108. [DOI] [PubMed] [Google Scholar]
- Kusumoto, Y., Lomakin, A., Teplow, D.B., and Benedek, G.B. 1998. Temperature dependence of amyloid β-protein fibrillation. Proc. Natl. Acad. Sci . 95 12277– 12282. [DOI] [PMC free article] [PubMed] [Google Scholar]
- Lai, Z., Colón, W., and Kelly, J.W. 1996. The acid-mediated denaturation pathway of transthyretin yields a conformational intermediate that can self-assemble into amyloid. Biochemistry 35 6470–6482. [DOI] [PubMed] [Google Scholar]
- Levine, H. 1993. Thioflavin T interaction with synthetic Alzheimer’s disease β-amyloid peptides: Detection of amyloid aggregation in solution. Protein Sci. 2 404–410. [DOI] [PMC free article] [PubMed] [Google Scholar]
- Makhatadze, G.I. and Privalov, P.L. 1995. Energetics of protein structure. Adv. Protein Chem. 47 307–425. [DOI] [PubMed] [Google Scholar]
- McLaurin, J., Yang, D.S., Yip, C.M., and Fraser, P.E. 2000. Review: Modulating factors in amyloid-β fibril formation. J. Struct. Biol. 130 259–270. [DOI] [PubMed] [Google Scholar]
- Meersman, F. and Heremans, K. 2003. Temperature-induced dissociation of protein aggregates: accessing the denatured state. Biochemistry 42 14234–14241. [DOI] [PubMed] [Google Scholar]
- Millican, R.L. and Brems, D.N. 1994. Equilibrium intermediates in the denaturation of human insulin and two monomeric insulin analogs. Biochemistry 33 1116–1124. [DOI] [PubMed] [Google Scholar]
- Murphy, R.M. 2002. Peptide aggregation in neurodegenerative disease. Annu. Rev. Biomed. Eng. 4 155–174. [DOI] [PubMed] [Google Scholar]
- Naiki, H. and Gejyo, F. 1999. Kinetic analysis of amyloid fibril formation. Methods Enzymol. 309 305–318. [DOI] [PubMed] [Google Scholar]
- Nettleton, E.J., Tito, P., Sunde, M., Bouchard, M., Dobson, C.M., and Robinson, C.V. 2000. Characterization of the oligomeric states of insulin in self-assembly and amyloid fibril formation by mass spectrometry. Biophys. J. 79 1053–1065. [DOI] [PMC free article] [PubMed] [Google Scholar]
- Nielsen, L., Khurana, R., Coats, A., Frokjaer, S., Brange, J., Vyas, S., Uversky, V., and Fink, A.L. 2001. Effects of environmental factors on the kinetics of insulin fibril formation: Elucidation of the molecular mechanism. Biochemistry 40 6036–6046. [DOI] [PubMed] [Google Scholar]
- Oliveberg, M., Tan, Y.-J., and Fersht, A.R. 1995. Negative activation enthalpies in the kinetics of protein folding. Proc. Natl. Acad. Sci. 92 8926–8929. [DOI] [PMC free article] [PubMed] [Google Scholar]
- Prusiner, S.B. 1987. An introduction to prion biology and diseases. In Prion biology and diseases (ed. S.B. Prusiner), pp. 1–66. Cold Spring Laboratory, Cold Spring Harbor, NY.
- Ptitsyn, O.B. 1992. The molten globule state. In Protein folding (ed. T.E. Creighton), pp. 243–300. W.H. Freeman and Company, New York.
- Rafikova, E.R., Kurganov, B.I., Arutyunyan, A.M., Kust, S.V., Drachev, V.A., and Dobrov, E.N. 2003. A mechanism of macroscopic (amorphous) aggregation of the tobacco mosaic virus coat protein. Int. J. Biochem. Cell Biol. 35 1452–1460. [DOI] [PubMed] [Google Scholar]
- Robb, F.T. and Maeder, D.L. 1998. Novel evolutionary histories and adaptive features of proteins from hyperthermophiles. Curr. Opin. Biotechnol. 9 288–291. [DOI] [PubMed] [Google Scholar]
- Rochet, J.C. and Lansbury, P.T. 2000. Amyloid fibrillogenesis: Themes and variations. Curr. Opin. Struct. Biol. 10 60–68. [DOI] [PubMed] [Google Scholar]
- Steelman, V.M. 1994. Creutzfeld-Jakob disease: Recommendations for infection control. Am. J. Infect. Control 22 312–318. [DOI] [PubMed] [Google Scholar]
- Stetter, K.O. 1999. Extremophiles and their adaptation to hot environments. FEBS Lett. 452 22–25. [DOI] [PubMed] [Google Scholar]
- Stine, W.B., Snyder, S.W., Lardor, U.S., Wade, W.S., Miller., M.F., Perun, T.J., Holzman, T.F., and Krafft, G.A. 1996. The nanometer-scale structure of amyloid-β visualized by atomic force microscopy. J. Protein Chem. 15 193–203. [DOI] [PubMed] [Google Scholar]
- Thomas, T.M. and Scopes, R.K. 1998. The effects of temperature on the kinetics and stability of mesophilic and thermophilic 3-phosphoglycerate kinases. Biochem. J. 330 1087–1095. [DOI] [PMC free article] [PubMed] [Google Scholar]
- Uversky, V.N., Li, J., and Fink, A.L. 2001. Pesticides directly accelerate the rate of α-synuclein fibril formation: A possible factor in Parkinson’s disease. FEBS Lett. 500 105–108. [DOI] [PubMed] [Google Scholar]
- Vieille, C. and Zeikus, J.G. 1996. Thermozymes: Identifying molecular determinants of protein structural and functional stability. Trends Biotechnol. 14 183–190. [Google Scholar]
- Vieille, C., Burdette, D.S., and Zeikus, J.G. 1996. Thermozymes. Biotechnol. Annu. Rev. 2 1–83. [DOI] [PubMed] [Google Scholar]
- Whittingham, J.L., Scott, D.J., Chance, K., Wilson, A., Finch, J., Brange, J., and Dodson, G. G. 2002. Insulin at pH 2: Structural analysis of the conditions promoting insulin fiber formation. J. Mol. Biol. 318 479–490. [DOI] [PubMed] [Google Scholar]