

Abstract
The flavin enzyme dihydroorotate dehydrogenase (DHOD; EC 1.3.99.11) catalyzes the oxidation of dihydroorotate to orotate, the fourth step in the de novo pyrimidine biosynthesis of UMP. The enzyme is a promising target for drug design in different biological and clinical applications for cancer and arthritis. The first crystal structure of the class 2 dihydroorotate dehydrogenase from rat has been determined in complex with its two inhibitors brequinar and atovaquone. These inhibitors have shown promising results as anti-proliferative, immunosuppressive, and antiparasitic agents. A unique feature of the class 2 DHODs is their N-terminal extension, which folds into a separate domain comprising two α-helices. This domain serves as the binding site for the two inhibitors and the respiratory quinones acting as the second substrate for the class 2 DHODs. The orientation of the first N-terminal helix is very different in the two complexes of rat DHOD (DHODR). Binding of atovaquone causes a 12 Å movement of the first residue in the first α-helix. Based on the information from the two structures of DHODR, a model for binding of the quinone and the residues important for the interactions could be defined. His 56 and Arg 136, which are fully conserved in all class 2 DHODs, seem to play a key role in the interaction with the electron acceptor. The differences between the membrane-bound rat DHOD and membrane-associated class 2 DHODs exemplified by the Escherichia coli DHOD has been investigated by GRID computations of the hydrophobic probes predicted to interact with the membrane.
Keywords: dihydroorotate dehydrogenase, inhibitor binding, brequinar, atovaquone, domain movement, membrane association
Dihydrorotate dehydrogenase (DHOD) (EC 1.3.99.11) catalyzes the fourth step and only redox reaction in the de novo pyrimidine biosynthesis, the stereospecific oxidation of (S)-DHO to orotate accompanied by the reduction of the prosthetic flavin (FMN) group (Fig. 1 ▶). A phylogenetic analysis of available DHOD sequences revealed that DHOD from different organisms can be assigned to two different major classes: class 1 and class 2 (Björnberg et al. 1997). Class 1 DHODs originating mainly from gram-positive bacteria can furthermore be divided into subclasses 1A, 1B, and a new type 1S identified in Sulfolobus solfataricus (Sørensen and Dandanell 2002). The DHODs belonging to the different classes differ also in their location in the cell. The class 1A and 1B DHODs are found in the cytosol, whereas those from class 2 are membrane associated. Another distinct difference between the two classes of enzymes is their natural electron acceptor used to reoxidize the flavin group.
Figure 1.

The reaction catalyzed by class 2 DHODs and chemical structure of the DHOD inhibitors atovaquone, brequinar, and A771726. This figure is produced by ISIS draw 2.4 (MDL Information Systems, Inc.).
Lactococcus lactis contains two genes encoding for DHODs representing subclass 1A and 1B, DHODA and DHODB, respectively. They differ in their structural organization and use of electron acceptor. The DHODA enzyme is a homodimer comprising two PyrDA subunits with an (αβ)8 barrel fold and the prosthetic FMN group located at the C-terminal ends of the β-strands at the top of the barrel (Rowland et al. 1997); it uses fumarate as its natural electron acceptor (Andersen et al. 1996). The DHODB is a heterotetramer composed of a central homodimer of PyrDB subunits resembling the DHODA structure and two PyrK subunits (Rowland et al. 2000). It is the presence of the PyrK subunits, which contain an FAD group and a [2Fe-2S] cluster, that enables the class 1B enzymes to use NAD+ as the natural electron acceptor (Nielsen et al. 1996). Class 1S DHOD can use Q0 and molecular oxygen as electron acceptors, together with the unphysiological substrates ferricyanide and DCIP used in in vitro measurements (Sørensen and Dandanell 2002).
The membrane-associated class 2 DHODs found in gram-negative bacteria and in eukaryotes are monomeric enzymes that have the respiratory quinones as their physiological electron acceptors (Fig. 1 ▶; Björnberg et al. 1999). A major structural difference between the class 1 and class 2 DHODs is their extended N terminus. The structure determinations for the DHODC and DHODH, truncated to be of the same length as DHODC, showed that the N terminus in the class 2 enzymes comprises a separate domain with two α-helices located on the top of the catalytic (αβ)8 barrel close to the FMN group (Liu et al. 2000; Nørager et al. 2002). All eukaryotic enzymes from class 2 are located in the mitochondrial membrane attached by transmembrane α -helices, whereas the gram-negative bacterial enzymes are associated with the cytosolic side of the outer membrane. The extension of the N terminus in class 2 DHODs is thought to serve as a targeting signal guiding the enzyme to its location in the inner mitochondrial membrane (Rawls et al. 2000; Löffler et al. 2002)
A basic residue in the active site mediates the stereospecific oxidation of (S)-DHO. It is a cysteine in the class 1 enzymes (Björnberg et al. 1997) and a serine residue in the class 2 DHODs (Björnberg et al. 1999). The basic residue is located in a loop in close contact to DHO bound on top of the FMN group. This position facilitates abstraction of a proton from the C5 atom of DHO in the enzymatic reaction, where a double bond between C5 and C6 is formed due to the transfer of a hydride ion from C6 to the N5 atom of FMN (Fig. 1 ▶). The second half reaction uses the respiratory quinones as electron acceptors. Their proposed binding site (Liu et al. 2000) is the N-terminal domain, where they are able to mediate the electron transfer to the FMNH2 group bound in the (αβ)8 barrel, as shown in Figure 1 ▶.
The inhibition of DHODs causes a lowering of the intracellular pools of uracil, cytosine, and thymine nucleotides in cells, which makes DHODs attractive drug targets (Fairbanks et al. 1995). Most organisms are able to use a salvage pathway for pyrimidine nucleotide biosynthesis. It allows the pyrimidine bases or nucleosides formed from degradation of nucleotides and nucleic acids to be reused by salvage reactions. Some of the genes encoding for the enzymes in the pyrimidine salvage pathway were not identified in the genomes of two organisms affecting human health, the bacterium Helicobacter pylori causing stomach ulcers and stomach cancer and the malaria-causing parasite Plasmodium. They therefore depend exclusively on de novo synthesis of pyrimidine nucleotides, which explains why DHODs from these organisms are very attractive drug targets. Rapidly dividing human cells, like activated lymphocytes (Cutolo et al. 2003) and cancer cells (Shawver et al. 1997) require also a functional de novo nucleotide pathway to meet their requirement for nucleotides because recycling using salvage pathways of the already existing nucleotide pool through salvage pathways is not sufficient (Fairbanks et al. 1995).
The immunomodulating drug leflunomide (Arava) has been approved for the treatment of rheumatoid arthritis (Goldenberg 1999). It has been shown that this drug inhibits DHODH and thereby inhibits the pyrimidine de novo biosynthetic pathway (Davis et al. 1996). The structure of DHODH is known in complex with A771726, the active metabolite of the prodrug leflunomide (DHODH-lefl) and brequinar (DHODH-breq) (Liu et al. 2000). From the analysis of the two structures of DHODH, it was concluded that the inhibitors could bind to the same site as the second natural substrate, the respiratory quinone. This feature was also deduced from enzyme kinetics studies of most of the class 2 enzyme inhibitors reported so far (Bader et al. 1998; Knecht et al. 2000). Considerable efforts have been put into structure activity analysis for DHODs from different organisms, among them rat and mouse (Knecht et al. 2000).
An interesting feature of class 2 DHODs is the relatively small number of conserved residues located in their extended N termini. This explains why the N-terminal domains in the known structures of the class 2 DHODs display significant variations in the length and orientation of the helices that form this domain (Nørager et al. 2002). The comparison of the sequences from DHODH, DHODC, and DHODR in Figure 2 ▶ reveals that, among the residues corresponding to the first 40 residues of DHODC, there are only six conserved. It is likely that this variation is the origin of the different behavior of inhibitors even for very closely related DHODs like the rat and human (Knecht and Löffler 1998). Thus, it seems possible to design inhibitors that are specific for a given organism, as demonstrated by structure-activity studies made on class 2 DHODs (Copeland et al. 2000).
Figure 2.
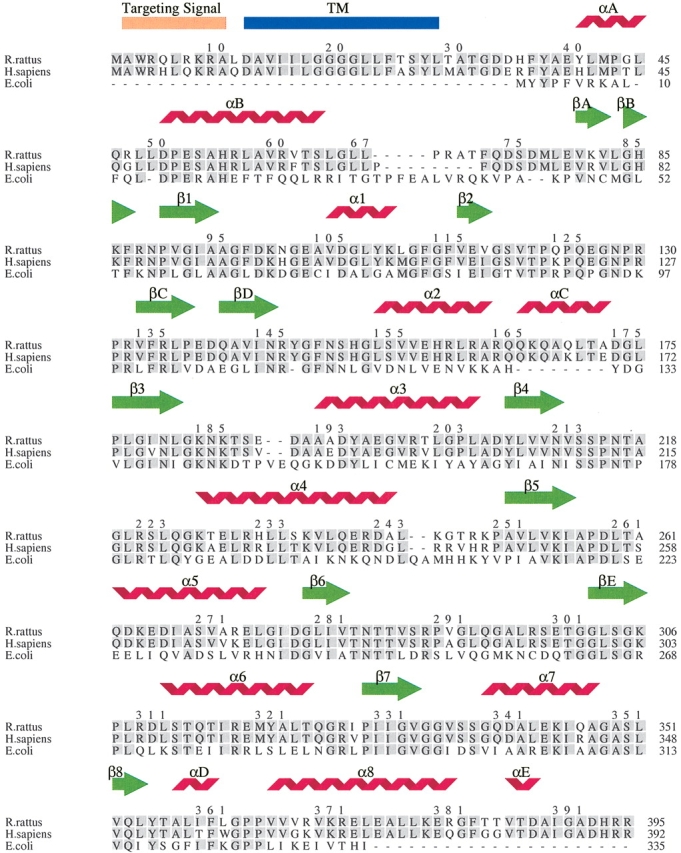
Structural alignment of DHODR, DHODH, and DHODC sequences. The structural elements correspond to the DHODR structures. α-Helixes in the central barrel are named α1–α8 and β-sheets in the barrel are named β1–β8. α-Helixes and β-sheets outside the barrel are named αA-αE and βA-βE. The predicted transmembrane helix (TM) is labeled in blue. The predicted targeting signal is labeled in orange. Identical residues are labeled with a grey box. This figure was produced using the program Indonesia (D. Madsen, P. Johansson, S. Arent, M.R. Harris, and G.J. Kleywegt, unpubl.; http://alpha2.bmc.uu.se/dennis/).
The work presented here addresses the differences between the class 2 DHODs. We have determined the crystal structures of the DHOD from rat, truncated like DHODH to be of the same length as DHODC, in complex with brequinar (DHODR-breq) and atovaquone (DHODR-ato). Atovaquone (Fig. 1 ▶) is a structural analog of ubiquinone. It is used as a broad-spectrum antiparasitic drug and has showed activity against various parasitic infections, such as malaria, toxoplasmosis (caused by Toxoplasma gondii), and pneumonia (Pneumocystis carinii) (Kaneshiro et al. 2000). Atovaquone has passed clinical trials and thereby received approval to combat Plasmodium falciparum. The primary mechanism of action in Plasmodium falciparum is the irreversible binding to the mitochondrial cytochrome bc1 complex, but it is also a potent inhibitor of DHOD activity (Ittarat et al. 1994). Atovaquone is marketed in the United States under the trade name Mepron. Atovaquone is one of the active compounds in Malarone (GlaxoSmithKline), used in the prophylaxis (prevention) and treatment of malaria. Brequinar is a quinoline carboxylic acid, which has been tested preclinically as a cytostatic agent.
The three inhibitors atovaquone, A77126, and brequinar (known to inhibit different class 2 DHODs) are chemically different and do not mimic the natural electron acceptor, as shown in Figure 1 ▶. Our analysis of the two structures of DHODR-ato and DHODR-breq revealed a remarkable difference in the conformation of their small N-terminal domain. A comparison to the structures of inhibited DHODH have revealed subtle differences in the N-terminal domain that can explain why the DHOD inhibitors act differently on the two highly homologous enzymes. These results are valuable for the structural-based drug design of organism-specific inhibitors of DHOD, and have formed the basis for a modeling of quinone binding. Furthermore, we present an analysis of the differences in the N-terminal domain between the class 2 membrane-bound and membrane-associated DHOD, based on computational GRID modeling.
Results and Discussion
The structures of DHODR
The structures of the truncated DHODR complexed with brequinar (DHODR-breq) and atovaquone (DHODR-ato) have been determined to 2.4 Å and 2.3 Å resolution, respectively. Overall pictures of the two structures are presented in Figure 3 ▶, A and B. DHODR-ato comprises two independent but identical complexes. Superimposition calculated with default values in the program O (Jones et al. 1991) shows an rmsd of 0.14 Å for 358 Cα atoms. Like the other known class 2 DHOD structures, DHODR is a monomer, which folds into a small N-terminal domain and an (αβ)8 barrel comprising the larger C-terminal domain. The smaller N-terminal domain contains the two α-helices (αA and αB). A remarkable difference is noted between the DHODR-ato and DHODR-breq structures with respect to the orientation of the αA-helix, which adopts very different positions in the two structures (Fig. 3A,B ▶). The similarity between the two DHODR-ato complexes in the asymmetric unit and the absence of close (<3.9 Å) crystal contacts make it unlikely that the difference between the two DHODR structures is due to crystal-packing effects. Superimposition of the two structures in two different orientations is shown in Figure 3C ▶. Using the position of the N-terminal Tyr 38 Cα atom as a measure, the N-terminal α-helix exhibits a relative movement of 12.2 Å. The angle between the two orientations of the helix is 62°, with an rmsd of 4.57 Å for the 32 Cα atoms in the αA-helix (Tyr 38–Pro 69) calculated using LSQMAN (Kleywegt and Jones 1999). Calculation of the accessible surface area of DHODR in the two complexes did not reveal any significant differences; thus, the different orientation of the αA-helix in DHODR-ato does not represent a more solvent-exposed structure.
Figure 3.

(A) DHODR-breq, DHODR in complex with brequinar (light blue). FMN and orotate are colored in light grey. The small N-terminal domain is colored in dark gray. The cations are shown as black spheres. (B) DHODR-ato, DHODR in complex with atovaquone (yellow). FMN and orotate are colored in light gray. The bound β-octylglucoside is shown in black and the small N-terminal domain is colored in dark gray. (C) Two views of the superimposition of DHODR-ato Cα-trace (red) with atovaquone (yellow) and DHODR-breq Cα-trace (blue) with brequinar (light blue). FMN and orotate are colored in gray. These figures were produced by Swiss PDB-Viewer (Guex and Peitsch 1997).
Two N-terminal α-helices, αA and αB, form a hydrophobic entrance to the FMN group located on the top of the (αβ)8 barrel. Orotate is bound as in the complexes of the class 1A and 1B enzymes with the ring system stacked at the si-face of FMN (Rowland et al. 1998, 2000). The presence of bound cations in DHODR-breq and a detergent molecule, β-octylglucoside, in DHODR-ato can be attributed to the difference in crystallization conditions. The cations are located far from the substrate and inhibitor binding sites, and the detergent molecule is localized parallel to α1- and α2-helices of the (αβ)8 barrel. The flexible loop with many conserved residues covering the active site is poorly defined in the electron densities of the DHODR structures. The disorder of this loop has the implication that Asn 217–Leu 224 and Pro 216–Leu 224 could not be traced in the electron density maps for DHODR-breq and DHODR-ato, respectively.
Comparison to the structures of other class 2 DHODs
The structures of DHODR-ato and DHODR-breq were compared with the structures of DHODC, DHODH-breq, and DHODH-lefl. The overall fold of DHODR-breq is very similar to the fold observed in these three structures, whereas the DHODR-ato displays a unique orientation of the N-terminal αA-helix. Superposition of DHODR-breq and DHODH-breq using default values in the program O (Jones et al. 1991) gives rmsd values of 0.536 Å for 339 Cα atoms. The inhibitors in the DHOD structures bind in the same location, between the two N-terminal helices αA and αB suggested as the binding site for the natural quinone substrate (Liu et al. 2000). This binding site is empty in DHODC, which was determined without any inhibitors. The N-terminal domain of DHODC differs from the other DHOD structures by having a distinct kink in the αB-helix, with the last part comprising a 310 helix (Nørager et al. 2002).
Brequinar binding in DHODR
The overall binding of brequinar in DHODR-breq is illustrated in Figure 3A ▶ and in more detail in Figure 4A ▶. Brequinar interacts with residues coming from the helices of the N-terminal helix, the loop connecting the two domains, βC, one of the additional β strands in the (αβ)8 barrel, and the first residue of α8. The carboxylate group of brequinar forms a hydrogen-bonded ring system with Arg 136. The hydrophobic moiety of brequinar is in contact with Met 43, Ala 59, Leu 68, Pro 364, Ala 55, Leu 46, and Ile 360. The stacking interactions between the fluorosubstituted quinoline ring system and the imidazole ring of His 56 seems also to be important for the brequinar binding (Fig. 4A ▶). Brequinar binding in DHODR-breq resembles the binding of brequinar in DHODH, but the IC50-value of brequinar is 127 nM for DHODR and 6 nM for DHODH (Ullrich et al. 2001). To explain this significant difference in inhibition, we made a superimposition of the N-terminal domains of DHODR and DHODH. The binding of brequinar is alike in the two DHODs; however, Phe 62 in the DHODH (replaced with Val 62 in the DHODR) could give a better interaction with the aromatic ring, explaining why brequinar binds more strongly to DHODH. The aromatic ring in Phe 62 is almost perpendicular to the fluoro substituted part of the quinoline ring system of brequinar.
Figure 4.
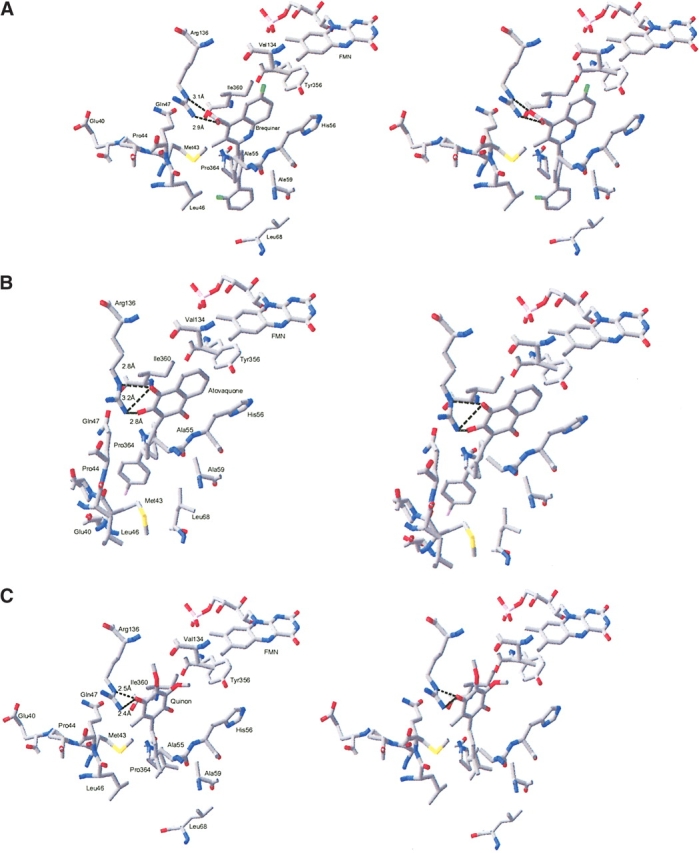

Stereo diagrams showing the inhibitor and substrate binding sites in the class 2 DHODs. (A) Brequinar binding site. Residues Ala 55, Leu 46, and Ile 360, which make hydrophobic contacts to brequinar, are not shown in the picture. (B) Atovaquone binding site. Residues His 56, Val 134, and Met 43 are not shown in the picture. (C) Modeled binding of the quinone substrate to DHODR. Nitrogen atoms are shown in blue; oxygen, in red; and fluoride, in green. The distances given are in Ångstroms. (D) The DHODC with an empty inhibitor site seen in the same view as the DHODR. The figures are produced by Swiss PDB-Viewer (Guex and Peitsch 1997).
Atovaquone binding in DHODR
Atovaquone also displays pronounced differences with respect to inhibition of DHODH and DHODR: the IC50 value is 14,500 nM for DHODH and 698 nM for DHODR (Knecht et al. 2000). A detailed structural picture of the binding of atovaquone in DHODR is presented in Figure 4B ▶. Atovaquone interacts with residues from the same sequence regions as brequinar. The interactions to the pyrrolidone rings of Pro 44 and Pro 364, which stack with the para-chloro phenyl group seem also to be significant. There are other hydrophobic interactions between atovaquone and His 56, Tyr 356, Val 134, Ile 360, Ala 55, Gln 47, and Met 43. Arg 136 is essential for the binding of atovaquone. It forms a hydrogen-bonded ring system with the hydroxy and one of the carbonyl groups of the fused ring system resembling the one involving the carboxylate group of brequinar. The side chain of Arg 136 adopts quite different conformations in the two DHODR structures, as illustrated by the differences in the CHI and CHI3 torsion angles as calculated with O (Jones et al. 1991). They are −61° and 175° in the atovaquone complex compared with −157° and −57° in the brequinar complex. The hydrogen bonds between atovaquone and Arg 136 open an opportunity for interactions between the first residue Glu 40 in α-helix 1 and the chloro atom in atovaquone. A comparison of this region in DHODR-breq and DHODR-ato reveals that if the N-terminal αA-helix is positioned like that in the brequinar structure, it would lead to clashes between the p-chloro-phenyl group and Glu 40. The movement of the αA-helix enables the formation of a hydrogen bond between the side chain of Gln 47 (NE2) and the backbone carbonyl group of Ile 360, an interaction that can contribute to the stabilization of the orientation of the αA-helix in the DHODR-ato structure. Superimposition of the Cα atoms of the two rat structures (Fig. 3C ▶) reveals that atovaquone is bent toward α-helix 1. Atovaquone appears more deeply buried in the tunnel compared with brequinar and therefore closer to FMN. Interestingly, kinetic experiments with the DHODR (Knecht et al. 2000) showed that both atovaquone and brequinar are uncompetitive inhibitors with respect to dihydroorotate. However, atovaquone was found to be a competitive inhibitor with respect to the ubiquinone substrate QD,, whereas brequinar did not show pure competitive inhibition with respect to QD. Its noncompetition of DHODR could be identified as a “mixed-type”inhibition (Copeland 2000; Knecht et al. 2000). On the basis of kinetic investigations, it was proposed that though the two inhibitors bind to the same QD binding site, they have different interactions with the enzyme. The naphthoqinone ring system makes atovaquone structurally more similar to QD than brequinar (Fig. 1 ▶). The fact that it functions as a competitive inhibitor against the electron acceptor confirms that it is bound at the same site.
Inhibitor binding in different DHODs
Whereas leflunomide’s active metabolite A771726 and brequinar (Fig. 1 ▶) inhibit DHODH and DHODR, they do not inhibit DHODC (K.F. Jensen, unpubl.). From the DHODH-breq and DHODH-lefl structures, the following residues were identified as interacting with the inhibitors: Gln Arg 136, His 56, Tyr 356, Thr 360, and Met 43, Ala 59, 68, Pro 364 (Liu et al. 2000). A structural-based sequence comparison of the DHODH, DHODR, and DHODC (Fig. reveals that only four of these nine residues are conserved the three organisms: Arg 136, His 56, Tyr 356, and Pro noting that only His 56 is located in the N-terminal domain This could explain why inhibition patterns of the three zymes DHODC, DHODR, and DHODH are significantly different.
The empty N-terminal domain of DHODC is depicted in Figure 4D ▶. From the comparison to the DHODH structure (Nørager et al. 2002), the following residues in the N-terminal domain were identified as being of potential significance for the difference between the two enzymes in inhibitor binding: Met 43, Gln47, and Ala59, which are all conserved in DHODR and DHODH but lacking in DHODC. In addition, Val 134 can play a role for the differences in inhibition as this is replaced by a leucine in DHODC.
Inhibition studies
The structures were determined for the truncated histidinetagged enzyme. In order to examine how far the N-terminal truncation influenced the biological function, the efficacy of atovaquone and brequinar with truncated DHODR was evaluated from dose-response curves with the inhibitor and compared with that observed with the full-length enzyme. Because IC50 values (inhibitor concentration giving 50% inhibition) of a particular inhibitor can change with changing solution conditions (Copeland 2000), the values were determined under the same standardized assay conditions as previously applied for the full-length enzyme (Knecht et al. 2000; Ullrich et al 2002).
The IC50 values as obtained from dose-response curves are presented in Table 1 with those determined with the full-length DHODR for comparison. Both versions of the rat enzyme are more sensitive to brequinar than atovaquone. The difference of drug efficiency between the truncated and the full-length enzyme could indicate that access to the binding site to a certain extent is influenced by the N terminus. Interestingly, the difference observed here for the quinone analogs atovaquone and brequinar was not detected with the isoxazole class of malonnitrilamide compounds, A771726, MNA 279, and MNA 715. These revealed fairly identical IC50 values when comparisons between the full-length and truncated DHODR were made (Knecht and Löffler 1998; Ullrich et al. 2001).
Table 1.
IC50values for inhibition of full-length rat DHODR and 29 amino acids of truncated rat DHODR
| Compound | IC50 for full-length rat DHOD (nM) | IC50 for truncated rat DHOD, N-terminal Δ29 amino acids (nM) |
| Atovaquone | 698 ± 64a | 904 ± 100 |
| Brequinar | 367 ± 100b | 127 ± 21c |
The rat DHODase activity was determined with 1 mM dihydroorotate and 0.1 mM QD. Dose response curves for inhibition were obtained by varying the drug concentrations from 20 nM up to 200 μM atovaquone. Results are means of three determinations and are given ± S.D.
The role of the N-terminal extension of class 2 DHODs
Class 2 DHODs are all associated with membranes and have an extended N terminus compared with the class 1 DHODs. DHODC possesses one of the shortest extensions, and the eukaryotic DHODs that have been subject to structure determination (Liu et al. 2000 and this work) have had ~30 of their first amino acids removed to have the same length as DHODC. The succeeding residues (the first of DHODC) fold into the N-terminal domain that is the binding site for the second substrate and the inhibitors as discussed earlier. The question remains on the biological function of the first N-terminal amino acids in the eukaryotic DHODs. A probable function of these residues is to contribute to the membrane attachment through a transmembrane α-helix (TM in Fig. 2 ▶), but also to provide a mitochondrial targeting signal (Rawls et al. 2000; Löffler et al. 2002). From the cDNA of rat liver DHOD, a typical sequence of 10 amino acid residues corresponding to a targeting signal and a hydrophobic stretch of 18 amino acids (residues 12–29) corresponding to the transmembrane α-helix could be identified (Knecht et al. 1996).
DHODC does not possess a transmembrane α-helix, but it is still associated with the membrane. In order to investigate if the difference in membrane association between the DHODs from gram-negative bacteria and eukaryotes is related to differences in the hydrophobic character of their surface, we used the program GRID (Goodford 1985) to calculate hydrophobic contour surfaces for the two different types of DHODs. DHODC was used as a prototype for DHODs from gram-negative bacteria, and we constructed a model of the eukaryotic DHODs that includes the residues that connect the first αA-helix and the TM-helix. The residues 30–38 from the DHODH-breq (PDB accession number 1D3G) were used for the structural modeling because all of the residues in helix αA are present in this structure. The hydrophobic contour surfaces calculated for this chimerical DHODR and DHODC are depicted in Figure 5 ▶, A–D. The hydrophobic area covered by the N-terminal α-helices is larger in DHODC than in DHODR. This could be one of the reasons why the eukaryotic DHODs require a transmembrane helix for attachment. In fact, a mutant of DHODR lacking the transmembrane helix was shown to be translocated into the mitochondrial matrix rather than to be inserted into the inner membrane (Rawls et al. 2000). The residues that contribute mostly to the hydrophobic surface in DHODC are the aromatic residues Tyr 2, Phe 5, Phe 21, and Pro 4. Other contributing residues are Glu 20 and the chain of Arg 17, Arg 28, Lys 8 (~Fig. 5C,D ▶). It is also the aromatic residues in DHODR that make the largest contribution to the hydrophobic contour surfaces, namely, Tyr 41 and Phe 37. Contribution to the hydrophobic contour surfaces in DHODR comes also from Val 62, Leu 49, Leu 50, Arg 48, and Arg 70 (Fig. 5A,B ▶). These GRID calculations also provide an estimate of the hydrophobic binding capacity of the small N-terminal domain, which is −12.91 kcal/mole for DHODR and −10.46 kcal/mole for DHODC. This corresponds to a very small difference in the binding constant for DHODR and DHODC. However, the binding capacity is distributed over a larger area in DHODC compared with DHODR, which could give the DHODC a better interaction with the membrane.
Figure 5.

Hydrophobic probes in DHODR and DHODC. The probes for DHODR are shown in Figure 5A and for DHODC in Figure 5C. A more detailed picture of only the small N-terminal domain with side chains is shown for DHODR in Figure 5B and for DHODC in Figure 5D. The small N-terminal domain is colored in blue, and the rest of the protein, in red. Hydrophobic probes are colored in gray. The hydrophobic probes are calculated by GRID (version 21, Molecular Discovery Ltd.; Goodford 1985) and the pictures are produced using Insight II (97.0; Biosym/MSI).
Substrate binding in class 2 DHODs
His 56 and Arg 136 are the only fully conserved residues that interact with the inhibitors of the class 2 DHODs. This could indicate that they also play a role in binding of the electron acceptor. Arg 136 contributes to the binding of atovaquone and brequinar in DHODR by making hydrogen bonds to the inhibitors and adopting different conformations of the side chain. In order to get a picture of the binding of the natural substrate, we used AutoDocking (version 3.0.3) from the Scripps Research Institute and Molecular Graphics Laboratory to dock a quinone into the binding pocket of DHODR. The result of this modeling is depicted in Figure 4C ▶. Accommodation of the quinone into the pocket can take place in a similar way as for brequinar and atovaquone, exploiting the flexibility of Arg 136, meaning that Arg 136 can adopt its conformation to the chemical nature of the compound bound in the pocket, in this case making tight interactions with the C3 bound carbonyl group. As seen for the inhibitors, His 56 stacks with the quinone ring system. The significance of this residue in the substrate recognition is supported by earlier work by Davis and Copeland (1997). They showed that replacing His 56 by alanine cause a 10-fold reduction in catalytic activity relative to the wild-type DHODH and that the mutant H56A was 167-fold less sensitive to inhibition by brequinar. These results support our hypothesis that His 56 and Arg 136 are important for binding the electron acceptor, the second substrate of the class 2 DHODs.
Materials and methods
Protein preparation
Recombinant DHODR was expressed in E. coli and purified as a truncated protein where the first 29 amino acids in the N terminal are removed, as described previously (Ullrich et al. 2001). Atovaquone was obtained from The Wellcome Foundation and brequinar from Dupont Pharma GmbH.
Crystallization
Initial searches for crystallization conditions were performed using Crystal Screen 1 and 2 from Hampton Research (Jancarik and Kim 1991) using the vapor diffusion method. Protein solutions of 15 mg/mL protein, 2 mM orotate, 0.1% β-octylglucoside, and inhibitor in a concentration of 0.1 mM and 1 mM for atovaquone and brequinar, respectively, were used. Hanging or sitting drops of 2-μL protein solution and 2-μL reservoir solutions were equilibrated over 500-μL reservoir or 1-mL reservoir solution at room temperature.
In the presence of atovaquone, small yellow crystals (DHODR-ato) appeared after 3 d in Crystal Screen 1, solution 39 (2% PEG 400 and 2 M ammonium sulphate, 0.1 M HEPES-Na at pH 7.5). Optimization of this condition gave large reproducible crystals (0.2 mm × 0.3 mm) grown with the following composition of the reservoir solution 5% PEG 400, 1.9 M ammonium sulphate, and 0.1 M Tris-HCl buffer (pH 8.6). Crystals of DHODR-breq were found in two conditions, solution 40 from Crystal Screen 1 (20% 2-propanol, 20% PEG 4000, 0.1 M sodium citrate at pH 5.6) and solution 35 from Crystal Screen I (70% MPD, 0.1 M HEPES at pH 7.5). Crystals used for data collection were grown as yellow thin needles over a period of 15 d with a reservoir solution consisting of 65% MPD, 0.1 M Tris-HCl (pH 8.5).
Data collection
Diffraction data for DHODR-ato were collected to 2.3 Å resolution at beamline BW7A, EMBL, Hamburg, Germany, using a CCD detector from MAR Research. Prior to data collection, at 100K the crystals were transferred to cryo protectant (2 M ammonium sulphate, 20% PEG 400, and 0.1 M Tris-HCl at pH 8.5) and flash-cooled for transportation to the beamline. The crystals belong to space group P3 (a = b = 133.1 Å, c = 50.1 Å); with two molecules in the asymmetric unit, the corresponding water content is 59%. A data set to 2.4 Å resolution was collected for DHODR-breq at beamline I711 (MAX lab, Lund, Sweden) on a crystal cooled to 100K. These crystals belong to space group C2221 (a = 49.8 Å, b = 95.8 Å, c = 144.5 Å) and have one molecule in the asymmetric unit with a corresponding water content of 39%. Auto indexing, data reduction, and scaling were performed with programs from the HKL suite (Otwinowski and Minor 1997). Details of data collection and statistics are summarized in Table 2.
Table 2.
Diffraction data statistics and refinement statistics
| DHODR-ato | DHODR-breq | |
| X-ray source | BW7A, EMBL, Hamburg, Germany | 1711, MAX lab, Lund, Sweden |
| Wavelength (Å) | 0.9999 | 1.076 |
| Resolution | 30−2.3 Å (2.38−2.3) | 20−2.44 Å (2.5−2.44) |
| Space group | P3 | C2221 |
| Cell parameters (Å) | a3b3133.1 c350.1 | a349.75, b395.80, c3144.47 |
| Rmerge (%)c | 5.5 (30.6) | 10.8 (44.6) |
| No. of reflections | 169873 | 145268 |
| No. of unique reflections | 44018 | 12989 |
| I/σ(I)>2 (%) | 90 (74.1) | 85.1 (62.1) |
| Completeness (%) | 99.9 (99.7) | 100 (99.9) |
| No. of atoms | 5697 | 2666 |
| No. of reflections in test set | 2183 (5%) | 1302 (9.8%) |
| No. of reflections in working set | 41812 (95%) | 11369 (85.9%) |
| No. of reflections in total | 43995 | 12671 |
| Average B-factor (Å2) | 28.0 | 31.2 |
| R factor (%)a | 21.6 (25.5) | 21.0 (26.8) |
| R free (%)b | 24.2 (28.4) | 26.3 (32.0) |
Values in parentheses are data for the highest resolution shell.
aRfactor = ∑work||Fobs|—k|Fcalc||/∑workFobs.
bRfree = ∑test||Fobs|—k|Fcalc||/∑test Fobs, where Fobs and Fcalc are observed and calculated structure factors, respectively, k is the scale factor, and the sums are the overall reflections in the working set and test set, respectively.
c Rmerge = ∑|I—〈I〉|/∑I, where the sums are the overall reflections of intensity I.
Structure determination and refinement
The structure of DHODR-breq was determined by molecular replacement using EPMR (Kissinger et al. 1999). The crystal structure of DHODH-breq (PDB accession number 1D3G), sharing 88% sequence identity with DHODR, was used as search model. A correlation coefficient of 60.5% and an R-factor of 40.2% were obtained for the correct solution. The nonconserved residues in the model were changed to alanine residues using O (Jones et al. 1991) and this model was used in a rigid body refinement, performed with CNS (Brunger et al. 1998). The difference electron density map showed clear density for orotate, brequinar, and FMN. These three molecules were incorporated in the model that was built using O (Jones et al. 1991) and a simulated annealing refinement was performed with CNS (Brunger et al. 1998). A few rounds of model building with O (Jones et al. 1991) and refinement with CNS (Brunger et al. 1998) revealed two distinct peaks in the electron density, which from their peak height and surroundings were interpreted as a sodium ion and a nickel ion, the latter coming from the purification of DHODR on Ni-column. Both ions are located far from the active and the inhibitor binding sites. These ions were introduced in the model, B-factors were refined, and water molecules were added automatically in CNS (Brunger et al. 1998) at a peak height above 3.0 σ in the Fobs-Fcalc electron density map and above 1.5 σ in the 2Fobs-Fcalc electron density map, with at least one hydrogen bond between water and any atom in the protein, and a B-factor below 50 Å2. The final model has an R-factor of 21.0% (R-free 26.3%) and contains 351 amino acid residues, one orotate molecule, one FMN molecule, one brequinar, one sodium ion, one nickel ion, and 41 water molecules.
The refined model of DHODR-breq was used as a search model in molecular replacement with the DHODR-ato diffraction data using EPMR (Kissinger et al. 1999). The correct solution had a correlation coefficient of 61.5% and an R-factor of 38.5% and confirmed the presence of two molecules in the asymmetric unit. Orotate, FMN, and atovaquone were easily identified in the electron density map and these molecules were added to the model using O (Jones et al. 1991). A major movement of the N-terminal helix was discovered. After cycles of refinement in CNS (Brunger et al. 1998) and model building in O (Jones et al. 1991), these amino acid residues could be placed in agreement with the electron density map. Moreover, as refinement progressed, a β-octylglucoside molecule was identified bound to each molecule parallel to the α1- and α2-helices in (αβ)8 barrel. B-factors were refined and water molecules added as described earlier. The final model has an R-factor of 21.6% (R-free 24.2%). Both molecules in the asymmetric unit contain 358 amino acid residues, one orotate molecule, one FMN molecule, one atovaquone molecule, and one β-octylglucoside molecule, in addition to the 208 water molecules. A summary of refinement statistics for the two structures is shown in Table 2.
The quality of the structural models was evaluated with PROCHECK (Laskowski et al. 1993). DHODR-breq has 93.2%, and both chain A and chain B of DHODR-ato have 90.8% of the residues located in the most favored regions in the Ramachandran plot. The additionally allowed regions contain 6.2% of the residues in DHODR-breq and 8.9% of the residues in DHODR-ato (both chain A and chain B). The generously allowed region contains one residue (Glu 40) from both chain A and B in DHODR-ato and two residues (Ser 120 and Tyr 356) in DHODR-breq. These residues are all well defined according to the electron density. The structures have been deposited at the Protein Data Bank (DHODR-ato: 1 UUM and DHODR-breq: 1UUO).
Molecular modeling procedures
Modeling of DHODR residues 30–38 was performed using the homology modules as implemented in INSIGHT II (97.0; Biosym/MSI). The template for these residues was taken from DHODH-breq (PDB accession number 1D3G). The program GRID (Version 21, Molecular Discovery Ltd.; Goodford 1985) was used to compute the hydrophobic contour surfaces. This was used to predict the residues in the small N-terminal domain that are involved in attachment of DHODC to the membrane and to compare the same domain in DHODR. The hydrophobic binding affinity was obtained from a summation over the pairwise interactions of hydrophobic probe with the protein atoms.
Docking of natural substrate
A truncated quinone was docked into the hydrophobic tunnel of DHODR-breq where brequinar was removed before docking. There were no constraints on the torsion angles during the docking experiment performed with the program AUTODOCK (version 3.0.3) from the Scripps Research Institute and Molecular Graphics Laboratory.
Enzyme assay and inhibition studies
All studies were performed with the histidine-tagged enzyme without cleavage of the tag. The chromogen reduction assay was carried out with 1 mM L-DHO, 0.1 mM QD, 0.06 mM DCIP, 50 mM Tris-HCl, 150 mM KCl at pH 8.0, 0.08% Triton (for solubilization of QD), and 1% DMSO (for solubilization of inhibitors) to test enzyme activities; the assay was started by addition of the enzyme and measured at A600nm (ɛ = 18,800 M−1cm−1).
To determine the inhibitory potency of the drug atovaquone, we measured the initial velocity of the DHODR-catalyzed reaction at saturating concentrations of DHO (1 mM) and QD (0.1 mM) with varying drug concentrations in the range of 20 nM up to 200 μM. The equation vi / vo = 1/[1 + [I]/IC50], where vi is the initial velocity in the presence of the inhibitor at concentration [I] and vo is the initial velocity in the absence of the inhibitor, was fitted to the initial velocities in order to find the drug concentration causing 50% inhibition of the enzyme activity (IC50; Copeland 2000).
Acknowledgments
We thank EMBL outstation Hamburg for beam time at station BW7A and MAX-lab for beam time at I711. The visits to the synchrotrons were supported through the ARI (European community’s Access to Research Infrastructure program) and by the Danish Natural Science Research Council through a grant to DANSYNC.
We thank Flemming Hansen, Centre for Crystallographic Studies, for his help with the data collection for DHODR-ato. The research is supported through funding from Danish National Research Foundation, Department of Clinical Microbiology, University Hospital of Copenhagen, DTC (Danish Toxicology Centre), and Deutsche Forschungsgemeinschaft, Graduiertenkolleg Marburg, “Protein function at the atomic level.”
The publication costs of this article were defrayed in part by payment of page charges. This article must therefore be hereby marked “advertisement” in accordance with 18 USC section 1734 solely to indicate this fact.
Abbreviations
DHOD, dihydroorotate dehydrogenase
DHO, dihydroorotate
DCIP, 2,3-dichlorophenolindophenol
HEPES, 4–(2-hydroxyethyl)-1-piperazineethanesulfonic acid
MPD, 2-methyl 2,4-pentanediol
TRIS, Tris-(hydroxymethyl)aminomethane, 2-amino-2–(hydroxymethyl)-1,3-propanediol
Q0, 2,3-dimethoxy-5-methyl-benzoquinone
DHODR, rat DHOD
DHODR-breq, structure of rat DHOD in complex with brequinar
DHODR-ato, structure of rat DHOD structure in complex with atovaquone
DHODH, human DHOD
DHODH-lefl, structure of human DHOD structure in complex with leflunomide
DHODH-breq, structure of human DHOD in complex with brequinar
DHODC, Escherichia coli DHOD
DHODA, Lactococcus lactis DHOD A
DHODB, Lactococcus lactis DHOD B
rmsd, root-mean-square deviation
Article and publication are at http://www.proteinscience.org/cgi/doi/10.1110/ps.03533004.
References
- Andersen, P.S., Martinussen, J., and Hammer, K. 1996. Sequence analysis and identification of the pyrKDbF operon from Lactococcus lactis including a novel gene, pyrK, involved in pyrimidine biosynthesis. J. Bacteriol. 178 5005–5012. [DOI] [PMC free article] [PubMed] [Google Scholar]
- Bader, B., Knecht, W., Fries, M., and Löffler, M. 1998. Expression, purification, and characterization of histidine-tagged rat and human flavoenzyme dihydroorotate dehydrogenase. Protein Expr. Purif. 13 414–422. [DOI] [PubMed] [Google Scholar]
- Björnberg, O., Rowland, P., Larsen, S., and Jensen, K.F. 1997. Active site of dihydroorotate dehydrogenase A from Lactococcus lactis investigated by chemical modification and mutagenesis. Biochemistry 36 16197–16205. [DOI] [PubMed] [Google Scholar]
- Björnberg, O., Gruner, A.C., Roepstorff, P., and Jensen, K.F. 1999. The activity of Escherichia coli dihydroorotate dehydrogenase is dependent on a conserved loop identified by sequence homology, mutagenesis, and limited proteolysis. Biochemistry 38 2899–2908. [DOI] [PubMed] [Google Scholar]
- Brunger, A., Adams, P., Clore, G., DeLano, W., Gros, P., Grosse-Kunstleve, R., Jiang, J., Kuszewski, J., Nilges, M., Read, R., et al. 1998. Crystallography and NMR system: A new software suite for macromolecular structure determination. Acta Crystallogr. D Biol. Crystallogr. 54 905–921. [DOI] [PubMed] [Google Scholar]
- Copeland, R.A. 2000. Enzymes. Wiley-VCH Inc., New York.
- Copeland, R.A., Marcinkeviciene, J., Haque, T.S., Kopcho, L.M., Jiang, W.J., Wang, K., Ecret, L.D., Sizemore, C., Amsler, K.A., Foster, L., et al. 2000. Helicobacter pylori-selective antibacterials based on inhibition of pyrimidine biosynthesis. J. Biol. Chem. 275 33373–33378. [DOI] [PubMed] [Google Scholar]
- Cutolo, M., Sulli, A., Ghiorzo, P., Pizzorni, C., Craviotto, C., and Villaggio, B. 2003. Anti-inflammatory effects of leflunomide on cultured synovial macrophages from patients with rheumatoid arthritis. Annals Rheum. Dis. 62 297–302. [DOI] [PMC free article] [PubMed] [Google Scholar]
- Davis, J.P. and Copeland, R.A. 1997. Histidine to alanine mutants of human dihydroorotate dehydrogenase—Identification of a brequinar-resistant mutant enzyme. Biochem. Pharmacol. 54 459–465. [DOI] [PubMed] [Google Scholar]
- Davis, J.P., Cain, G.A., Pitts, W.J., Magolda, R.L., and Copeland, R.A. 1996. The immunosuppressive metabolite of leflunomide is a potent inhibitor of human dihydroorotate dehydrogenase. Biochemistry 35 1270–1273. [DOI] [PubMed] [Google Scholar]
- Fairbanks, L.D., Bofill, M., Ruckemann, K., and Simmonds, H.A. 1995. Importance of ribonucleotide availability to proliferating T-lymphocytes from healthy humans—Disproportionate expansion of pyrimidine pools and contrasting effects of de-novo synthesis inhibitors. J. Biol. Chem. 270 29682–29689. [PubMed] [Google Scholar]
- Goldenberg, M.M. 1999. Leflunomide, a novel immunomodulator for the treatment of active rheumatoid arthritis. Clin. Ther. 21 1837–1852. [DOI] [PubMed] [Google Scholar]
- Goodford, P.J. 1985. A computational procedure for determining energetically favorable binding sites on biologically important macromolecules. J. Med. Chem. 28 849–857. [DOI] [PubMed] [Google Scholar]
- Guex, N. and Peitsch, M.C. 1997. SWISS-MODEL and the Swiss-PdbViewer: An environment for comparative protein modeling. Electrophoresis. 18 2714–2723. [DOI] [PubMed] [Google Scholar]
- Ittarat, I., Asawamahasakda, W., and Meshnick, S.R. 1994. The effects of antimalarials on the plasmodium-falciparum dihydroorotate dehydrogenase. Exp. Parasitol. 79 50–56. [DOI] [PubMed] [Google Scholar]
- Jancarik, J. and Kim, S.-H. 1991. Sparse matrix sampling: A screening method for crystallization of proteins. Journal of Applied Crystallography 24 409–411. [Google Scholar]
- Jones, T., Zou, J., Cowan, S., and Kjeldgaard, M. 1991. Improved methods for building protein models in electron density maps and the location of errors in these models. Acta Crystallogr. A 47 110–119. [DOI] [PubMed] [Google Scholar]
- Kaneshiro, E.S., Sul, D., and Hazra, B. 2000. Effects of atovaquone and diospyrin-based drugs on ubiquinone biosynthesis in Pneumocystis carinii organisms. Antimicrob. Agents and Chemother. 44 14–18. [DOI] [PMC free article] [PubMed] [Google Scholar]
- Kissinger, C., Gehlhaar, D., and Fogel, D. 1999. Rapid automated molecular replacement by evolutionary search. Acta Crystallogr. D Biol. Crystallogr. 55 484–491. [DOI] [PubMed] [Google Scholar]
- Kleywegt, G.J. and Jones, T.A. 1999. Software for handling macromolecular envelopes. Acta Crystallogr. D Biol. Crystallogr. 55 941–944. [DOI] [PubMed] [Google Scholar]
- Knecht, W. and Löffler, M. 1998. Species-related inhibition of human and rat dihydroorotate dehydrogenase by immunosuppressive isoxazol and cinchoninic acid derivatives. Biochem. Pharmacol. 56 1259–1264. [DOI] [PubMed] [Google Scholar]
- Knecht, W., Bergjohann, U., Gonski, S., Kirschbaum, B., and Löffler, M. 1996. Functional expression of a fragment of human dihydroorotate dehydrogenase by means of the baculovirus expression vector system, and kinetic investigation of the purified recombinant enzyme. Eur. J. Biochem. 240 292–301. [DOI] [PubMed] [Google Scholar]
- Knecht, W., Henseling, J., and Löffler, M. 2000. Kinetics of inhibition of human and rat dihydroorotate dehydrogenase by atovaquone, lawsone derivatives, brequinar sodium and polyporic acid. Chem. Biol. Interact. 124 61–76. [DOI] [PubMed] [Google Scholar]
- Laskowski, R., MacArthur, M., Moss, D., and Thornton, J. 1993. PROCHECK: A program to check the stereochemical quality of protein structures. Journal of Applied Crystallography 26 283–291. [Google Scholar]
- Liu, S.P., Neidhardt, E.A., Grossman, T.H., Ocain, T., and Clardy, J. 2000. Structures of human dihydroorotate dehydrogenase in complex with anti-proliferative agents. Structure Fold. Des. 8 25–33. [DOI] [PubMed] [Google Scholar]
- Löffler, M., Knecht, W., Rawls, J., Ullrich, A. and Dietz, C. 2002. Drosophila melanogaster dihydroorotate dehydrogenase: The N terminus is important for biological function in vivo but not for catalytic properties in vitro. Insect Biochem. Mol. Biol. 32 1159–1169. [DOI] [PubMed] [Google Scholar]
- Nielsen, F.S., Andersen, P.S., Jensen, K.F. 1996. The B form of dihydroorotate dehydrogenase from Lactococcus lactis consists of two different subunits, encoded by the pyrDb and pyrK genes, and contains FMN, FAD, and [FeS] redox centers. J. Biol. Chem. 271 29359–29365. [DOI] [PubMed] [Google Scholar]
- Nørager, S., Jensen, K.F., Bjornberg, O., and Larsen, S. 2002. E. coli dihydroorotate dehydrogenase reveals structural and functional distinctions between different classes of dihydroorotate dehydrogenases. Structure 10 1211–1223. [DOI] [PubMed] [Google Scholar]
- Otwinowski, Z. and Minor, W. 1997. Processing of X-ray diffraction data collected in oscillation mode. Methods Enzymol. (Macromolecular Crystallography, part A) 276 307–326. [DOI] [PubMed] [Google Scholar]
- Rawls, J., Knecht, W., Diekert, K., Lill, R., and Löffler, M. 2000. Requirements for the mitochondrial import and localization of dihydroorotate dehydrogenase. Eur. J. Biochem. 267 2079–2087. [DOI] [PubMed] [Google Scholar]
- Rowland, P., Nielsen, F.S., Jensen, K.F., and Larsen, S. 1997. The crystal structure of the flavin containing enzyme dihydroorotate dehydrogenase A from Lactococcus lactis. Structure 5 239–252. [DOI] [PubMed] [Google Scholar]
- Rowland, P., Björnberg, O., Nielsen, F.S., Jensen, K.F., and Larsen, S. 1998. The crystal structure of Lactococcus lactis dihydroorotate dehydrogenase A complexed with the enzyme reaction product throws light on its enzymatic function. Protein Sci. 7 1269–1279. [DOI] [PMC free article] [PubMed] [Google Scholar]
- Rowland, P., Nørager, S., Jensen, K.F., and Larsen, S. 2000. Structure of dihydroorotate dehydrogenase B: Electron transfer between two flavin groups bridged by an iron-sulphur cluster. Structure 8 1227–1238. [DOI] [PubMed] [Google Scholar]
- Shawver, L.K., Schwartz, D.P., Mann, E., Chen, H., Tsai, J.M., Chu, L., Taylorson, L., Longhi, M., Meredith, S., Germain, L., et al. 1997. Inhibition of platelet-derived growth factor-mediated signal transduction and tumor growth by N-[4–(trifluoromethyl)-phenyl] 5-methylisoxazole-4-carbox-amide. Clin. Cancer Res. 3 1167–1177. [PubMed] [Google Scholar]
- Sørensen, P.G. and Dandanell, G. 2002. A new type of dihydroorotate dehydrogenase, type 1S, from the thermoacidophilic archaeon Sulfolobus solfataricus. Extremophiles 6 245–251. [DOI] [PubMed] [Google Scholar]
- Ullrich, A., Knecht, W., Fries, M., and Löffler, M. 2001. Recombinant expression of N-terminal truncated mutants of the membrane bound mouse, rat and human flavoenzyme dihydroorotate dehydrogenase—A versatile tool to rate inhibitor effects? Eur. J. Biochem. 268 1861–1868. [PubMed] [Google Scholar]
- Ullrich, A., Knecht, W., Piskur, J., and Löffler, M. 2002. Plant dihydroorotate dehydrogenase differs significantly in substrate specificity and inhibition from the animal enzymes. FEBS Lett. 529 346–350. [DOI] [PubMed] [Google Scholar]