Abstract
We have studied the adsorption of two structurally similar forms of hemoglobin (met-Hb and HbCO) to a hydrophobic self-assembled methyl-terminated thiol monolayer on a gold surface, by using a Quartz Crystal Microbalance (QCM) technique. This technique allows time-resolved simultaneous measurements of changes in frequency (f) (c.f. mass) and energy dissipation (D) (c.f. rigidity/viscoelastic properties) of the QCM during the adsorption process, which makes it possible to investigate the viscoelastic properties of the different protein layers during the adsorption process. Below the isoelectric points of both met-Hb and HbCO, the ΔD vs. Δf graphs displayed two phases with significantly different slopes, which indicates two states of the adsorbed proteins with different visco-elastic properties. The slope of the first phase was smaller than that of the second phase, which indicates that the first phase was associated with binding of a more rigidly attached, presumably denatured protein layer, whereas the second phase was associated with formation of a second layer of more loosely bound proteins. This second layer desorbed, e.g., upon reduction of Fe3+ of adsorbed met-Hb and subsequent binding of carbon monoxide (CO) forming HbCO. Thus, the results suggest that the adsorbed proteins in the second layer were in a native-like state. This information could only be obtained from simultaneous, time-resolved measurements of changes in both D and f, demonstrating that the QCM technique provides unique information about the mechanisms of protein adsorption to solid surfaces.
Proteins have a high tendency to spontaneously and irreversibly adsorb at most aqueous-solid interfaces (1–3). In some situations, e.g., in fouling processes in the food industry (3, 4), this is an unwanted process. In other situations, the increase in protein concentration at interfaces is an advantage, e.g., in biosensor applications (5). Optimizing the conditions in all such applications requires detailed understanding of the protein-adsorption process because in many cases the structure, and thereby the function of proteins, changes upon adsorption (6).
Information about protein-adsorption kinetics can be achieved by using electrical, optical, or labeling techniques, which primarily provide information about the amount of the adsorbed material and only partly about changes in structure (7). In recent years, various electro-acoustical techniques, such as the Quartz Crystal Microbalance (QCM), have been shown to be sensitive tools for the study of the kinetics of protein adsorption (8–13). We recently have described an experimental set-up, based on the QCM technique (14), which can simultaneously measure the kinetics of changes in the resonant frequency, f (c.f. the adsorbed mass), and the dissipation factor, D (c.f. rigidity/viscoelastic properties). This technique has been characterized earlier in detail by using a number of different proteins with different sizes, structures, and rigidities (15, 16), as well as for cell adsorption (17).
In this study, we have used the QCM technique to investigate the effects of pH and ligand-binding on the kinetics of changes in f and D upon binding of hemoglobin (Hb) to a hydrophobic methyl-terminated, thiolated gold surface. The effects of pH, ionic strength, and binding of ligands were investigated. Simultaneous measurement of changes in f and D made it possible to extract information about the viscoelastic properties and hence structural changes of the protein adlayers, which are related directly to the viscoelasticity of individual protein molecules, their interactions with each other, and distribution in the adlayer.
Hb is a globular protein with a molecular mass of 66.5 kDa, composed of two α and two β subunits, which are structurally similar, each binding one heme group. It is an attractive model protein for the type of studies described in this work because it is structurally and functionally well-characterized and undergoes structural changes, e.g., upon changes in pH or binding of ligands to the heme group(s). The adsorption of Hb to model surfaces has been investigated (18–23), and conformational changes in the protein in solution have been studied extensively by using ultrasonic-absorption techniques (24, 25), which provide information about energy losses in a protein solution, closely related to D of the QCM (16).
MATERIALS AND METHODS
The QCM Technique.
The QCM technique is based on a disc-shaped, AT-cut piezoelectric quartz crystal with metal electrodes deposited on its two faces (9, 14). The crystal is excited to oscillation in the thickness shear mode at its fundamental resonant frequency, f, by applying a RF voltage across the electrodes near the resonant frequency. A small mass added to the electrodes (Δm) induces a decrease in resonant frequency (Δf), which is proportional to Δm, provided the mass is evenly distributed, does not slip on the electrode, and is sufficiently rigid and/or thin to have negligible internal friction:
 |
1 |
where C (=17.7 ng cm−2 Hz−1 at f = 5 MHz) is the mass-sensitivity constant and n (= 1, 3,… ) is the overtone number.
Measurements of f and D were done by using an experimental set-up of local design described in detail elsewhere (14). Briefly, the driving voltage to the piezoelectric-crystal oscillator was switched on and off periodically. When it is switched off, the voltage over the crystal decays as an exponentially damped sinusoidal. By recording the decay voltage and numerically fitting this curve to an exponentially damped sinusoidal, the series resonant frequency (measurements in series mode prevent capacitive interference from and conductive leakage via the liquid; ref. 26) and the dissipation factor of the crystal are obtained simultaneously. The sampling rate of the measurements was 1 Hz. Polished 5 MHz crystals from Maxtek (Torrance, CA) were used as sensors. The crystals were cleaned between each adsorption measurement in an UV/ozone chamber (for 15 min), followed by immersion in a 1:1:5 mixture of H2O2 (30%), NH3 (25%), and water for 10 min at 80°C. To obtain a reproducible, chemically well-defined and stable hydrophobic surface, the crystals were immersed for >24 hr in a 1 mM solution of an 18-carbon alkene thiol with a −CH3 end group [HS(CH2)17CH3] (Aldrich Chem, Metuchen, NJ) dissolved in hexane (FISONS Scientific Equipment, England). Thus, the surface on which the protein-adsorption experiments were done was a hydrophobic CH3-terminated, thiol-covered gold surface.
The measurements were done in a cell, designed to provide a rapid, nonperturbing exchange of the liquid over one side of the QCM sensor. The QCM-liquid chamber and liquid samples were temperature-stabilized at 22 ± 0.1°C.
Preparation of Hemoglobin Solutions.
Solutions of bovine met-Hb (Sigma) were prepared in various buffers (depending on pH) at a concentration of ≈0.1 mM, centrifuged (≈200 g) at 4°C for 10 min, and thereafter desalted by repetitive washing by using an Amicon, 30 kDa filter. The protein solutions were stored in liquid nitrogen until use. Before use, the protein solutions were diluted to the desired concentrations in degassed (with N2) 10 mM buffers and adjusted to the desired pH and salt concentration. Solutions of HbCO were prepared by addition of a slight molar excess of dithionite followed by addition of CO. The protein concentration was determined spectrophotometrically by using an absorption coefficient at 405 nm of 179 mM−1 cm−1 per heme at pH 7.0 (met-Hb) (27) and adjusted to 1.3 μM. The isoelectric points (pI) were 6.7 ± 0.1 and 7.2 ± 0.1 for HbCO and met-Hb, respectively. All chemicals were of the purest grade available.
RESULTS
Adsorption of HbCO and met-Hb.
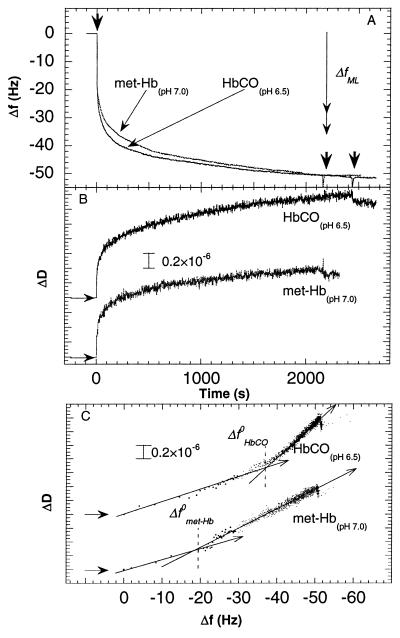
Fig. 1 A and B show changes in f and D, respectively, as a function of time during adsorption of HbCO at pH 6.5 and met-Hb at pH 7.0 on the hydrophobic, thiolated gold surface. These pHs are close to the isoelectric points of the two forms of Hb (see above).
Figure 1.
Changes in frequency (A) and dissipation (B) as a function of time during adsorption of met-Hb and HbCO at pH 7.0 and 6.5, respectively, to gold covered by a hydrophobic methyl-terminated-thiol monolayer (10 mM Hepes). The proteins were introduced at t = 0. The two right arrows in A indicate the times at which the two protein solutions were exchanged for pure buffer solutions. The vertical double arrow in A shows the predicted frequency change for a monolayer of Hb. Two limiting values are given (29 Hz < ΔfML < 35 Hz) depending on the orientation of the Hb molecules on the surface (see text). (C) D-f plots using the data from A and B. Note that the density of data points (equispaced in time) becomes smaller the faster the kinetics, in this type of plot. This explains the small number of data points near the origin, where the kinetics is fast. The horizontal arrows in B and C denote the starting points of the experiments, i.e., ΔD = Δf = t = 0. The arrows drawn through the D-f graphs in C indicate the direction of time. Δf 0 denotes the break-point of the D-f graph into two regimes.
From Fig. 1A, it is seen that the adsorption kinetics of the two forms of Hb on the hydrophobic surface were very similar at their isoelectric points. Upon addition of the protein solution (at t = 0), a rapid frequency decrease (mass increase) was followed by a slower decrease. Fig. 1B shows that D increases with time, i.e., more energy is dissipated as more proteins are adsorbed, and ΔD(t) displays kinetics similar (but not identical) to Δf(t).
The exposure of the quartz crystal the protein solution was eventually interrupted by exchanging the protein solution to a pure buffer solution (Fig. 1A, right arrows), which resulted in a small instantaneous change in D (≈0.1⋅10−6) without any changes in the frequency, consistent with irreversible adsorption.
We define the f- and D-shift at saturation, Δfsat and ΔDsat, respectively, from the values obtained at 2⋅103 s in this experiment§. For met-Hb and HbCO, |Δfsat| ≅50Hz and ΔDsat were ≈1.2⋅10−6 and ≈1.4⋅10−6, respectively.
To relate the observed changes in D to changes in f, we show ΔD vs. Δf (hereafter termed D-f plots), which eliminates time as an explicit parameter. Fig. 1C shows D-f plots of the data in Fig. 1 A and B. The D-f plot reveals differences between the adsorption behavior of HbCO and met-Hb, not directly seen in Fig. 1 A and B. The different slopes in the D-f plots indicate at least two different kinetic processes during adsorption. In addition, the D-f plots show that slightly different forms of the same protein display significantly different dissipation shifts for the same frequency shift. The rapid and slow phases of the adsorption processes (c.f. Fig. 1 A and B) display different slopes in the D-f plot, i.e., different values of ∂D/∂f, with break points at | ΔfHbCO0 | ≅ 38 Hz and | Δfmet-Hb0 | ≅ 20 Hz, for HbCO and met-Hb, respectively. The initial ∂D/∂f values are approximately the same for HbCO and met-Hb, whereas after the break points the slope is ≈1.3 times larger for HbCO than for met-Hb.
Eq. 1 was used to estimate the expected change in frequency for a closely packed monolayer of Hb adsorbed to the surface.¶ The number of molecules and mass per surface area was estimated by using the dimensions of ≈4.5 × 5.0 × 5.5 nm3 (27) for the protein molecules and a molecular mass of 66.5 kDa plus an additional 30% due to protein-bound water (27). Two limiting values were estimated, depending on the orientation of the molecules, 29 Hz < |ΔfML| < 35 Hz. As seen in Fig. 1, the frequency change after the first adsorption process (before the break point in the D-f plot) was consistent with formation of a monolayer whereas after the second process (at ≈2000 s) the total frequency change |Δfsat| was ≈50 Hz, which indicates formation of a bilayer.
Adsorption of HbCO and met-Hb as a Function of pH.
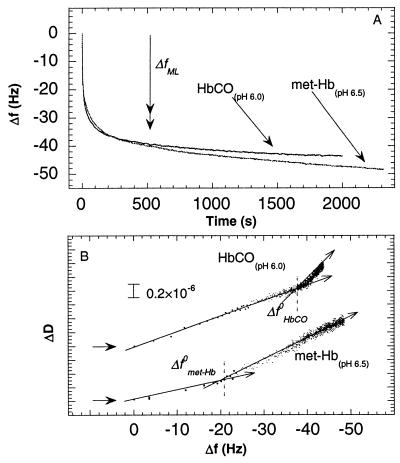
Fig. 2 shows changes in f as a function of time (Fig. 2A) and a D-f plot (Fig. 2B) for the adsorption of HbCO at pH 6.0 and met-Hb at pH 6.5 (i.e., ≈0.7 pH units below the pIs of the two states). The kinetics is similar to that observed at pH 6.5 and pH 7.0, respectively (c.f. Fig. 1). The only significant differences are that for HbCO, the relative Δf in the second adsorption phase after the break point in the D-f plot is smaller at pH 6.0 than at pH 6.5 (c.f. Fig. 1), and the slope of the second phase in the D-f plot is larger at pH 6.0 than at pH 6.5.
Figure 2.
(A) Changes in frequency as a function of time during adsorption of met-Hb and HbCO at pH 6.5 and 6.0, respectively, on gold covered by a hydrophobic methyl-terminated-thiol monolayer. (B) ΔD as a function of Δf for the two graphs in A. See also Fig. 1 legend.
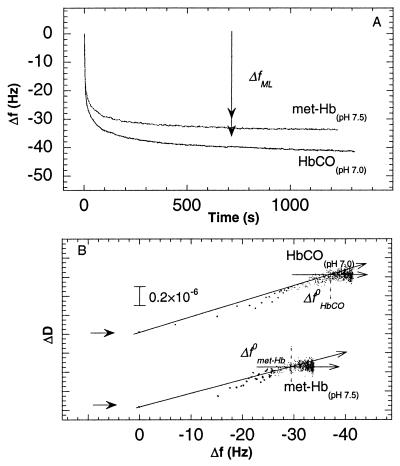
Fig. 3 shows the same type of data as in Fig. 2 but at pH 7.0 and 7.5 for HbCO and met-Hb, respectively, (i.e., ≈0.3 units above the pIs of the two states). Significant differences in the kinetics are observed, compared to the data shown in Figs. 1 and 2. Both the magnitude of the slow adsorption phase and |Δfsat| are smaller than at lower pH, and in the case of met-Hb about equal to |ΔfML|. In addition, the break points in the D-f plots were, for both met-Hb and HbCO, very close to the saturation values (within 5 Hz), with values of ∂D/∂f close to zero after the break points.
Figure 3.
(A) Changes in frequency as a function of time during adsorption of met-Hb and HbCO at pH 7.5 and 7.0, respectively on gold covered by a hydrophobic methyl-terminated-thiol monolayer. (B) ΔD as a function of Δf for the two graphs in A. See also legend of Fig. 1.
The adsorption of HbCO also was studied at high ionic strength (200 mM KCl) at pH 6.5, 7.0 and 7.5. The change in frequency upon addition of the protein solution was considerably smaller at high than at low ionic strength; at the higher ionic strength, the asymptotic uptake was consistent with formation of a single monolayer (see Fig. 4). No significant differences were observed at the different pH values studied, i.e., the pH dependence (in the range 6.5–7.5) disappears at high ionic strength. Moreover, at high ionic strength there was no significant break point in the D-f plot (not shown), and the values of ∂D/∂f were similar at pH 6.5–7.5 and slightly larger than the initial slope at low ionic strength (Figs. 1–3).
Figure 4.
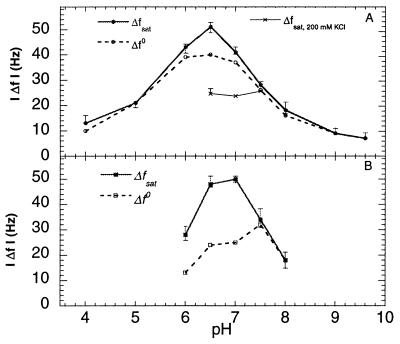
(A) (•), |Δfsat|; (○), |Δf0|; and (×), |Δfsat| at high ionic strength (200 mM KCl) as a function of pH for HbCO. (B) (■), |Δfsat| and (□), |Δf0| as a function of pH for met-Hb. The error bars represent the SD of approximately three measurements made at each pH value. The buffers Succinic Acid, Hepes, or Tris were used depending on pH, at a concentration of 10 mM.
The pH dependence of the adsorption kinetics was further investigated in the range between 4.0 and 9.6, and between 6.0 and 8.0 for HbCO and met-Hb, respectively. A smaller range was used for met-Hb because this form denatures more easily at the extreme pH values (27). Fig. 4 shows |Δf0 | (the frequency shift at the break point in the D-f plot) and |Δfsat| as a function of pH for HbCO (Fig. 4A) and met-Hb (Fig. 4B). As seen, the maximum values of |Δfsat| for both HbCO and met-Hb are close to their respective pIs.
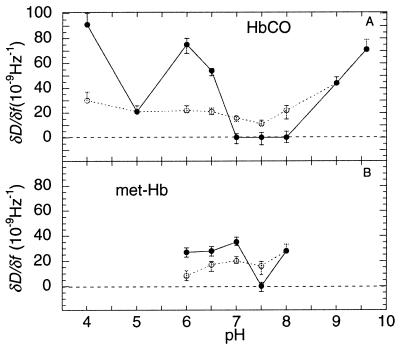
Fig. 5 shows the ∂D/∂f values of the two phases in the D-f plots as a function of pH for HbCO and met-Hb, respectively. At pH ≤ 6.5 for HbCO and pH ≤ 7.0 for met-Hb, ∂D/∂f(t→0) are significantly smaller than ∂D/∂f(t→∞), whereas at higher pHs ∂D/∂f(t→∞) are essentially zero, and thus much smaller than ∂D/∂f(t→0), except at pH ≥ 9.0 where ∂D/∂f(t→0) = ∂D/∂f(t→∞), i.e., no break point in the slope is observed.
Figure 5.
(○), ∂D/∂f at t→0 and (•), t→∞ as a function of pH for HbCO (A) and met-Hb (B). The error bars represent the SD of approximately three measurements made at each pH value. For conditions see Fig. 4.
CO Binding to Preadsorbed met-Hb.
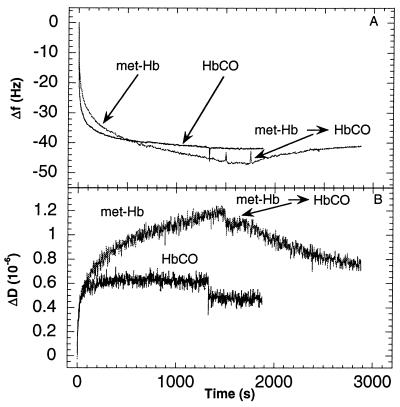
Reduction of met-Hb and binding of CO is likely to affect its structure, which in turn may result in changes in D and f. Fig. 6 shows the observed changes in f and D on addition of a slight molar excess of dithionite and exchange of N2 for CO. In solution, binding of CO to deoxy-Hb takes place in the millisecond time range. Upon addition of CO (at 1,500 s, see Fig. 6 A and B), the frequency increased (indicating desorption) and a dramatic decrease in D was observed. The final values of Δf and ΔD were about the same as those obtained when HbCO was directly adsorbed at pH 7.0 (see Fig. 6). No significant changes in f or D were observed upon addition of dithionite, without exchange of N2 for CO (not shown).
Figure 6.
Δf (A) and ΔD (B) as a function of time for the adsorption of met-Hb at pH 7.0 (c.f. Fig. 1) followed by conversion to HbCO by addition of a slight molar excess of dithionite in a CO-saturated solution (≈1 mM CO). Also shown is the direct adsorption of HbCO at pH 7.0. See also Fig. 1 legend.
DISCUSSION
In this work, we have used the QCM technique to investigate changes in frequency and energy dissipation during adsorption of hemoglobin to a gold surface covered with a hydrophobic self-assembled monolayer of thiols.
At low salt concentration, at pI, a two-phase adsorption kinetics was observed which, together with the net mass uptake, indicates bilayer formation (see Fig. 1). The associated D-shifts were larger in the second phase than in the first one, reflected in different ∂D/∂f values (Figs. 1C and 5), and attributed to a more rigidly coupled first layer (dissociation of the Hb subunits and partial denaturation) and a more loosely bound native second layer. In the following discussion, we refer to the two phases as the first and second phase, respectively (defined by the breakpoint, Δf0, in the D-f plots). Thus, the results indicate that the adsorption to the surface is a semi-collective process, which is manifested in a biphasic kinetics, involving initial adsorption and subsequent rearrangements and/or conformational changes within the adsorbed layer and further adsorption on the bare surface or on top of the first layer (bilayer formation). This interpretation is supported by the finding that the rate of the first phase increases with protein concentration whereas that of the second phase is independent of protein concentration (F.H., unpublished results). In addition, we observed previously that in carboxymyoglobin bound to a gold surface, flash-induced absorbance changes associated with dissociation/recombination of the CO ligand displayed biphasic CO-recombination kinetics (28), which is indicative of two populations of adsorbed myoglobin with different structures.
We model the observed kinetics by using a three-state kinetic model:
 |
2 |
where states A, B, and C are the empty surface, the surface covered with a protein monolayer, and a bilayer, respectively. A fit of the model with the experimental data in Fig. 1 (HbCO) gave rate constants k1 = 5.9⋅10−2 s−1 and k2 = 1⋅10−3 s−1. Approximately 72% of the total frequency change and approximately 44% of the dissipation change were associated with the first phase, which is consistent with the break point in the D-f plot.
Around the pI, at high salt concentration the adsorbed amount HbCO at saturation, Δfsat, is close to ΔfML, i.e., approximately one-half of that found at low ionic strength (see Fig. 4). At 200 mM KCl, the stability against denaturation of Hb is higher than at low ionic strength (27). Therefore, it is reasonable to assume that the degree of surface-induced denaturation is smaller at high compared to low ionic strength. In addition, electrostatic interactions between protein molecules are weaker at high than at low ionic strength (29). Together this increased stability/reduced electrostatic interaction explains why only a monolayer of Hb adsorbs at the higher ionic strength.
The maximum in the adsorbed amount at low ionic strength occurs close to the pIs of HbCO and met-Hb, respectively (see Fig. 4). This observation is in agreement with the results of Kondo et al. (19, 20) (as well as with what is generally observed for protein adsorption; ref. 30). They studied the adsorption of several globular proteins, among them met-Hb, as a function of pH at low ionic strength (<0.01 M NaCl) on charged, colloidal silica particles. For the adsorption of met-Hb, they observed a peak in the adsorbed amount at saturation between pH 6.0 and 8.0, with a maximum coverage of ≈700 ng/cm2, which corresponds to an f-shift of ≈−42 Hz (c.f. Eq. 1), which is slightly less than Δfsat of ≈50 Hz in our measurements.
At pH>pI and pH<pI, formation of the bilayer is likely to be counteracted by electrostatic repulsion as a result of an increased amount of surface charge on the protein. Such a repulsion would result in a smaller density of protein molecules in the first layer, even if they did not change their conformation. This effect is most likely combined with an increased spreading of the protein due to denaturation at the extreme pH values. The subunits of Hb are to a large extent held together by hydrophobic interactions (27) and are known to dissociate at extreme pH values (below 4 and above 10), upon addition of detergents or at low concentrations (29, 31, 32). Thus, it is likely that the interaction between the hydrophobic surface and the protein molecules results in dissociation and denaturation at pH values far from pI, as observed also by Kondo et al. (20).
Because the present study was performed using an electrically inert, hydrophobic surface separating the underlying gold surface by ≈1.5 nm, the pH-induced change of the overall charge of the protein molecule should have a minor effect on the protein–surface interactions as compared with a case with a highly polarizable or charged surface. Moreover, the gain in free energy upon dehydration of a ≈25% surface fraction of Hb and of the hydrophobic contact surface is in the order of 102 kJ/mol (33), i.e., large enough to induce irreversible adsorption. Hence, the protein–surface interaction is most likely of hydrophobic nature, and it is reasonable to believe that the decrease of Δfsat at pH values below and above the pIs (the bell-shape) is due to a combination of the following contributions: (i) an increase of the electrostatic repulsion between adsorbed proteins, which makes close packing thermodynamically unfavorable (1, 30), (ii) accumulation of net charge in the interfacial region, which is thermodynamically unfavorable (1, 30), and/or (iii) an increase of the surface fraction occupied by each protein as a consequence of enhanced surface-induced conformational changes due to the lower structural stability of the protein molecules (20) away from pI. These effects are most likely cooperative in generating the observed behavior, but their relative contributions cannot presently be quantified. A high ionic strength screens the protein’s surface charges and reduces all three of these contributions, which is in agreement with the observation that the adsorption behavior was independent of pH in the range 6.5–7.5 at high ionic strength.
The similarities between the adsorption behavior of HbCO and met-Hb close to their pIs (see Figs. 1–4) show that the pH affects the adsorption behavior of these two states of Hb in a similar way. Nevertheless, there are marked differences, which are revealed from the D-f plots. For example, |Δf0met-Hb| is smaller than |Δf0HbCO|, even though the |Δfsat| values are about the same. These differences are most likely due to the lower stability against denaturation for met-Hb than for HbCO (34). Hence, the most likely explanation for the smaller |Δf0| for met-Hb than for HbCO close to the pIs, is a more pronounced surface-induced denaturation in the former case and, as a consequence an increased spreading on the surface.
The results shown in Fig. 6 support the picture that Hb adsorbed in the second layer is at least partly functional. Reduction of adsorbed met-Hb and consecutive binding of CO resulted in a fractional desorption of proteins. This is consistent with a fraction of the surface-bound Hb being able to undergo conformational changes upon binding of CO, which in turn weakens the binding, resulting in molecule desorption. A similar observation was made in studies of HbCO adsorption during successive pH changes. For example, after preadsorption at pH 6.5 and subsequent lowering of the pH to 5.0, a desorption similar to that observed upon CO-binding was observed (35).
A brief discussion is called for about our implicit assumption of a linear relation between the mass and frequency change. This is not generally warranted for viscoelastic adlayers because slip, internal dissipative effects and entrapped water in the adlayer can in principle interfere with the mass determination (11, 13, 15, 16). For thin (<10 nm) protein adlayers, we believe that only trapped water significantly affects the mass determination (see refs. 15 and 16 for details). Mechanistically, this means that the measured frequency shifts correspond to the protein plus water associated with the protein layer. This is important to keep in mind when absolute Δf values are considered, but does not, in our opinion, change the conclusions.
We now turn to the observed changes in the dissipation and their origin. As argued earlier (9, 15, 16, 36–39) the dominant contributions to the positive D-shifts observed for adsorbed proteins are likely to originate from internal energy dissipation in the protein layer due to its periodic shear stress, including the protein-hydration shell and/or capillary-like water between the adsorbed proteins. In addition, we recently have presented a model which shows that the changes in D are mainly due to losses within the protein adlayer (15, 16). This model is also consistent with that presented by Martin et al. (36). Thus, the observed changes in D are most likely due to reversible conformational changes in the protein layers and the trapped liquid (15, 16).‖ This conclusion is further supported by the fact that ultrasonic absorption studies in the kHz-MHz regime of aqueous solutions of proteins have shown that proteins can absorb ultrasonic compressional waves via primarily reversible structural and conformational alterations in the proteins (including their hydration shell) (24, 25). Even if compressional waves do not interact in exactly the same way with proteins in solution as adsorbed proteins (see ref. 16 for details), it is likely that the physical and mechanistic origin(s) of the observed D-shifts are the same for compressional waves in protein solutions.
One general feature in the studies at pH ≤6.5 for HbCO and pH ≤7.0 for met-Hb is that ∂D/∂f(t→0) are significantly smaller than ∂D/∂f(t→∞) (see, e.g., Fig. 5). The relatively small value of the slope of the first phase (attributed to a conformationally modified rigidly attached, dense adlayer) is consistent with (i) low internal dissipation due to the strong attachment to and spreading on the surface and (ii) low dissipation due to intralayer liquid since the modified proteins fill most of the space. The larger value of the slope of the second phase (attributed to a loosely bound adlayer composed of native-like proteins) is consistent with (i) high dissipation from motions coupled to the interlayer and surrounding water, since this layer is thicker and allows a larger amount of trapped liquid and (ii) a high dissipation in the more flexible and more weakly bound protein molecules. The quantitatively different behavior at saturation at high pH (almost zero ∂D/∂f) points toward another mechanism than bilayer formation. At present, we have no interpretation of this behavior.
A second general feature in the present studies is the large magnitude of ∂D/∂f at low coverage at low and high pH (see Fig. 5). Consider for example the situation at pH 9.0 and 9.6 for HbCO, where the coverage is only 10% smaller at pH 9.6 than at 9.0, whereas the value of ∂D/∂f is 70% larger. This pH change induces obviously a large change in the protein–surface or protein–protein interaction. Because the difference in coverage is so small, the effect due to liquid confined between the adsorbed protein molecules is most likely also small in this case. Moreover, the high protein charge at these pH values should prevent the proteins to cluster on the surface. It is therefore reasonable to attribute the increase in D to losses in the individual proteins including their hydration shell. One possible explanation for the large change in ∂D/∂f upon increase of the pH from 9.0 to 9.6 is that the pH change enhances surface-induced dissociation and denaturation (c.f. above) of the proteins in a way that changes the viscoelastic properties of the layer. This interpretation is consistent with studies of Hb denaturation in solution (29), which show a fivefold increase in intrinsic viscosity of Hb upon denaturation.
Concluding Remarks.
The process of Hb adsorption on a surface can be followed in detail by using the QCM, which allows simultaneous frequency- and energy dissipation-shift measurements. Variation of the pH causes significant changes in the adsorbed amounts, the kinetics, and in the magnitude of the dissipation shift per added protein at different coverage. The general trends observed are: (i) Simple monolayer formation of presumably intact proteins at high ionic strength near pI, and bilayer formation around pI at lower ionic strength. (ii) Much lower saturation coverage at low and high pH compared with pH ≅ pI, which is attributed to electrostatic repulsion due to surface charges on the proteins, and increased spreading (conformational changes) due to reduced protein stability. (iii) Some functionality of the proteins in the second layer of a bilayer indicated by the ability to be modified by reduction and CO binding. (iv) The energy dissipation is generally larger in the second layer of intact Hb compared to the first layer of conformationally modified molecules, which is attributed to a combination of inherent differences between the two layers with respect to viscoelasticity and the amount and distribution of trapped water.
Acknowledgments
We would like to thank Tore Vänngård for valuable discussions, and Margareta Ek and Craig Keller for experimental help. This work was supported by the Biomaterials Consortium (Swedish National Board for Industrial and Technical Development and Swedish Natural Science Research Council 93–02434P) and Swedish Natural Science Research Council Grant E-AD/EG08897–310.
ABBREVIATIONS
- QCM
Quartz Crystal Microbalance
- f
frequency
- D
energy dissipation
- pI
isoelectric point
Footnotes
Because met-Hb may denature at room temperature after ≈1 hr (23), all experiments were interrupted after ≈2,000 s. Since ∂f/∂t was non-zero at this time, the adsorption process was still in progress. For the present comparative purposes this definition of asymptotic values is, however, sufficient.
The change in f is related to the effective mass (16). However, when relative variations in the f-shifts are discussed, the absolute value is of minor importance.
It should be noted that the amplitude of oscillation is typically ≈1 nm. This means that the crystal surface moves with a velocity < 1 cm/s and that the maximum kinetic energy transferred to the proteins due to the oscillation is much smaller than kBT. The oscillatory motion of the crystal is therefore not expected to significantly influence the structure or adsorption behavior of the protein molecules.
References
- 1. Norde W, Haynes C A. In: Interfacial Phenomena and Bioproducts. Brash J L, Wojciechowski P W, editors. New York: Dekker; 1996. pp. 123–144. [Google Scholar]
- 2.Norde W. Cells and Materials. 1995;5:97–112. [Google Scholar]
- 3.Andrade J D, Hlady V. Advances in Polymer Science. 1986;79:1–63. [Google Scholar]
- 4.Kessler G H, Lund D B. Prien Chiemsee. Munich, Germany: Munich University; 1989. [Google Scholar]
- 5.Marco M P, Barcelo D. Meas Sci Technol. 1996;7:1547–1562. [Google Scholar]
- 6.Brash J L, Horbett T A. In: Proteins at Interfaces II, ACS Symposium Series 602. Brash J L, Horbett T A, editors. Washington, DC: Am. Chem. Soc.; 1995. pp. 1–23. [Google Scholar]
- 7.Ramsden J J. Q Rev Biophys. 1993;27:41–105. doi: 10.1017/s0033583500002900. [DOI] [PubMed] [Google Scholar]
- 8.Yang M, Chung F, Thompson M. Analytical Chemistry. 1993;65:3713–3716. [Google Scholar]
- 9.Ward M D, Buttry D A. Science. 1990;249:1000–1007. doi: 10.1126/science.249.4972.1000. [DOI] [PubMed] [Google Scholar]
- 10.Thompson M, Dhaliwal G K, Arthur C L. Anal Chem. 1986;58:1206–1209. doi: 10.1021/ac00297a051. [DOI] [PubMed] [Google Scholar]
- 11.Caruso F, Furlong D N, Kingshott P. J Colloid Intreface Sci. 1997;186:129–140. doi: 10.1006/jcis.1996.4625. [DOI] [PubMed] [Google Scholar]
- 12.Kösslinger C, Uttenthaler V, Drost S, Aberl F, Wolf H, Brink G, Stanglmair A, Sackmann E. Sens Actuators, B. 1995;24–25:107–112. [Google Scholar]
- 13.Muratsugu M, Ohta F, Miya Y, Hosokawa T, Kurosawa S, Kamo N, Ikeda H. Anal Chem. 1993;65:2933–2937. doi: 10.1021/ac00068a036. [DOI] [PubMed] [Google Scholar]
- 14.Rodahl M, Höök F, Brzezinski P, Kasemo B. Rev Sci Instrum. 1995;66:3924–3930. [Google Scholar]
- 15.Rodahl M, Höök F, Fredriksson C, Keller C, Krozer A, Brzezinski P, Voinova M, Kasemo B. Faraday Discuss. 1997;107:229–246. doi: 10.1039/a703137h. [DOI] [PubMed] [Google Scholar]
- 16.Höök F, Rodahl M, Brzezinski P, Kasemo B. Langmuir. 1998;14:729–734. [Google Scholar]
- 17.Fredriksson C, Kihlman S, Rodahl M, Kasemo B. Langmuir. 1997;14:248–251. [Google Scholar]
- 18.Horbett T A. Thromb Haemostasis. 1984;51:174–182. [PubMed] [Google Scholar]
- 19.Kondo A, Oku S, Higashitani K. J Colloid Intreface Sci. 1991;143:214–221. [Google Scholar]
- 20.Kondo A, Murakami F, Higashitani K. Biotechnol Bioenerg. 1992;40:889–894. doi: 10.1002/bit.260400804. [DOI] [PubMed] [Google Scholar]
- 21.Ratner B D, Horbett T A. Journal of Colloid and Interface Science. 1981;83:630–642. [Google Scholar]
- 22.Hanrahan K-L, MacDonald S M, Roscoe S G. Electrochim Acta. 1996;41:2469–2479. [Google Scholar]
- 23.Elbaum D, Harrington J, Roth E F, Nagel R L. Biochim Biophys Acta. 1976;428:57–69. doi: 10.1016/0005-2795(76)90285-3. [DOI] [PubMed] [Google Scholar]
- 24.O’Brien WD J, Dunn F. J Acoust Soc Am. 1971;50:1213–1215. doi: 10.1121/1.1912758. [DOI] [PubMed] [Google Scholar]
- 25.Edmonds P D. Bioelectromagnetics. 1982;3:157–165. doi: 10.1002/bem.2250030119. [DOI] [PubMed] [Google Scholar]
- 26.Rodahl M, Höök F, Kasemo B. Anal Chem. 1996;68:2219–2227. doi: 10.1021/ac951203m. [DOI] [PubMed] [Google Scholar]
- 27.Antonini E, Brunori M. In: Myoglobin and Hemoglobin in their Reactions with Ligands. Neuberger A, Tatum E L, editors. Vol. 21. Amsterdam: North–Holland; 1971. [Google Scholar]
- 28.Höök F, Rodahl M, Brzezinski P. Biophys J. 1994;66:A378. doi: 10.1016/S0006-3495(94)81001-X. (abstr.). [DOI] [PMC free article] [PubMed] [Google Scholar]
- 29.Tanford C. Adv Protein Chem. 1968;23:121–282. doi: 10.1016/s0065-3233(08)60401-5. [DOI] [PubMed] [Google Scholar]
- 30.Norde W. Macromol Symp. 1996;3:5–81. [Google Scholar]
- 31.Pin S, Royer C A. Methods Enzymol. 1994;232:42–55. doi: 10.1016/0076-6879(94)32042-x. [DOI] [PubMed] [Google Scholar]
- 32.Valdes R J, Ackers G K. J Biol Chem. 1977;252:74–81. [PubMed] [Google Scholar]
- 33.Israelachvili J N. Intermolecular and Surface Forces. San Diego: Academic; 1992. [Google Scholar]
- 34.Olsen K W. Methods Enzymol. 1994;231:514–524. doi: 10.1016/0076-6879(94)31035-1. [DOI] [PubMed] [Google Scholar]
- 35.Höök F. Ph.D. thesis. Göteborg, Sweden: Chalmers University of Technology and Göteborg University; 1997. [Google Scholar]
- 36.Bandey H L, Hillman A R, Brown M J, Martin S J. Faraday Discuss. 1997;107:105–122. [Google Scholar]
- 37.Krim J, Solina D H, Chiarello R. Phys Rev Lett. 1991;66:181–184. doi: 10.1103/PhysRevLett.66.181. [DOI] [PubMed] [Google Scholar]
- 38.Urbakh M, Daikhin L. Langmuir. 1994;10:2836–2841. [Google Scholar]
- 39.Rodahl M, Kasemo B. Sens Actuators, A. 1996;54:448–456. [Google Scholar]


