Abstract
We report a serendipitous discovery that extends the impressive catalog of reporter functions performed by green fluorescent protein (GFP) or its derivatives. When two GFP molecules are brought into proximity, changes in the relative intensities of green fluorescence emitted upon excitation at 395 vs. 475 nm result. These spectral changes provide a sensitive ratiometric index of the extent of self-association that can be exploited to quantitatively image homo-oligomerization or clustering processes of GFP-tagged proteins in vivo. The method, which we term proximity imaging (PRIM), complements fluorescence resonance energy transfer between a blue fluorescent protein donor and a GFP acceptor, a powerful method for imaging proximity relationships between different proteins. However, unlike fluorescence resonance energy transfer (which is a spectral interaction), PRIM depends on direct contact between two GFP modules, which can lead to structural perturbations and concomitant spectral changes within a module. Moreover, the precise spatial arrangement of the GFP molecules within a given dimer determines the magnitude and direction of the spectral change. We have used PRIM to detect FK1012-induced dimerization of GFP fused to FK506-binding protein and clustering of glycosylphosphatidylinositol-anchored GFP at cell surfaces.
Keywords: fluorescence excitation ratio imaging/optical microscopy/homotypic protein interactions/glycosylphosphatidylinositol-anchored proteins/FK506-binding protein
The realization that fluorescence is spontaneously generated when a cDNA encoding Aequorea victoria green fluorescent protein (GFP) is expressed in a wide variety of cell types and organisms has created a broad array of new opportunities for biological research (1, 2). Patterns of gene expression can now be directly visualized, the fates of proteins within living cells and of cells within intact organisms followed (1), heterologous protein interactions monitored (3, 4), constraints on translational or rotational motion assessed (5), and fluctuations in the concentrations of physiologically relevant ions such as Ca2+ (6, 7) or H+ (8–10) analyzed.
We now describe another reporter function of GFP. We find that, in addition to yielding positional information, tagging a protein with GFP can provide clues about the protein’s oligomeric state. If two GFP molecules are brought into physical contact, changes in the ratio of fluorescence emitted when excited with 395- and 475-nm light occur. Proximity imaging, or PRIM, exploits these changes to reveal homotypic protein–protein interactions in vivo.
MATERIALS AND METHODS
Expression and Purification of GFP Constructs.
pGFP-1 (CLONTECH), a promoterless plasmid encoding GFP, was engineered by PCR to carry the point mutations V163A and S175G, which facilitate folding at 37°C (11). This thermotolerant version of GFP was used in all subsequent work. Recombinant proteins were produced as glutathione S-transferase (GST) fusion proteins (vector pGEX-2T, Pharmacia) in Escherichia coli strain BL21. FK506-binding protein (FKBP12; referred to here as FKBP) was appended to the C terminus of GFP via the linker sequence GGSGGSLVLE (single-letter amino acid code). Concatenated GFPs were produced by PCR-mediated insertion of the linker sequence SGGSGTRDLYTAGDDDDKDPPG between two GFP modules or between enhanced blue fluorescent protein (EBFP) and enhanced GFP (EGFP) (CLONTECH). Y66S–FKBP was created by PCR mutagenesis and expressed as a GST fusion or hexahistidine (His6)-tagged protein, by using the vector pQE30 (Qiagen, Chatsworth, CA) in the latter case.
Bacterial lysates were precleared at 100,000 × g for 60 min, and supernatants were incubated with glutathione-agarose (Sigma) or nickel-nitrilotriacetate-agarose (Qiagen). GST fusion proteins were either eluted with 2 mM reduced glutathione (Sigma) to release intact GST fusion proteins or cleaved with 20 milliunits/ml thrombin (Sigma) for 30 min to release GST-less versions. His6-tagged Y66S-FKBP was eluted with 250 mM imidazole.
Fluorescence Spectroscopy.
Fluorescence excitation spectra were recorded at 25°C in a Perkin–Elmer LS-50B spectrofluorimeter with the emission wavelength set to 510 nm. Bandwidths for excitation and emission were set between 5 and 12 nm.
Analysis of Monomers and Dimers in Vitro.
Proteins were applied to a G3000SWxl gel filtration column (TosoHaas, Montgomeryville, PA) prefitted with a column guard and driven by a 510 HPLC pump (Waters) at a flow rate of 1 ml/min. Except where indicated, the column buffer was 50 mM sodium phosphate buffer containing 150 mM NaCl and 150 mM KCl, pH 7.0 (buffer P). Fractions of 0.5 ml were collected and analyzed. The ethylene glycobis(sulfosuccinimidylsuccinate) crosslinker (sulfo-EGS) was from Pierce.
Expression of GFP Constructs in HeLa Cells.
For expression in HeLa cells, all GFP constructs [GFP–FKBP, GFP–glycosylphosphatidylinositol (GPI), palmitoylated GFP] were cloned into pCI (Promega). GFP–FKBP was described above. GPI-anchored GFP was produced by inserting the cDNA coding for GFP downstream of the preprolactin signal sequence, by using the linker sequence TGG, and upstream of the C-terminal 37 amino acids of decay accelerating factor (coding for GPI anchor addition; ref. 12), by using the linker sequence TGGSGGSGG. Palmitoylated GFP was engineered by replacing the initiation codon of GFP with the palmitoylation signal of GAP-43 (MLCCMRRTKQVEKNDEDQK; ref. 13).
Polyclonal antibodies raised against recombinant GFP were affinity purified on GST–GFP coupled to cyanogen bromide-activated agarose (Pharmacia). Fab fragments were generated from purified antibodies by using the Immunopure Fab preparation kit (Pierce). For binding to GPI-anchored GFP at the surface of HeLa cells, antibodies and Fab fragments were used at 10 and 20 nM, respectively.
Fluorescence Excitation Ratio Imaging.
The output of a Polychrome II grating monochromator (Till Photonics, Planegg, Germany) was fiber optically coupled to the epi-illumination port of a Zeiss Axiovert 135TV microscope. Emitted fluorescence was passed through a 500DCXR dichromatic mirror and an HQ535/50 band-pass filter (Chroma Technology, Brattleboro, VT) and collected on a PentaMAX-512EFT frame transfer camera with fiber-coupled Gen IV image intensifier (Princeton Instruments, Trenton, NJ; cooled 12-bit EEV 37 charge-coupled device chip). Experiments were controlled and images analyzed with the help of metamorph/metafluor 3.0 software (Universal Imaging, Media, PA).
To convert between the fluorescence excitation ratio at the maxima of 395 and 475 nm (R395/475) recorded in vitro and R410/470 recorded in vivo, glutathione-agarose beads bearing GST fusion proteins of GFP or ratiometric pHluorins (8) incubated at different pH values were analyzed spectroscopically and imaged under the conditions described for each system. Linear regression analysis yielded the relationship R395/475 = 2.905 (R410/470) − 0.455.
RESULTS AND DISCUSSION
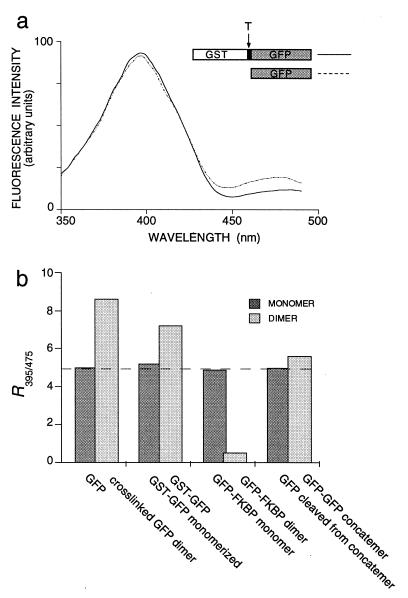
In control experiments conducted for another purpose, we found that the excitation spectrum of thermotolerant GFP (11) differed significantly from GFP expressed in E. coli as a fusion protein with GST (Fig. 1a). The R395/475 was lower for free GFP (4.92 ± 0.33) than for GST–GFP (7.23 ± 0.84), mainly because of attenuation of the 475-nm excitation band in GST–GFP (Fig. 1a).
Figure 1.
Spectral properties of GFP monomers and dimers. (a) Excitation spectra of 200 nM GFP (dotted line) and 200 nM GST–GFP (solid line) in PBS. The constructs are schematically represented above the graph; T indicates the thrombin cleavage site. (b) Comparison of R395/475 values of monomeric (darkly shaded bars) and dimeric (lightly shaded bars) fractions of GFP. The average R395/475 of monomeric GFP (4.93) is indicated as a dashed line across the bar graph. From left to right, bars denote GFP after cross-linking with a 10-fold molar excess of sulfo-EGS (dimer) and after hydroxylamine-induced cleavage of the cross-link (monomer); GST–GFP before (dimer) and after (monomer) a 15-min incubation in 2.2 M guanidine-HCl (column buffer in both cases: 1 M guanidine-HCl in PBS, pH 7.4); GFP–FKBP after incubation with FK1012 (dimer) or rapamycin (monomer); and GFP–GFP concatemer before (dimer) and after (monomer) cleavage of the 22-aa linker sequence with trypsin. Monomers and dimers were purified by gel filtration chromatography, except for the GFP-GFP concatemer, whose oligomeric state was monitored by PAGE.
This spectral change could simply reflect the perturbing effect of the covalent linkage of GFP to GST or, since GST is dimeric (14, 15), the close proximity of two GFP chromophores. To distinguish between these possibilities, GST–GFP dimers were incubated in 2.2 M guanidine-HCl, a condition that dissociates GST–GFP into monomers (ref. 14; as confirmed by gel filtration chromatography) but does not affect the fluorescence of GFP (16). Because the excitation spectrum of these GST–GFP monomers (R395/475 = 5.16 ± 0.33) was indistinguishable from that of GFP monomers obtained after thrombin cleavage (Fig. 1b) and both differed significantly from the ratio obtained for GFP in GST–GFP dimers, we conclude that the spectral change is caused by the proximity of two GFP modules.
To test the generality of this serendipitous observation, three additional types of GFP dimers were generated and analyzed spectroscopically. With one approach, GFP was chemically cross-linked by a 10-fold molar excess of the amine-reactive cross-linker sulfo-EGS. The reaction mixture was fractionated by gel filtration chromatography, and two peaks were resolved at the elution positions expected for monomeric and dimeric GFP. The R395/475 of the monomer fraction was 5.00 ± 0.34, virtually identical with that of free GFP, whereas that of the dimer fraction was 8.63 ± 0.24, similar to that of GST–GFP (Fig. 1b). After incubation of the GFP dimer in hydroxylamine (to cleave the sulfo-EGS cross-link), the originally dimeric GFP rechromatographed as a monomer (not shown) and now had an R395/475 of 4.91 ± 0.15, indistinguishable from that of unmodified GFP (Fig. 1b).
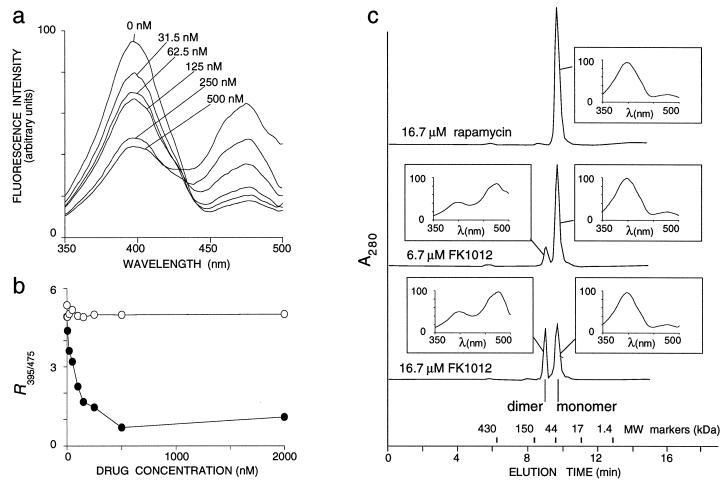
To provide a second additional test case, GFP was linked to a protein module whose oligomeric state could be controlled pharmacologically. The immunophilin FKBP, a 12-kDa protein with high affinity for the structurally related immunosuppressants FK506 and rapamycin (kd = 0.4 and 0.2 nM, respectively), has no intrinsic propensity to dimerize but can be made to do so with the membrane-permeable synthetic ligand FK1012, a dimeric derivative of FK506 (17, 18). When GFP–FKBP was incubated with FK1012, fluorescence excited at 395 nm decreased, whereas fluorescence excited at 475 nm increased, leading to a dramatic reduction in R395/475 from 4.92 ± 0.21 without FK1012 to 0.70 ± 0.08 at 500 nM FK1012 (Fig. 2a). In contrast, rapamycin, which binds to but does not dimerize FKBP domains, left the spectra of GFP–FKBP unaltered (Fig. 2b). Because R395/475 now changed in the direction opposite from that resulting from dimerization via GST or chemical cross-linking, we needed to confirm that the change in the case of GFP–FKBP was indeed caused by dimerization. Four lines of evidence imply this. (i) The effect of FK1012 was abolished by a previous exposure of GFP–FKBP to 1 μM rapamycin, a concentration sufficient to saturate the binding sites of all FKBP modules in the reaction (not shown). (ii) The reduction of R395/475 was maximal at 500 nM FK1012; responses were submaximal at lower and higher FK1012 concentrations, as expected for a bivalent cross-linking agent (Fig. 2b). (iii) Dimeric GFP–FKBP, formed when incubated with FK1012, could be separated from the remaining monomer by gel filtration chromatography. The shift from monomer to dimer was dose dependent, in a fashion that paralleled the overall spectral change (Fig. 2c). (iv) Most importantly, when analyzed separately, monomer and dimer fractions had characteristic R395/475 values of 4.94 ± 0.35 and 0.48 ± 0.02, respectively, independent of the overall extent of dimerization (Fig. 2c).
Figure 2.
Dimerization of GFP–FKBP in vitro. (a) Excitation spectra of 900 nM GFP–FKBP after a 60-min incubation in 0–500 nM FK1012. (b) R395/475 of 900 nM GFP–FKBP after a 60-min incubation in 0–2,000 nM FK1012 (•) or rapamycin (○). (c) Gel filtration profiles of 30 μM GFP–FKBP after a 60 min-incubation with 16.7 μM rapamycin (top trace), 6.7 μM FK1012 (middle trace), or 16.7 μM FK1012. Molecular mass standards were ferritin (430 kDa), IgG (150 kDa), ovalbumin (44 kDa), equine myoglobin (17 kDa), and vitamin B12 (1.35 kDa). Insets show excitation spectra of peak fractions, λ excitation wavelength; fluorescence intensity is in arbitrary units.
To provide a third additional test case, two GFP modules were covalently linked by a 22-aa spacer containing a trypsin cleavage site (3). The R395/475 of this type of dimer differed only slightly from that of monomeric GFP obtained after proteolytic cleavage of the linker sequence (5.59 ± 0.22 vs. 4.97 ± 0.13; Fig. 1b). In contrast, EGFP (19) and EBFP (20), separated by the same linker, displayed efficient fluorescence resonance energy transfer that decreased after trypsin cleavage (not shown), as previously reported (3).
The fact that several types of dimers possess characteristic and distinct spectral signatures, varying in strength and in direction, suggests that factors in addition to chromophore proximity, such as the range of orientations available in a given dimer, are important. The changes occurring during dimerization could in principle be caused by electrodynamic interactions between adjacent chromophore dipoles, the magnitude of which depends on relative dipole orientation as well as dipole separation (21), or direct but distinct structural perturbations (22) occurring when different interfaces of two GFP molecules are brought into proximity, promoting direct physical contact.
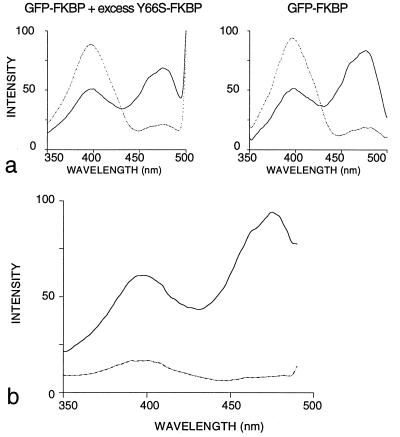
To distinguish between these two principal possibilities, heterodimers were formed between FKBP fusion proteins of GFP and a nonfluorescent GFP chromophore mutant (Y66S). In such heterodimers any electrodynamic interactions will be eliminated (because of the presence of only one fluorescent chromophore), whereas structural interactions should be preserved (because of the presence of two fully folded GFP modules). When GFP–FKBP was mixed with a 10-fold molar excess of Y66S–FKBP, addition of FK1012 resulted in the same dramatic reduction in R395/475 seen when GFP–FKBP was incubated with FK1012 (Fig. 3a). Because Y66S homodimers and GFP–Y66S heterodimers should be the predominant species under these conditions, but only the latter contribute to the fluorescent signal, it appears that the spectral shift seen upon dimerization does not require both GFP moieties within a dimer to be fluorescent.
Figure 3.
Structural perturbations drive spectral changes in GFP. (a) GFP–FKBP was mixed with 75 nM FK1012 in the presence (Left) or absence (Right) of a 10-fold molar excess of Y66S–FKBP. The total concentration of FK1012-binding sites in the reactions was kept constant at 100 nM. Spectra were recorded before (dotted lines) and after (solid lines) a 60-min incubation in FK1012 and normalized for chromophore concentrations. (b) Isolation of heterodimers between GFP–FKBP and Y66S–FKBP. His6–Y66S–FKBP bound to nickel–nitrilotriacetate beads was loaded with FK1012 (solid line) or rapamycin (dotted line) for subsequent binding of GFP–FKBP. Beads were washed extensively in PBS and heterodimers were eluted with imidazole.
To independently establish this point, hexahistidine-tagged (His6) Y66S–FKBP was bound to nickel–nitrilotriacetic acid beads and loaded with FK1012 or rapamycin. When GFP–FKBP was incubated with these beads, it bound exclusively to His6–Y66S–FKBP loaded with FK1012. These pure His6–Y66S–FKBP/GFP–FKBP heterodimers, assayed after elution with imidazole, had an R395/475 of 0.52 (Fig. 3b), which was indistinguishable from that of purified GFP–FKBP homodimers (Fig. 2c).
The fact that heterodimers containing a single chromophore were spectrally indistinguishable from homodimers indicates that structural effects account for most, if not all, of the observed changes in R395/475 upon dimerization. This implies that direct interaction between GFP modules is necessary for spectral changes. If such interaction is sterically hindered, as conceivably was the case when two GFP modules were joined via a 22-aa linker (Fig. 1b), dimerization events may remain spectrally undetectable.
The excitation ratio changes observed when GFP-tagged proteins self-associate can be sufficient for in vivo PRIM with high spatial and temporal resolution. When expressed in HeLa cells, GFP–FKBP localized throughout the cyto- and nucleoplasm (Fig. 4). Fluorescence ratio images of these cells, acquired under 410 and 470 nm excitation (8), showed an R410/470 value of 1.89 ± 0.18. Based on a careful calibration of the imaging system against the spectrofluorimeter (see Materials and Methods), this R410/470 corresponds to the R395/475 value of 5.04 ± 0.48 obtained in a cuvette, the diagnostic of monomeric GFP.
Figure 4.
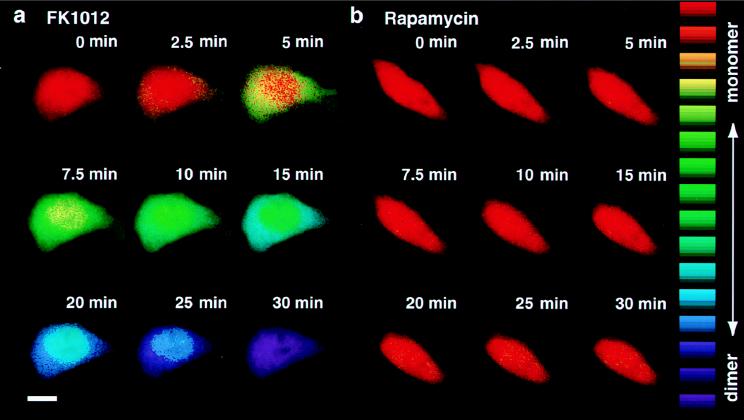
Dimerization of GFP–FKBP in vivo. HeLa cells on glass coverslips were transfected with pCI GFP–FKBP using Superfect reagent (Qiagen). Cells were imaged at 37°C 24–36 h after transfection, after the growth medium was replaced with PBS containing 1 mM MgCl2, 1 mM CaCl2, 1 mg/ml BSA, and 30 mM glucose. FK1012 (a, 500 nM) or rapamycin (b, 500 mM) was added, and images were acquired after the indicated number of minutes. Ratio images were color-encoded according to the lookup table displayed on the right, ranging from mostly monomeric GFP–FKBP with an R410/470 of 1.90 (red) to mostly dimeric GFP–FKBP with an R410/470 of 0.35 (purple). (Bar = 10 μm.)
Whereas 500 nM rapamycin left R410/470 essentially unaltered (Fig. 4b), 500 nM FK1012 decreased the R410/470 value of GFP–FKBP (but not that of GFP alone; not shown) dramatically (Fig. 4a). R410/470 reached a virtually identical plateau value of 0.44 ± 0.10 for both the cytoplasm and the nucleus, a value equivalent to 0.84 ± 0.21 in vitro. Therefore, most (≈85%) GFP–FKBP monomers were incorporated into dimers at the plateau (compare with Fig. 2). The times required to reach the end point were functions of the FK1012 concentration and often conspicuously shorter in the cytoplasm than in the nucleus, most likely because of the presence of different concentrations of endogenous FK1012-binding proteins in each compartment (Fig. 4a). Preincubation of the cells in 1 μM rapamycin completely prevented the FK1012-induced excitation ratio change (not shown).
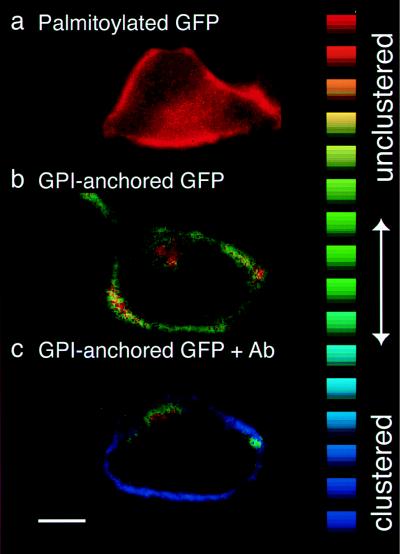
Can PRIM be used to provide hard biological information? A second PRIM experiment was designed to test the hypothesis that GPI-anchored proteins cluster in glycolipid “rafts” at the cell surface (23, 24). GPI-anchored GFP, when enriched in such rafts and therefore held in closer than average proximity to other GPI-anchored GFPs, might undergo a detectable spectral change. The R410/470 values recorded from GPI-anchored GFP (12) expressed at the surface of HeLa cells (1.68 ± 0.09, corresponding to an R395/475 of 4.43 ± 0.22 in vitro) were indeed slightly different from those of GFP expressed in the cytoplasm (1.89 ± 0.18). This small, but perhaps significant, difference could simply reflect the presence of a membrane anchor that constrains the protein to a two-dimensional surface and thereby facilitates chance encounters with like proteins. Alternatively, the difference could indicate specific GPI anchor-mediated clustering.
To distinguish diffusional constraint from specific clustering, R410/470 values recorded from GFP bearing two N-terminal palmitate acyl chains (13), which provide membrane attachment but are unlikely to mediate clustering, were compared with those of GPI-anchored GFP and soluble GFP. Palmitoylated GFP yielded an R410/470 of 1.88 ± 0.16. This value is virtually identical to that of soluble GFP (1.89 ± 0.17) but clearly different from that of GPI-anchored GFP (1.68 ± 0.09; ANOVA, F = 38.75, P < 0.0001), suggesting that the difference in R410/470 is indeed GPI-anchor specific (Fig. 5 a and b).
Figure 5.
Clustering of GPI-anchored proteins at the cell surface. HeLa cell expressing palmitoylated GFP (a), GPI-anchored GFP (b), and GPI-anchored GFP 1 min after addition of 10 nM anti-GFP antibody to the imaging medium (c, same cell as in b). R410/470 was color encoded according to the lookup table displayed on the right, with a range from 1.90 (red) to 0.90 (blue). (Bar = 10 μm.)
The relatively small spectral change indicates that clustering via GPI anchors is rather loose and/or transient. For comparison, tight, permanent clustering induced by adding a bivalent antibody against GFP reduced R410/470 to 1.00 ± 0.15 (R395/475 of 2.45 ± 0.44); intracellular fluorescence did not undergo any R410/470 shift (Fig. 5 b and c). Monovalent Fab fragments generated from the same antibody had no effect (R410/470 of 1.68 ± 0.09 before addition vs. 1.60 ± 0.15 after addition).
In summary, PRIM ratio images of proteins tagged with wild-type GFP can reveal the location, dynamics and extent of homotypic protein–protein interactions. When the geometry for interaction is favorable, PRIM is sensitive enough to detect subtle differences in association kinetics (nuclear vs. cytoplasmic rate of FK1012-induced GFP–FKBP dimerization) and frequency (palmitoylated vs. GPI-linked GFP). In these cases, R410/470 can serve as a robust ratiometric “association index” that can be read out in identified subcellular compartments or in entire populations of cells, the latter making feasible high-throughput screens for compounds affecting self-association events in signal transduction or gene expression. Although detailed interpretation of R410/470 changes is still not possible, and as a result the spectral change in any one construct or system is unpredictable, nonetheless PRIM can yield direct information about the dynamics of protein assemblies in vitro and in vivo.
Acknowledgments
We thank Stuart L. Schreiber for the gifts of FK1012, rapamycin, and the cDNA encoding FKBP12; Francesco Parlati for generously providing the anti-GFP serum; Thomas Engel for help with cloning; Rebecca Miller for technical assistance; the Fonds de la Recherche en Santé du Québec for a postdoctoral fellowship to D.A.D.; and the National Institutes of Health for a postdoctoral fellowship to B.V.Z. This research was kindly supported by the G. Harold and Leila Y. Mathers Charitable Foundation.
ABBREVIATIONS
- PRIM
proximity imaging
- GFP
green fluorescent protein
- GST
glutathione S-transferase
- sulfo-EGS
ethylene glycobis(sulfosuccinimidylsuccinate)
- FKBP
FK506-binding protein
- GPI
glycosylphosphatidylinositol
- Rx/y
ratio of fluorescence intensities emitted upon excitation at wavelengths (in nm) x and y
Note Added in Proof
Two reports published following the submission of this manuscript have demonstrated clustering of GPI-anchored proteins in living cells by using fluorescence anisotropy measurements (25) or cross-linking experiments (26).
References
- 1. Chalfie M, Tu Y, Euskirchen G, Ward W W, Prasher D C. Science. 1994;263:802–805. doi: 10.1126/science.8303295. [DOI] [PubMed] [Google Scholar]
- 2.Tsien R Y. Annu Rev Biochem. 1998;67:509–544. doi: 10.1146/annurev.biochem.67.1.509. [DOI] [PubMed] [Google Scholar]
- 3.Heim R, Tsien R Y. Curr Biol. 1996;6:178–182. doi: 10.1016/s0960-9822(02)00450-5. [DOI] [PubMed] [Google Scholar]
- 4.Mitra R D, Silva C M, Youvan D C. Gene. 1996;173:13–17. doi: 10.1016/0378-1119(95)00768-7. [DOI] [PubMed] [Google Scholar]
- 5.Yokoe H, Meyer T. Nat Biotechnol. 1996;14:1252–1256. doi: 10.1038/nbt1096-1252. [DOI] [PubMed] [Google Scholar]
- 6.Miyawaki A, Llopis J, Heim R, McCaffery J M, Adams J A, Ikura M, Tsien R Y. Nature (London) 1997;388:882–887. doi: 10.1038/42264. [DOI] [PubMed] [Google Scholar]
- 7.Romoser V A, Hinkle P M, Persechini A. J Biol Chem. 1997;272:13270–13274. doi: 10.1074/jbc.272.20.13270. [DOI] [PubMed] [Google Scholar]
- 8.Miesenböck G, De Angelis D A, Rothman J E. Nature (London) 1998;394:192–195. doi: 10.1038/28190. [DOI] [PubMed] [Google Scholar]
- 9.Kneen M, Farinas J, Li Y, Verkman A S. Biophys J. 1998;74:1591–1599. doi: 10.1016/S0006-3495(98)77870-1. [DOI] [PMC free article] [PubMed] [Google Scholar]
- 10.Llopis J, McCaffery J M, Miyawaki A, Farquhar M G, Tsien R Y. Proc Natl Acad Sci USA. 1998;95:6803–6808. doi: 10.1073/pnas.95.12.6803. [DOI] [PMC free article] [PubMed] [Google Scholar]
- 11.Siemering K R, Golbik R, Sever R, Haseloff J. Curr Biol. 1996;6:1653–1663. doi: 10.1016/s0960-9822(02)70789-6. [DOI] [PubMed] [Google Scholar]
- 12.Caras I W, Weddell G N, Davitz M A, Nussenzweig V, Martin D W., Jr Science. 1987;238:1280–1283. doi: 10.1126/science.2446389. [DOI] [PubMed] [Google Scholar]
- 13.Liu Y, Fisher D A, Storm D R. J Neurosci. 1994;14:5807–5817. doi: 10.1523/JNEUROSCI.14-10-05807.1994. [DOI] [PMC free article] [PubMed] [Google Scholar]
- 14.Sacchetta P, Aceto A, Bucciarelli T, Dragani B, Santarone S, Allocati N, Di Ilio C. Eur J Biochem. 1993;215:741–745. doi: 10.1111/j.1432-1033.1993.tb18087.x. [DOI] [PubMed] [Google Scholar]
- 15.Lim K, Ho J X, Keeling K, Gilliland G L, Ji X, Ruker F, Carter D C. Protein Sci. 1994;3:2233–2244. doi: 10.1002/pro.5560031209. [DOI] [PMC free article] [PubMed] [Google Scholar]
- 16.Ward W W, Bokman S H. Biochemistry. 1982;21:4535–4540. doi: 10.1021/bi00262a003. [DOI] [PubMed] [Google Scholar]
- 17.Schreiber S L. Science. 1991;251:283–287. doi: 10.1126/science.1702904. [DOI] [PubMed] [Google Scholar]
- 18.Spencer D M, Wandless T J, Schreiber S L, Crabtree G R. Science. 1993;262:1019–1024. doi: 10.1126/science.7694365. [DOI] [PubMed] [Google Scholar]
- 19.Cormack B P, Valdivia R H, Falkow S. Gene. 1996;173:33–38. doi: 10.1016/0378-1119(95)00685-0. [DOI] [PubMed] [Google Scholar]
- 20.Yang T T, Sinai P, Green G, Kitts P A, Chen Y T, Lybarger L, Chervenak R, Patterson G H, Piston D W, Kain S R. J Biol Chem. 1998;273:8212–8216. doi: 10.1074/jbc.273.14.8212. [DOI] [PubMed] [Google Scholar]
- 21.Förster T. Ann Phys. 1948;2:55–75. [Google Scholar]
- 22.Ward W W, Prenctice H J, Roth A F, Cody C W, Reeves S C. Photochem Photobiol. 1982;35:803–808. [Google Scholar]
- 23.Simons K, Ikonen E. Nature (London) 1997;387:569–572. doi: 10.1038/42408. [DOI] [PubMed] [Google Scholar]
- 24.Lisanti M P, Rodriguez-Boulan E. Trends Biochem Sci. 1990;15:113–118. doi: 10.1016/0968-0004(90)90195-h. [DOI] [PubMed] [Google Scholar]
- 25.Varma R, Mayor S. Nature (London) 1998;394:798–801. doi: 10.1038/29563. [DOI] [PubMed] [Google Scholar]
- 26.Friedrichson T, Kurzchalia T V. Nature (London) 1998;394:802–805. doi: 10.1038/29570. [DOI] [PubMed] [Google Scholar]


