

Abstract
We developed a variant of the intermediate sequence search method (ISSnew) for detection and alignment of weakly similar pairs of protein sequences. ISSnew relates two query sequences by an intermediate sequence that is potentially homologous to both queries. The improvement was achieved by a more robust overlap score for a match between the queries through an intermediate. The approach was benchmarked on a data set of 2369 sequences of known structure with insignificant sequence similarity to each other (BLAST E-value larger than 0.001); 2050 of these sequences had a related structure in the set. ISSnew performed significantly better than both PSI-BLAST and a previously described intermediate sequence search method. PSI-BLAST could not detect correct homologs for 1619 of the 2369 sequences. In contrast, ISSnew assigned a correct homolog as the top hit for 121 of these 1619 sequences, while incorrectly assigning homologs for only nine targets; it did not assign homologs for the remainder of the sequences. By estimate, ISSnew may be able to assign the folds of domains in ~29,000 of the ~500,000 sequences unassigned by PSI-BLAST, with 90% specificity (1 − false positives fraction). In addition, we show that the 15 alignments with the most significant BLAST E-values include the nearly best alignments constructed by ISSnew.
Keywords: protein homology, protein evolution, sequence alignment, comparative protein structure modeling, fold assignment
The genome sequencing projects are providing a vast number of novel protein sequences (Cantor and Little 1998; Grunenfelder and Winzeler 2002). The functions of these proteins must be annotated. Even for model organisms, such as yeast and Escherichia coli, the bulk of the coarse functional annotation originates from establishing a relationship between an uncharacterized sequence and a characterized sequence (Serres et al. 2001). However, sequences of related proteins can diverge beyond the point where their relationships are detectable by current sequence-alignment and even fold-assignment programs (Sippl et al. 2001). For example, it has been estimated that only one-quarter of the pairwise relationships with less than 30% sequence identity can be identified with the fold-assignment programs (Park et al. 1998).
Intermediate sequence search (ISS) is one of the methods for detecting remote homologs (Park et al. 1997; Gerstein 1998; Salamov et al. 1999; Li et al. 2000, 2002; Teichmann et al. 2000; Pipenbacher et al. 2002). For two sequences whose homology cannot be established by a direct comparison, ISS attempts to relate them through a third sequence that is detectably homologous to both of the original sequences. First, a multiple sequence alignment is constructed for each of the query sequences. Next, intermediate sequences that occur in both multiple alignments are noted. An overlap score is then calculated that measures the extent of the overlap between the two query sequences implied by an intermediate. And finally, if the overlap score for any of the intermediates is sufficiently high, the two queries are declared to be related. A benchmark of ISS increased the rate of the correctly detected relationships from 43% to 59% (Salamov et al. 1999) relative to BLAST (Altschul et al. 1997), without producing any false positives.
Despite the usefulness of ISS, it is limited by two problems. First, a problem arises when the intermediate sequence is in fact not a homolog of either one or both of the queries. This problem is a consequence of the false positives in the sequence alignment methods. Second, when the implied overlap between the two queries is short, it is especially difficult to judge whether or not they originated from a common ancestor. This problem is relatively frequent for proteins with multiple domains and is a consequence of the inability of local sequence-alignment methods to detect the precise bounds of the domains.
A widely used overlap scoring scheme in ISS sets a threshold for the length of the segment of the intermediate that is aligned with both queries (Park et al. 1997, 1998; Gerstein 1998; Salamov et al. 1999). In other words, the overlap region between the first query and the intermediate must share a specific number of residues with the overlap region between the intermediate and the other query. This threshold for the overlap length does not depend on the length of the sequences. To improve the sensitivity and specificity of ISS, we propose a new overlap score for a match between two queries through an intermediate that minimizes both of the problems described above. In addition, unlike other ISS methods that made use of multiple sequence alignments with relatively few sequences (Park et al. 1997; Gerstein 1998; Salamov et al. 1999; Li et al. 2000; Teichmann et al. 2000) obtained by BLAST (Altschul et al. 1990) or FASTA (Pearson 1990), we used the more sensitive PSI-BLAST program (Altschul et al. 1997) to generate the multiple sequence alignments for ISS. Moreover, we also assess the accuracy of the alignment between the two queries implied by an intermediate sequence.
We begin by describing various ISS protocols, the remotely related protein structure pairs and alignments that are used for benchmarking, and the benchmarking criteria (Materials and Methods). In Results and Discussion, we contrast the performance of ISS in homolog detection to that of PSI-BLAST, and describe the accuracy of ISS alignments as well as the use of an alignment significance score in selecting the most accurate ISS alignments. We conclude by discussing the implications of our results for fold assignment and alignment in comparative protein structure modeling of targets that are only remotely related to their templates.
Materials and methods
ISS criteria for homology detection
We tested a previously described score (ISSold; Park et al. 1997; Gerstein 1998; Salamov et al. 1999) and a new overlap score (ISSnew) to detect homology between two query sequences using ISS. For ISSold, the intermediate must share a common region of overlap (“C” in Fig. 1 ▶) that is equal to or longer than the threshold (Park et al. 1997; Gerstein 1998; Salamov et al. 1999). Unlike ISSold, ISSnew normalizes the overlap threshold over the length of the intermediate sequence (Fig. 1 ▶). The ISSnew overlap score is 0 if no residues in the intermediate match both queries; otherwise,
Figure 1.

An alignment of the target sequence with an intermediate and a putative homolog. The dotted and the dashed lines represent the intermediate aligned to the putative homolog and the target, respectively. The positions of the starting residues in the alignment of the intermediate with the putative homolog and the target are denoted by its and iqs, respectively. The positions of the ending residues are denoted by ite and iqe. The number of residues in the common overlap region of the intermediate is indicated by C.
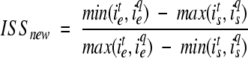 |
(1) |
For a given pair of query sequences, the ISSnew overlap score is calculated for each intermediate sequence. If the maximum ISSnew overlap score is above a threshold value, the queries are predicted to be related.
Ranking of the putative homologs of a target sequence
For a given target sequence, PSI-BLAST and ISS can identify many putatively related proteins. However, it is frequently convenient to select only a few predicted homologs for further consideration, such as experimental validation of the implied function. Hence, there is a need to rank the putative homologs. We used E-values to rank homologs detected by PSI-BLAST. In contrast, the ranking of the ISS predictions was achieved by the following relative significance score:
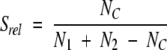 |
(2) |
where N1 and N2 are the numbers of sequences in the putative homolog and target multiple alignments, respectively, and NC is the number of the intermediate sequences. For two multiple alignments containing the same sequences, Srel is 1. Two multiple alignments without any common sequences have the relative significance score of 0. The Srel score is not used for the ranking of ISS alignments (below).
Data set of remotely related sequences
The ASTRAL compendium (http://astral.stanford.edu; Brenner et al. 2000) provides a convenient source of protein structures whose relationships are well defined through the SCOP database (Barton 1994; Lo et al. 2000) as well as additional inspection and automated validation (Gerstein and Levitt 1998). To test the accuracy and performance of our ISS protocol, we needed sequences whose homologs are difficult to detect. Such a data set was obtained by an ASTRAL request for sequences of known structure such that none of the pairs in the set can be aligned with the significance E-value better than 0.001, as calculated by BLAST (Altschul et al. 1990). For 2369 such sequences, the total number of distinct random pairs is 2,804,896 (2369 × 2368 / 2). Two sequences were defined as structurally related if they shared the same fold type in the SCOP database. Of the 2369 sequences, 2050 had a related structure in the set. Some pairs of sequences with related structures may have evolved convergently, and therefore their relationship is not detectable even in principle by sequence-based methods such as PSI-BLAST. Although this difficulty makes the benchmark more demanding, it does not invalidate it.
The multiple alignments for all 2369 sequences (data set SEQS-EASY) were obtained by PSI-BLAST 2.1.2 (Altschul et al. 1997), scanning the nonredundant protein sequence database at NCBI (January 2001) with the E-value cutoff of 0.0005 and for up to 20 iterations. For 1619 of the 2369 sequences, PSI-BLAST did not detect any homologs in SEQS-EASY (data set SEQS-HARD). Nevertheless, 1354 sequences in SEQS-HARD were structurally related to at least one sequence in SEQS-EASY.
ISS alignments and their ranking
For each sequence in SEQS-HARD, intermediate sequences with the overlap length threshold of five residues were used to predict related sequences in SEQS-HARD. For each pair of putatively related sequences, 200 alignments were selected such that the corresponding intermediates had the longest overlaps (C). The alignments were constructed by using the PSI-BLAST alignments of the intermediate against the two related sequences and ranked by E-value as described below. The total number of generated alignments was 26,491 (ALNS-HARD). Because very short alignments are generally not useful, we removed the alignments with less than 20 residues in the shortest sequence. This filtering yielded 22,732 alignments (ALNS-HARDfiltered).
To rank the alignments produced by ISS as described above, we used the E-values based on the Karlin-Altschul statistics (Altschul et al. 1997). For a given alignment of two sequences with lengths m and n, the E-value is defined as:
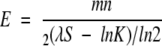 |
(3) |
λ and K were obtained from the PSI-BLAST output for the shortest sequence in the alignment. The sequence similarity score (S) of the alignment was calculated using an amino acid residue substitution matrix with the corresponding recommended initiation (u) and extension (v) gap penalties (Apostolico and Giancarlo 1998). The amino acid residue substitution matrices used were BC0030 (u = −17, v = −2; Blake and Cohen 2001), BLOSUM62 (u = −11,v = −1; Henikoff and Henikoff 1992), and OPTIMA (u = −12,v = −2; Kann et al. 2000). The values of λ and K used here may not be optimal for all of the gap penalties and substitution matrices. Nevertheless, we justify our choice by its efficiency relative to the simulations needed for calculating λ and K for diverse matrices and gap costs. The use of more accurate values of λ and K would only increase the accuracy of the selected alignments in ISSnew.
Assessment of fold assignment
When multiple homologs were identified by ISS and PSI-BLAST, they were ranked by Srel and the E-value, respectively, as described above.
A prediction was defined to be a true positive when the top hit was correct (i.e., had the same fold). Similarly, a false positive was defined when a positive prediction of a target-homolog relationship was made incorrectly. The number of false negatives was defined as the difference between the total number of sequences with at least one structurally related sequence and the number of true positives. Similarly, the number of true negatives was defined as the difference between the number of sequences without a related structure and the number of false positives.
To assess the accuracy of ISS and PSI-BLAST on the SEQS-EASY data set, Receiver Operating Characteristic (ROC) curves were prepared and inspected (Theodoridis and Koutroumbos 1999). An ROC curve is obtained by plotting the sensitivity against the corresponding false-positives fraction over a range of thresholds for the assignment of a relationship. The false-positives fraction and sensitivity are defined as:
 |
(4a) |
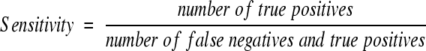 |
(4b) |
One method is superior to another if it produces a higher ROC curve.
Assessment of alignments
Two measures were used to evaluate the alignment accuracy. The first structure-based measure is the root-mean-square deviation (RMSD) between the aligned Cα atoms of the two structures upon a rigid-body least-squares superposition, as implemented in the SUPERPOSE command of MODELLER (Sali and Blundell 1993; Sanchez and Sali 2000). The second structure-based measure (coverage) is the percentage of Cα atoms of the shorter structure that are superimposed within a cutoff distance of 3.5 Å upon rigid-body least-squares superposition using the aligned positions in the tested alignment.
Computer algorithm
The ISSnew program takes as input multiple sequence alignments for a target sequence and potential homologs. The output is the list of putative homologs identified by ISSnew. The program was written in PERL 5, making use of the nested data structures in PERL. These data structures enable rapid searches for intermediate sequences between two given query multiple alignments. For a comparison between two multiple alignments with N sequences in the smaller alignment, the algorithmic complexity is O(N) (Goodrich and Tamassia 2002). Despite the large number of sequences in most of the multiple alignments, the program completed approximately 1000 ISS jobs per sec on a 3-GHz Pentium IV processor running a Linux operating system. A straightforward implementation in Fortran, relying on an N × N test of intermediate sequences, runs ~600 times slower on average.
Results and Discussion
Performances of ISS and PSI-BLAST
An ideal homology detection method would identify all homologs for every target sequence in a test set, while also having no false predictions. However, programs often miss homologs as well as incorrectly assign homologs that are structurally unrelated to the target sequence. ROC curves are frequently used to compare both aspects of the different programs.
We used ROC curves to analyze the performance of PSI-BLAST as well as ISS with the ISSold and ISSnew scores on the SEQS-EASY testing set (Fig. 2 ▶). The ROC curves show that the ISSnew method is the best, followed by ISSold and PSI-BLAST. For instance, the sensitivity for ISSnew and ISSold for the top predictions at the fraction of false positives of 0.05 are 0.42 and 0.24, respectively (Fig. 2 ▶). Thus, at the specificity (1 − false positives fraction) of 95%, ISSnew detected 18% more true positives than ISSold. Moreover, the performance of the ISSnew score is almost as good for the top hit as it is for the top 10 hits, indicating that the correct hit is usually also the top hit (data not shown).
Figure 2.

Accuracy of ISSnew, ISSold, and PSI-BLAST on SEQS-EASY. The accuracy is described by the ROC curves (Materials and Methods) for PSI-BLAST (dashed line), ISSold (dotted line), and ISSnew (solid line).
By construction of the SEQS-HARD benchmark, PSI-BLAST does not correctly assign a homolog for any of the 1354 sequences that had a structurally related sequence in it. Thus, SEQS-HARD is a more difficult data set for homology detection programs than SEQS-EASY. With an ISSnew score threshold of 0.8, ISSnew assigned a correct homolog as the top hit for 121 (8.9%) of the sequences in SEQS-HARD, and incorrectly assigned homologs for only nine queries.
Dependence of the fractions of false positives and negatives on the target-sequence length
The performance of ISS depends largely on the accuracy of the multiple sequence alignments. Errors can occur in these alignments for various reasons. For example, PSI-BLAST sequence profiles can diverge after a few iterations (Park et al. 1998). New sequences can be added to the profile, while not detecting sequences that were added in previous iterations, resulting in a divergent sequence profile comprising different protein families. Another source of error is an alignment of a short target sequence with a region of a longer sequence that shares significant sequence similarity but belongs to a different family. Hence, we speculated that the performance of both ISS and PSI-BLAST might be dependent on the target-sequence length.
We measured the accuracy of ISSnew, ISSold, and PSI-BLAST as a function of target-sequence length, based on top hits for each target in the SEQS-EASY set (Fig. 3 ▶). The sequence length ranges were (1) less than 100 residues (small), (2) between 100 and 200 residues (medium), and (3) greater than 200 residues (large). Irrespective of the sequence lengths, ISSnew was always more accurate than ISSold and PSI-BLAST. The differences between the accuracies of ISS and PSI-BLAST were larger for medium- to large-size proteins than for small proteins. This observation indicates that ISS is most useful in detecting homologs for medium-size and large proteins. The intersection of the ISSold and PSI-BLAST ROC curves for small proteins indicates that ISSold is not always superior to PSI-BLAST (Fig. 3A ▶). Although ISSnew performed best for large proteins (Fig. 3C ▶), the maximum difference in accuracies between ISSnew and ISSold is observed for small proteins (Fig. 3A ▶). In summary, ISSnew is a better tool for detecting remotely related pairs than PSI-BLAST and ISSold, irrespective of the protein size.
Figure 3.

Accuracies of ISSnew, ISSold, and PSI-BLAST at different target-sequence lengths. (See Figure 2 ▶ legend for a description of the different symbols used.) The sequence lengths are less than 100 residues (A), between 100 and 200 residues (B), and greater than 200 residues (C).
Alignment accuracy
With the assurance that the ISS methods for detection of remotely related protein pairs add value to the PSI-BLAST results, we proceeded to analyze the accuracy of alignments in the ALNS-HARD testing set. The alignment accuracy often limits the utility of an established relationship. For example, alignment errors are responsible for about half of the grossly mismodeled residues (i.e., residues whose Cα positions are modeled with an error larger than 3.5 Å) in comparative modeling (Sanchez and Sali 1998). We studied the variation of the average Cα RMSD and the coverage as a function of the thresholds on the ISSnew score and the overlap length C (Fig. 4 ▶).
Figure 4.

Average alignment accuracy as a function of the thresholds on the overlap length (x-axis) and the ISSnew score (M). Error bars indicate the standard error of the mean; they are so small that they are almost invisible. Alignment accuracy is measured by the Cα RMSD between the compared structures (A) and coverage (B).
The average values were computed over all alignments with ISSnew score or overlap length (ISSold) greater than or equal to the corresponding thresholds. Average alignment accuracy significantly increased with higher ISSnew score thresholds. For example, when the ISSnew score increases from 0 to 0.8 at an overlap length of 100 residues, the average Cα RMSD decreases from 10.1 Å to 9.0 Å (Fig. 4A ▶). Correspondingly, the average coverage increases from 26% to 32% (Fig. 4B ▶). In contrast, an increase in the ISSold overlap length threshold significantly decreases the average alignment accuracy. Because decreasing the overlap length threshold implies shorter intermediate sequences and thus shorter alignments, ISSold is not very useful in generating alignments for comparative modeling. Next, we discuss the role of ISSnew alignments in comparative modeling.
Selecting most accurate ISS alignments by their E-values
Generally, a large number of alignments are generated by ISS for each predicted target-homolog pair. Many of these alignments might be grossly inaccurate. We analyzed the usefulness of the E-value score for the selection of accurate alignments in ISS. E-values were computed for all alignments in ALNS-HARD using the BLOSUM62 residue-type substitution matrix. Variation of the average alignment accuracy with respect to its E-value is shown in Figure 5 ▶. The alignments were generally accurate below the E-value of 104. The average Cα RMSD and coverage for these alignments were 2.3 Å and 76.4%, respectively. Alignments were grossly inaccurate above an E-value of 1011. The average alignment accuracy generally improves with the decreasing E-value. This observation suggests that although E-values are high for remotely related pairs, they may still be useful for selecting most accurate ISS alignments for comparative modeling.
Figure 5.

Average alignment accuracy as a function of the E-value. The E-values were calculated using the BLOSUM62 amino acid substitution matrix. The alignments of the pairs in SEQS-HARD are obtained by ISSnew. (See Figure 4 ▶ for details.)
Given the correlation between the E-value and the average alignment accuracy, we proceeded to use E-values for selecting the top five alignments. In general, the average accuracy of the top five alignments (Fig. 6 ▶) is significantly better than that of all alignments (Fig. 4 ▶). For instance, at an ISSnew score and overlap length threshold of 0.8 and 100 residues, respectively, the average Cα RMSD improves from 9.0 Å (Fig. 4A ▶) to 7.1 Å (Fig. 6A ▶). Correspondingly, the average coverage improves from 32% (Fig. 4B ▶) to 37.2% (Fig. 6B ▶). These improvements in the average alignment accuracy corroborate the conclusion that E-values are useful in selecting most accurate alignments in ISS.
Figure 6.

Average alignment accuracy of the top five alignments selected by E-value as a function of the thresholds on the overlap length (x-axis) and the ISSnew score (M). The E-values were calculated using the BLOSUM62 amino acid substitution matrix. (See Figure 4 ▶ for details.)
Accuracy of the best alignments
Often, it is useful to consider more than one alignment between a given pair of proteins. For example, the best comparative model for a target based on a remotely related template structure can be obtained by using a number of alternative alignments to build and assess the corresponding models (Saqi et al. 1992; Guenther et al. 1997; Sanchez and Sali 1997; Contreras-Moreira et al. 2003; John and Sali 2003).
Using alignments in the ALNS-HARDfiltered set, we studied the number of alignments that must be selected by E-value to guarantee the best alignment in the selected set. The E-values were calculated using three different residue-type substitution matrices, including BC0030 (Blake and Cohen 2001), BLOSUM62 (Henikoff and Henikoff 1992), and OPTIMA (Kann et al. 2000). There are no significant differences between the performances of E-values calculated with the tested substitution matrices (Fig. 7 ▶). The top 100 alignments usually include the best alignment from the set of alignments generated. The top 15 alignments often contain alignments that are very close in accuracy to the best alignment generated. The average Cα RMSD and coverage for the best alignments in the selected set of 15 are approximately 6 Å and 35%, respectively. These alignments are generally useful to generate low-resolution comparative models. They are also useful as a starting set of alignments that can be fine-tuned by modeling experts as well as our new model building scheme that relies on iterative alignment, model building, and model assessment (John and Sali 2003). For these reasons, ISSnew can be used both for fold assignment and alignment in comparative modeling of remotely related sequence-structure pairs.
Figure 7.

Average alignment accuracy of the best alignments in the selected set of alignments. Accuracy of the alignments selected by E-value using BC0030, BLOSUM62, and OPTIMA residue-type substitution matrices. Alignment accuracy is measured by the Cα RMSD of the structures (A) and coverage (B).
Computational considerations
Once multiple sequence alignments are created, ISS is a rapid method for detecting remotely related homologs. For example, detecting a template structure by comparing a target multiple alignment with those of the potential templates takes a matter of seconds. Correspondingly, folds for the ~30,000 sequences in the human genome (Pennisi 2003) could be assigned by scanning their multiple sequence alignments against those of ~10,000 representative structures in PDB on a single 3-GHz Pentium IV processor in ~4 days.
Moreover, the process can be considerably sped up if redundant sequences in the multiple alignments as well as redundant multiple alignments are removed prior to a search for intermediates. Eliminating such redundancies would reduce both the number of sequences that are stored in the computer memory and the total number of sequences that need to be compared with the sequences in the target multiple alignment.
Conclusion
We described the use of the intermediate sequence search (ISS) method for detection of remote homologs. We assessed the accuracy of PSI-BLAST, a previously described version of ISS (ISSold), and our improved version of ISS (ISSnew) for homology detection as well as alignment. We also described the usefulness of E-values for selecting most accurate alignments produced by ISS.
The ISSnew protocol performed significantly better in homology detection than ISSold and PSI-BLAST. The benchmark relied on 2369 sequences of known structure with insignificant sequence similarity to each other (BLAST E-value larger than 0.001), with 2050 of these sequences having a related structure in the set. PSI-BLAST could not detect homologs for 1619 of the 2369 sequences. In contrast, ISSnew assigned a correct homolog as the top hit for 121 of these 1619 sequences, while incorrectly assigning homologs for only nine targets; it did not assign homologs for the remainder of the sequences.
Although E-values for ISS alignments are generally insignificant, the average alignment accuracy and E-values are still correlated (Fig. 5 ▶). The E-values can in fact be used to select the most accurate alignments produced by ISS. The top 15 alignments usually include the nearly best alignments constructed by ISS. These alignments could be used to calculate the corresponding comparative models, assess the models, and select the best model based on a model assessment score rather than an alignment score (John and Sali 2003).
Improvements in fold assignment and alignment accuracy are required for more accurate comparative modeling of hundreds of thousands of sequences. The number of target structures for comparative modeling of most proteins based on at least 30% sequence identity to a known structure is estimated to be ~16,000 (Vitkup et al. 2001). A reduction of this number, while keeping the accuracy of the corresponding models constant, would reduce both the cost and time required by structural genomics to fulfill its aim (Sali 1998; Burley et al. 1999; Terwilliger 2000; Burley and Bonanno 2003). This reduction can be partly achieved by using more sensitive fold-detection methods, such as the ISS method described here.
We plan to apply our ISS method to large-scale comparative protein structure modeling, and thus increase the number of modeled proteins in MODBASE, our comprehensive database of comparative models for all known protein sequences that are detectably related to a known structure (Pieper et al. 2002). Currently, 14% (~110,400) of the modeled proteins in MODBASE are based on PSI-BLAST fold assignments with insignificant sequence similarity to the modeled sequence (BLAST E-value is larger than 0.001; Pieper et al. 2002). An extrapolation based on Figure 1A ▶ indicates that ISSnew may be able to assign the folds of domains in ~29,000 of the ~500,000 sequences unassigned by PSI-BLAST, with 90% specificity.
Acknowledgments
We thank our group members for many discussions about the protein sequence comparison problem. This work was supported in part by the Sandler Family Supporting Foundation, Sun Academic Equipment Grant EDUD-7824-020257-US, and NIH grants R01 GM54762 and P50 GM62529.
The publication costs of this article were defrayed in part by payment of page charges. This article must therefore be hereby marked “advertisement” in accordance with 18 USC section 1734 solely to indicate this fact.
Article and publication are at http://www.proteinscience.org/cgi/doi/10.1110/ps.03335004.
References
- Altschul, S.F., Gish, W., Miller, W., Myers, E.W., and Lipman, D.J. 1990. Basic local alignment search tool. J. Mol. Biol. 215 403–410. [DOI] [PubMed] [Google Scholar]
- Altschul, S.F., Madden, T.L., Schaffer, A.A., Zhang, J., Zhang, Z., Miller, W., and Lipman, D.J. 1997. Gapped BLAST and PSI-BLAST: A new generation of protein database search programs. Nucleic Acids Res. 25 3389–3402. [DOI] [PMC free article] [PubMed] [Google Scholar]
- Apostolico, A. and Giancarlo, R. 1998. Sequence alignment in molecular biology. J. Comput. Biol. 5 173–196. [DOI] [PubMed] [Google Scholar]
- Barton, G.J. 1994. Scop: Structural classification of proteins. Trends Biochem. Sci. 19 554–555. [DOI] [PubMed] [Google Scholar]
- Blake, J.D. and Cohen, F.E. 2001. Pairwise sequence alignment below the twilight zone. J. Mol. Biol. 307 721–735. [DOI] [PubMed] [Google Scholar]
- Brenner, S.E., Koehl, P., and Levitt, M. 2000. The ASTRAL compendium for protein structure and sequence analysis. Nucleic Acids Res. 28 254–256. [DOI] [PMC free article] [PubMed] [Google Scholar]
- Burley, S.K. and Bonanno, J.B. 2003. Structural genomics. Methods Biochem. Anal. 44 591–612. [PubMed] [Google Scholar]
- Burley, S.K., Almo, S.C., Bonanno, J.B., Capel, M., Chance, M.R., Gaasterland, T., Lin, D., Sali, A., Studier, F.W., and Swaminathan, S. 1999. Structural genomics: Beyond the human genome project. Nat. Genet. 23 151–157. [DOI] [PubMed] [Google Scholar]
- Cantor, C.R. and Little, D.P. 1998. Massive attack on high-throughput biology. Nat. Genet. 20 5–6. [DOI] [PubMed] [Google Scholar]
- Contreras-Moreira, B., Fitzjohn, P.W., and Bates, P.A. 2003. In silico protein recombination: Enhancing template and sequence alignment selection for comparative protein modelling. J. Mol. Biol. 328 593–608. [DOI] [PubMed] [Google Scholar]
- Gerstein, M. 1998. Measurement of the effectiveness of transitive sequence comparison, through a third “intermediate” sequence. Bioinformatics 14 707–714. [DOI] [PubMed] [Google Scholar]
- Gerstein, M. and Levitt, M. 1998. Comprehensive assessment of automatic structural alignment against a manual standard, the scop classification of proteins. Protein Sci. 7 445–456. [DOI] [PMC free article] [PubMed] [Google Scholar]
- Goodrich, M.T. and Tamassia, R. 2002. Algorithm design foundations, analysis, and internet examples. Wiley, New York.
- Grunenfelder, B. and Winzeler, E.A. 2002. Treasures and traps in genome-wide data sets: Case examples from yeast. Nat. Rev. Genet. 3 653–661. [DOI] [PubMed] [Google Scholar]
- Guenther, B., Onrust, R., Sali, A., O’Donnell, M., and Kuriyan, J. 1997. Crystal structure of the delta′ subunit of the clamp-loader complex of E. coli DNA polymerase III. Cell 91 335–345. [DOI] [PubMed] [Google Scholar]
- Henikoff, S. and Henikoff, J.G. 1992. Amino acid substitution matrices from protein blocks. Proc. Natl. Acad. Sci. 89 10915–10919. [DOI] [PMC free article] [PubMed] [Google Scholar]
- John, B. and Sali, A. 2003. Comparative protein structure modeling by iterative alignment, model building and model assessment. Nucleic Acids Res. 31 3982–3992. [DOI] [PMC free article] [PubMed] [Google Scholar]
- Kann, M., Qian, B., and Goldstein, R.A. 2000. Optimization of a new score function for the detection of remote homologs. Proteins 41 498–503. [DOI] [PubMed] [Google Scholar]
- Li, W., Pio, F., Pawlowski, K., and Godzik, A. 2000. Saturated BLAST: An automated multiple intermediate sequence search used to detect distant homology. Bioinformatics 16 1105–1110. [DOI] [PubMed] [Google Scholar]
- Li, W., Jaroszewski, L., and Godzik, A. 2002. Sequence clustering strategies improve remote homology recognitions while reducing search times. Protein Eng. 15 643–649. [DOI] [PubMed] [Google Scholar]
- Lo, C.L., Ailey, B., Hubbard, T.J., Brenner, S.E., Murzin, A.G., and Chothia, C. 2000. SCOP: A structural classification of proteins database. Nucleic Acids Res. 28 257–259. [DOI] [PMC free article] [PubMed] [Google Scholar]
- Park, J., Teichmann, S.A., Hubbard, T., and Chothia, C. 1997. Intermediate sequences increase the detection of homology between sequences. J. Mol. Biol. 273 349–354. [DOI] [PubMed] [Google Scholar]
- Park, J., Karplus, K., Barrett, C., Hughey, R., Haussler, D., Hubbard, T., and Chothia, C. 1998. Sequence comparisons using multiple sequences detect three times as many remote homologues as pairwise methods. J. Mol. Biol. 284 1201–1210. [DOI] [PubMed] [Google Scholar]
- Pearson, W.R. 1990. Rapid and sensitive sequence comparison with FASTP and FASTA. Methods Enzymol. 183 63–98. [DOI] [PubMed] [Google Scholar]
- Pennisi, E. 2003. Human genome. A low number wins the GeneSweep Pool. Science 300 1484. [DOI] [PubMed] [Google Scholar]
- Pieper, U., Eswar, N., Ilyin, V.A., Stuart, A., and Sali, A. 2002. ModBase, a database of annotated comparative protein structure models. Nucleic Acids Res. 30 255–259. [DOI] [PMC free article] [PubMed] [Google Scholar]
- Pipenbacher, P., Schliep, A., Schneckener, S., Schonhuth, A., Schomburg, D., and Schrader, R. 2002. ProClust: Improved clustering of protein sequences with an extended graph-based approach. Bioinformatics 2 182–191. [DOI] [PubMed] [Google Scholar]
- Salamov, A.A., Suwa, M., Orengo, C.A., and Swindells, M.B. 1999. Combining sensitive database searches with multiple intermediates to detect distant homologues. Protein Eng. 12 95–100. [DOI] [PubMed] [Google Scholar]
- Sali, A. 1998. 100,000 protein structures for the biologist. Nat. Struct. Biol. 5 1029–1032. [DOI] [PubMed] [Google Scholar]
- Sali, A. and Blundell, T.L. 1993. Comparative protein modelling by satisfaction of spatial restraints. J. Mol. Biol. 234 779–815. [DOI] [PubMed] [Google Scholar]
- Sanchez, R. and Sali, A. 1997. Advances in comparative protein-structure modelling. Curr. Opin. Struct. Biol 7 206–214. [DOI] [PubMed] [Google Scholar]
- ——— 1998. Large-scale protein structure modeling of the Saccharomyces cerevisiae genome. Proc. Natl. Acad. Sci. 95 13597–13602. [DOI] [PMC free article] [PubMed] [Google Scholar]
- ——— 2000. Comparative protein structure modeling. Introduction and practical examples with modeller. Methods Mol. Biol. 143 97–129. [DOI] [PubMed] [Google Scholar]
- Saqi, M.A., Bates, P.A., and Sternberg, M.J. 1992. Towards an automatic method of predicting protein structure by homology: An evaluation of suboptimal sequence alignments. Protein Eng. 5 305–311. [DOI] [PubMed] [Google Scholar]
- Serres, M.H., Gopal, S., Nahum, L.A., Liang, P., Gaasterland, T., and Riley, M. 2001. A functional update of the Escherichia coli K-12 genome. Genome Biol. 2 RESEARCH0035. [DOI] [PMC free article] [PubMed]
- Sippl, M.J., Lackner, P., Domingues, F.S., Prlic, A., Malik, R., Andreeva, A., and Wiederstein, M. 2001. Assessment of the CASP4 fold recognition category. Proteins 5 55–67. [DOI] [PubMed] [Google Scholar]
- Teichmann, S.A., Chothia, C., Church, G.M., and Park, J. 2000. Fast assignment of protein structures to sequences using the intermediate sequence library PDB-ISL. Bioinformatics 16 117–124. [DOI] [PubMed] [Google Scholar]
- Terwilliger, T.C. 2000. Structural genomics in North America. Nat. Struct. Biol. 7 935–939. [DOI] [PubMed] [Google Scholar]
- Theodoridis, S. and Koutroumbos, K. 1999. Pattern recognition, pp. 149–150. Academic Press, San Diego, CA.
- Vitkup, D., Melamud, E., Moult, J., and Sander, C. 2001. Completeness in structural genomics. Nat. Struct. Biol. 8 559–566. [DOI] [PubMed] [Google Scholar]