

Abstract
Unfolded states of ribonuclease A were used to investigate the effects of macromolecular crowding on macromolecular compactness and protein folding. The extent of protein folding and compactness were measured by circular dichroism spectroscopy, fluorescence correlation spectroscopy, and NMR spectroscopy in the presence of polyethylene glycol (PEG) or Ficoll as the crowding agent. The unfolded state of RNase A in a 2.4 M urea solution at pH 3.0 became native in conformation and compactness by the addition of 35% PEG 20000 or Ficoll 70. In addition, the effects of macromolecular crowding on inert macromolecule compactness were investigated by fluorescence correlation spectroscopy using Fluorescence-labeled PEG as a test macromolecule. The size of Fluorescence-labeled PEG decreased remarkably with an increase in the concentration of PEG 20000 or Ficoll 70. These results show that macromolecules are favored compact conformations in the presence of a high concentration of macromolecules and indicate the importance of a crowded environment for the folding and stabilization of globular proteins. Furthermore, the magnitude of the effects on macromolecular crowding by the different sizes of background molecules was investigated. RNase A and Fluorescence-labeled PEG did not become compact, and had folded conformation by the addition of PEG 200. The effect of the chemical potential on the compaction of a test molecule in relation to the relative sizes of the test and background molecules is also discussed.
Keywords: protein folding, macromolecular crowding, macromolecular compaction, ribonuclease A, polyethylene glycol, circular dichroism, fluorescence correlation spectroscopy, NMR spectroscopy
Understanding the structure and function of proteins in vivo by analyzing proteins in a “dilute solution” under in vitro conditions is one approach, but another is to perform analyses under mimetic conditions of an intracellular milieu. Consideration of the protein behavior in their intracellular milieu has become a necessity due to the demands of advances in medical therapy. Misfolding and aggregation of proteins have been associated with several neurodegenerative diseases (Apetri and Surewicz 2002; Li et al. 2002; Ma et al. 2002), and observing these proteins in their natural environment could help to clarify this relationship. Physiological media in living cells are “crowded” due to the high total concentration of macromolecules (Zimmerman and Minton 1993; Minton 2000b, 2001) occupying a substantial fraction of the intracellular space (~40%). The excluded volume theory predicts that at a high level of “background” macromolecular fractional volume occupancy, and the reactivity of almost every soluble “test” macromolecular species, dilute as well as concentrated, will depend sensitively upon its available volume, which in turn, depends sensitively upon the total volume fraction of “background” macromolecules. It follows that relatively small changes in the fractional volume occupancy of the “background” macromolecules are expected to have major effects on the equilibria and kinetics of a broad variety of intracellular reactions related to the “test” macromolecules (Minton 2001).
The effect of macromolecular crowding, in particular on proteins in vivo with regard to folding and denaturation, has gained much attention as biomedical treatment advances, considering that almost all knowledge gained to date has been from in vitro studies. The exclusion volume effects were predicted to favor the formation of macromolecular complexes and the adoption of compact as opposed to expanded macromolecular conformaitons, resulting in a reduction of total exluded volume (Minton 1981, 2000a; Zimmerman and Minton 1993). In particular, macromolecular crowding stabilizes a compact native state relative to a much less compact unfolded state. Nevertheless, experimental evidence has either indirectly supported or contradicted this prediction. van den Berg et al. showed that high concentrations of crowding agents (200 g/L) had no effect on the refolding of oxidized lysozyme but disrupted the refolding of reduced lysozyme and caused aggregation, which was prevented by the presence of a molecular chaperone (van den Berg et al. 1999, 2000). Recent reports showed that the ability of dihydrofolate reductase, enolase, and green fluorescent protein to fold spontaneously in dilute solutions was lost in a crowded environment (Martin 2002). Flaugh and Lumb (2001) showed that macromolecular crowding does not induce any significant conformational change in the intrinsically disordered C-terminal activation domain of c-Fos or in the kinase inhibition domain of p27Kip1 proteins. On the contrary, van den Berg et al. also showed that, in the presence of appropriate concentrations of crowding agents, the rate of correct refolding of reduced lysozyme can be increased up to fivefold compared with the rate in uncrowded buffers (van den Berg et al. 2000). In addition, macromolecular crowding agents are effective to some extent in promoting folding of the intrinsically unstructured reduced and carboxyamidated RNase T1 (Qu and Bolen 2002) and of acid-unfolded cytchrome c (Sasahara et al. 2003). Vasilevskaya et al. (1995) showed that the coil-globule transition of a DNA molecule was largely dependent on the concentration of the crowding agents. The excluded volume effect has been vividly observed in accelerating fibrillation of a natively unfolded protein α-synuclein (Uversky et al. 2002) and human apolipoprotein (Hatters et al. 2002), which are pathological hallmarks of age-related neurodegenerative diseases.
In this study, we attempted to explore the importance of macromolecular crowding on protein folding by taking into consideration the critical factors involved. The actual macromolecular crowding effects operate in the intercellular milieu, together with various other factors such as redox reagents, salts, molecular chaperones, and so on. To investigate the crowding effects in a simple system while isolated from other effects, we constructed the following model system. Ribonuclease A (RNase A) was used as the model macromolecule. RNase A has four disulfide bonds and shows good reversibility and high stability in the oxidized condition, making it suitable for our study. PEG, at different molecular weights, or Ficoll, was used as the crowding agent. These polymers are highly water soluble and noncharged inert macromolecules that have been used to investigate the effects of macromolecular crowding (Ellis 2001). Folding and compaction of the protein were analyzed by circular dichroism (CD) spectroscopy, fluorescence correlation spectroscopy (FCS), and NMR spectroscopy. There are roughly consistent results between the theoretical and experimental evidence with regard to the effects of the molecular size of the crowding agents. Accordingly, we investigated the magnitude of crowding effects caused by PEG of different molecular weights (20 kD and 0.2 kD) as background molecules. We discussed these effects to compare the available volumes of native and denature states for testing the protein. Because our experimental system is a simple model for investigating the crowding effects in isolation from the other factors in an intracellular milieu, we assume that the observed effects also work in the intracellular milieu together with the other factors.
Results and Discussion
CD spectra analysis of the folding of RNase A in the presence and absence of crowding agents
The transitions of RNase A in sodium citrate (pH 3.0) to the unfolded state and vice-versa under increasing concentration of urea were examined through the CD spectra, particularly at around 222 nm and 275 nm. Unfolding of RNase A, observed at 222 nm, began at a urea concentration of higher than 0.5 M, reached 75% at 2.4 M urea, and completed at concentrations higher than 3 M (Fig. 1 ▶). CD spectra at 275 nm gave the same pattern of the unfolding of the enzyme (data not shown). Considering that RNase A only starts to unfold under urea concentrations higher than 0.5 M, the conformation of the enzyme in solution containing 0.2 M urea was regarded as being in a native state. The effect of molecular crowding on the refolding of RNase A was observed when a known crowding agent, polyethylene glycol of about 20 kD (PEG 20000) or Ficoll 70 of about 70 kD, was added in increasing concentrations into RNase A solution containing 2.4 M urea, where 70% of the proteins in solution were in the unfolded state. The CD spectra of the protein solution in 2.4 M urea changed with the increase in the concentration of PEG 20000 and became very similar to that elicited by the native form of RNase A solution containing 0.2 M urea when PEG occupies 35% of the solution (Fig. 2 ▶), a condition similar to the cellular interior, which is 20%–30% volume-occupied by macromolecules (Zimmerman and Trach 1991; Ellis 2001). It was confirmed that addition of 35% PEG 20000 did not change the spectra of the folded state of the protein (data not shown). Ficoll had the same effect as PEG on the refolding of RNase A (Fig. 2 ▶). These results suggest that a crowding agent occupying a similar volume fraction to that of the macromolecules in the intracellular milieu drives the unfolded state of RNase toward its folded or compact structure.
Figure 1.

Transition of the native RNase A to the denatured state at 25°C and pH 3.0 in the presence of urea. Percentage of the folded proteins at the respective urea concentrations was expressed as a value of molar ellipticity [θ] at 222 of the CD spectra relative to that of the protein in buffer solution with 0.2 M urea, and it was calculated as (θx M urea − θ8 M urea)/(θ0.2 M urea − θ8 M urea) × 100. The radius of the protein was expressed relative to that of lysozyme and estimated from the diffusion time on FCS. RNase activity was expressed as a value of the residual enzyme activity in the respective urea concentrations relative to that of the enzyme in 0.2 M urea. Circles denote θ at 222 nm of the CD spectra, triangles denote relative radius, and squares denote relative activity of RNase A.
Figure 2.


Effect of PEG or Ficoll addition on the CD spectra of denatured RNase A. CD spectra of the protein were measured at 25°C in 50 mM sodium citrate (pH 3.0), containing 0.2 M or 2.4 M of urea with or without 35% PEG of different molecular weights or Ficoll. (A) CD spectra in the far-UV region of RNase A (37 μM); (B) CD spectra in the near-UV region of RNase A (120 μM); (C, D) ellipticity at 222 nm and 275 nm, respectively, of the enzyme in buffer containing 0.2 M or 2.4 M urea at the indicated concentrations of the crowding agent. For A and B, 1, 0.2 M urea; 2, 2.4 M urea; 3, 2.4 M urea and 35% PEG 200; 4, 2.4 M urea and 35% PEG 20000; 5, 2.4 M urea and 35% Ficoll 70. For C and D, filled diamonds denote values obtained with 0.2 M urea without the crowding agent; circles denote values obtained in the presence of PEG 200; squares denote values obtained in the presence of PEG 20000; triangles denote values obtained in the presence of Ficoll 70.
Compaction of RNase A by macromolecular crowding
We examined whether the crowding effect caused by PEG or Ficoll brought about the process of compaction instead of aggregation. This evaluation was based on the changes in the molecular size of the enzyme as reflected by their diffusion time measured by fluorescence correlation spectroscopy (FCS; Leng et al. 2001). The viscosity of the solution due to the presence of urea and a crowding agent was expressed by the value of the diffusion time of RNase A relative to that of lysozyme. It was assumed that the molecular size of lysozyme does not change despite the presence of 2.4 M urea with and without PEG 20000, because the CD spectra indicated that the native form of lysozyme in sodium citrate was not affected by the presence of the two solutes (data not shown). The molecular size or compactness of RNase A, estimated from the relative diffusion time, increases as it unfolds with an increase in the urea concentration from 0.2 M to 3.0 M (Fig. 1 ▶), while it reduces to a size approaching that of the native form with an increase in the concentration of added PEG 20000 or Ficoll (Fig. 3 ▶). When PEG 20000 or Ficoll occupied 35% of the solution, RNase A acquired a similar molecular size (Fig. 3 ▶) and structure (Fig. 2 ▶) to those of the native enzyme. On the other hand, when PEG or Ficoll was added to the solution where the enzyme is at its folded state, no significant change in the molecular size of RNase A was observed (Fig. 3 ▶). These results suggest that the addition of the background macromolecules drives the denatured RNase A to refold into a compact size similar to the native state without aggregation, supporting the theoretical prediction that at a high concentration of background macromolecules, the mean size of an unfolded polypeptide will decrease and ultimately shift the equilibrium between the native and denatured states substantially toward a more compact conformation of the native state (Minton 1981, 2000a).
Figure 3.


Effect of PEG or Ficoll on the relative radii of the native and denatured RNase A in 50 mM citrate containing 0.2 M urea (A) and 2.4 M urea (B) at pH 3.0 and 25°C. The relative radii of the proteins were estimated as in Figure 1 ▶. Circles denote samples with PEG 200; squares denote samples with PEG 20000; triangles denote samples with Ficoll 70.
Effect of macromolecular crowding on the RNase A activity
Another criterion used to determine whether RNase A has refolded to its native state is the enzyme activity. One might argue that the activity of the native enzyme at pH 3.0, a condition of the RNase A used in this experimental study, is only about 1% of that at pH 7.5, and that the refolded enzyme is in a solution containing 2.4 M urea. However, the sensitivity of the enzyme assay system showed that the activity at pH 3.0 is above the lower detection limit, and the activity is expressed relative to the enzyme in solution containing 0.2 M urea with or without the crowding agent, in which the enzyme is in its native state. Therefore, if addition of the crowding agent had driven the denatured enzyme to refold to a native-like structure, the relative activity should have increased. As expected, the activity decreased with the increase in the urea concentration, and the value at 2.4 M urea was about 5% of that at 0.2 M urea (Fig. 1 ▶). The addition of 30% PEG 20000 actually resulted in an increase of the relative activity to about 25% (Fig. 4 ▶), indicating a recovery of the enzyme activity with the addition of PEG. The incomplete recovery of the activity may reflect the fact that although the enzyme had refolded to a structure similar to the native one, there is some difference between the two. In addition, we cannot deny the possibility that the relatively high concentration of urea in the solution has an inhibitory effect on the enzyme reaction.
Figure 4.

Effect of PEG on RNase A activity. The activity of RNase A in 50 mM citrate containing 2.4 M urea was measured as described in Materials and Methods. Circles denote enzyme activity in the presence of PEG 200; squares denote enzyme activity in the presence of PEG 20000.
NMR spectra analysis of the refolding of RNase A by the addition of PEG
Further evidence for the refolding of the denatured RNase A was obtained from 1D 1H NMR spectra analysis. The 1H NMR spectrum of the native RNase A exhibits the spectral characteristic of a folded structure, including good dispersion in the downfield amide proton region (Fig. 5 ▶). In contrast, the spectrum of the RNase A containing 2.4 M urea as the denaturant exhibits poor dispersion in both the upfield and downfield regions, consistent with a typically unfolded protein structure (Fig. 5 ▶). Addition of 30% PEG 20000 to the unfolded-state RNase A containing 2.4 M urea is accompanied by an increase in the chemical shift dispersion in the downfield region with boarding (Fig. 5 ▶). Although the spectrum is different from that of the native enzyme in pure water, it is very similar to the spectrum of the native enzyme containing 0.2 M urea in the presence of 30% PEG 20000. Because the addition of 35% PEG 20000 did not change the CD spectrum of the native enzyme, the change in the NMR spectra of the native enzyme observed by the addition of PEG does not imply any significant change in the folded structure of the enzyme. Therefore, the results of the NMR analysis, together with those of the CD spectra analysis and enzyme activity, indicate that the addition of the background macromolecules has driven the unfolded RNase A toward a folded structure similar to its native state.
Figure 5.


1H NMR Spectra of the native and denatured RNase A (2 mg/mL, Solvent: H2O: D2O = 4:1) containing 0.2 M urea (A), 2.4 M urea (B), 0.2 M urea and 30% PEG 20000 (C), and 2.4 M urea and 30% PEG 20000 (D) at pH 3 and 25°C.
Influence of the size of a background molecule
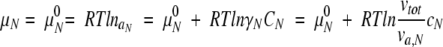
The influence of a background molecule’s size on the magnitude of the excluded volume of a test molecule requires further scrutiny because the theoretical and experimental studies do not seem to be clearly consistent. In the excluded volume theory, the chemical potential (μ) of a test molecule is calculated by considering the available volume of the test molecule (va,T) (Minton 2001).
 |
where μT0 is the standard state of the chemical potential of the test molecule, and aT is an effective concentration considered to indicate thermodynamic activity. γT and cT are the apparent activity coefficient and concentration of the test molecule, respectively. vtot and va,T denote the total volume and volume available to the test molecule, respectively. Simply put, the chemical potential of a test molecule depends on the volume available to the test molecule in the solution. This theory predicts that the chemical potential (μ) of a test molecule increases with a decrease in the size of the background macromolecule while maintaining the total volume of the background molecule. This is because the available volume (va,T) of the test molecule decreases with a decrease in the size of the background macromolecule. Therefore, the crowding effect increases sharply with a decrease in the size of the background macromolecule while keeping the volume fraction constant (Minton 1981). On the other hand, experiments done on T4 DNA molecules revealed an inverse relationship, where crowding agent PEG with a higher degree of polymerization had a larger effect on the contraction of target T4 DNA molecules from the coil to the globular state (Vasilevskaya et al. 1995). To clarify this issue, we also used PEG with molecular weight of 0.2 kD (PEG 200) in all of the experiments described above. PEG 200 is much smaller than RNase A (13 kD). The results showed that PEG 200 as the crowding agent did not significantly drive the refolding of the denatured RNase A (Fig. 2 ▶). Here, size made minimal difference even when the concentration of PEG 200 was increased (Fig. 3 ▶). Consequently, these results imply that a small background macromolecule has a negligible crowding effect, a finding that does not seem consistent with the excluded volume theory.
Here we explain why the effect of crowding on macromolecular compaction by a small-sized background molecule could not be clearly observed. Consider a solution containing a test protein with a low molecular concentration together with a single inert background molecule. The test protein is simply assumed to be a reversible transition between a compact folded or native (N) state and an extended unfolded or denatured (D) state. When we analyze the crowding effects on macromolecular compactness, the difference between the chemical potentials of the compact and extended states must be considered. The chemical potentials of the N and D states at the equilibrium state are given, respectively, by
 |
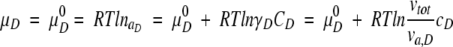 |
The equilibrium constant between native and denatured states is given by
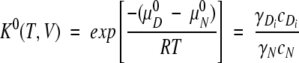 |
The ratio between the concentration of the N state and that of the D state at the equilibrium is defined as the apparent equilibrium constant, which is given by
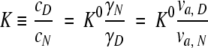 |
The ratio between the available volumes of the N and D states is important to estimate the equilibrium between native and denatured states of a test protein independently of the magnitude of the chemical potential of the test protein’s N and D states. When the fraction of the background molecule is above 30%, the sizes of the average interspaces between the background molecules are on the same order of the size of the background molecules, and the spaces in which the test protein can exist are those larger than the volume of the test protein. Consequently, macromolecular crowding strongly relies on the size of the test and background molecules. When the size of the background molecule approaches that of the test molecule while keeping its volume fraction in the system constant (30%), the interspaces of the background molecules are comparable with the size of the test protein. Therefore, there are many compact spaces where the native state of the test protein could exist but the extended denatured state of the protein could not exist. As one result, the available volume of the N state is much larger than that of the D state. Thus, the apparent equilibrium constant (K) becomes smaller, and the compact native state is favored. When the size of the background molecule becomes much larger than the test molecule while keeping its volume fraction in the system constant (30%), the size of the average interspaces between the background molecules is much larger than the test protein, so the N and D states of the test protein could nearly exist within all of the interspaces between the background molecules. The available volumes of N and D states are nearly equal to the maximum available volume (70%), and the ratio between the available volumes of the N and D states becomes close to 1. Therefore, the apparent equilibrium (K) is the same as that without a crowding agent, and thus the effect of macromolecular crowding cannot be observed clearly. When the size of the background molecule becomes much smaller than that of the test molecule, the size of the average interspaces between the background molecules is much smaller than the minimum size that the test molecule could have. The available volumes of the N and D states are extremely small, and these states of the test protein cannot exist at nearly all interspaces between the background molecules. Therefore, the available volumes of the N and D states are not so different, although their chemical potential states are extremely high. As such, the apparent equilibrium constant (K) only slightly changes compared to the absence of the background molecule, and the compact native state of the protein is not especially favored. Thus, the effect of macromolecular crowding cannot be observed clearly. Generally speaking, although there is no relation to the size of the background molecule, the available volume of the N state is always smaller than that of the D state. However, the ratio of the available volume of the N state and that of the D state could be changed, depending on the size of the background molecule. As explained above, when the size of the background molecule is similar to that of the test molecule, the ratio of the available volume of the N state and that of the D state is largest to a great extent. Accordingly, the maximum effect of crowding would be observed if the size of the background molecule is similar to that of the test molecule.
Compaction of PEG brought about by macromolecular crowding
Although the above experiments were able to provide evidence for the importance of the crowding effect to the compaction of the macromolecule, the use of protein as the test molecule may still leave some uncertainties, because protein is complex by nature. Proteins have a compact native state that is stable in terms of enthalpy. It is also known that proteins are stabilized by high concentrations of substances that are not macromolecules but small molecules such as salts and some organics. This is explained in terms of preferential hydration. Experimentally observing only the effect of macromolecular crowding in isolation from other effects such as preferential hydration is impossible, so it is necessary to establish a simpler system to observe crowding effects. To provide more explicit evidence, the experiment was simplified by using an inert macromolecule, a fluorescent-labeled PEG 11700, as the test molecule, keeping all other conditions the same as those for the experiments done with RNase A. PEG is a highly water-soluble and flexible polymer that has no stable compact state in terms of enthalpy; therefore, we can observe the effect of macromolecular crowding on macromolecular compactness more directly. The change in the size of the test molecule was examined by FCS measurements while increasing the amount of each of the crowding agents: PEG 200, PEG 20000, and Ficoll 70. Clearly, PEG 200 had no effect, despite the increase in concentration, while the diffusion time of the fluorescent-labeled PEG 11700 relative to that of lysozyme markedly decreased when PEG 20000 or Ficoll was increased, indicating that the size of the test molecule decreases with an increase in the concentration of the crowding agents with a similar size to the test molecule (Fig. 6 ▶). These results provide a clear indication of the crowding effects forcing macromolecules into a compact state and the effect of the size of background molecules on the compaction of the test macromolecules.
Figure 6.

Effect of PEG or Ficoll on the relative radius of Alexa-labeled amino-PEG 11700 in 50 mM citrate containing 0.2 M urea at pH 3.0 and 25°C. The relative radius of amino-PEG was estimated as in Figure 1 ▶. Circles denote samples with PEG 200; squares denote samples with PEG 20000; triangles denote samples with Ficoll 70.
Conclusions
In this article, we have provided experimental evidence of the importance of macromolecular crowding in the compaction and folding of protein molecules by using a simple model system. The effects of macromolecular crowding were clearly observed with a background molecule having a similar size to the protein molecule tested when the volume fraction of the background molecule is comparable to that of the macromolecules in the intracellular milieu. The analysis of the phenomena in the presence of urea could have accounted for the significant results of this study, in contrast to other related studies that reported minimal effect (Qu and Bolen 2002) or no effect (Flaugh and Lumb 2001) of macromolecular crowding or difficulties in providing experimental evidence due to extensive aggregation (van den Berg et al. 1999, 2000) or misfolding (Martin 2002). Our experimental results were obtained using a simple model system for investigating the crowding effects in isolation from other factors in the intracellular milieu. In vivo, the crowding effects work together with the other factors. Hence, our results suggest that the compact folded native states of globular proteins in vivo are favored, considering that the intracellular milieu is crowded in nature and is assisted by molecular chaperones, which have been proposed as playing an essential role in the process of protein folding under crowded conditions (van den Berg et al. 1999; Ellis 2001; Martin 2002).
Materials and methods
Materials
Bovine pancreas ribonucleaseA (type X-A), chicken egg white lysozyme, and Ficoll 70 (type 70) were purchased from Sigma. PEG 200 and PEG 20000 were purchased from Wako. Amino-PEG 11700 was purchased from Shearwater Polymers, Inc.
Preparation of protein samples
Proteins were dissolved in 50 mM sodium citrate (pH 3.0) containing 8 M urea and dialyzed with the same buffer at room temperature for more than 12 h to eliminate any possible contaminating particles. The dialyzed protein solution in 8 M urea was used as the stock solution for the preparation of protein solutions with varying urea concentration. The concentrations of the proteins in all samples were ensured to be the same before subjecting the samples to analysis.
Circular dichroism (CD) measurements
CD spectra in the far-UV and near-UV regions were recorded at 25°C on a Jasco J-720WI spectropolarimeter. The spectra were scanned eight times at a scan rate of 20 nm/min, using a 1-sec time constant and a spectral bandwidth of 1 nm. The light pass length of the cell used was 1 mm for far-UV and 10 mm for near-UV. The results were expressed as the mean residue ellipticity, [θ], which was calculated by using the relation
 |
where Mo is the mean residual molar mass, [θλ] is the measured ellipticity in degrees, c is the concentration in grams per milliliter, and l is the path length in decimeters. The value of Mo was obtained by dividing the molecular weight by the number of aminoacid residues in the protein. The numbers of amino acid residues of RNase A and lysozyme were 124 and 129, respectively.
Labeling of proteins for fluorescence correlation spectroscopy (FCS)
Proteins and amino-PEG 11700 were first dialyzed in 100 mM potassium phosphate (pH 7.0) for 12 h at 4°C prior to labeling. To each dialyzed sample, an equimolar Alexa Fluor 488 carboxylic acid succinimidyl ester (Molecular Probes) was added. The reaction was carried out at 37°C for 1 h and quenched by the addition of 1 M Tris-HCl (pH 9.0). Subsequently, any free Alexa Fluor 488 was removed by passing the solution three times through a Sephadex G-25 column (15 × 120 mm) equilibrated with 50 mM citrate buffer (pH 3.0) containing 8 M urea.
FCS measurement and data analysis
FCS measurements were carried out with a ConforCor spectrometer (Pack et al. 1999; Carl Zeiss, Jena GmbH). Samples were excited with a sharply focused laser beam at 488 nm with a power of 0.0121 mW. The pinhole diameter of the image plane was adjusted to 30 μm. The diffusion time of each sample was measured at 25°C on a Lab-Tek chambered cover glass (Nalge Nunc International). To prevent nonspecific adsorption of proteins on the surface of the cover glass, the sample chamber was first blocked with an unlabeled 1% solution of the protein to be analyzed. Blocking was carried out overnight at 4°C, after which the chamber was washed with distilled water two to three times and dried for 1 h at room temperature. Into the dried chamber was added 200 μL of a protein sample, and the sample was analyzed by FCS.
In an FCS experiment, temporal fluctuations in the fluorescence emission were utilized to obtain information on molecular dynamics or molecular motions occurring at the microsecond-to-second time scale. The mobility of a molecule was accessed by the time-dependent fluorescence fluctuation. The fluctuations of the emitted intensity, δI, around its mean value ≤I> were measured and subjected to autocorrelation analysis that applied the definition of the autocorrelation function, G(τ):
 |
where the brackets indicate the time average, and δI(t) = I(t) − ≤I(t)> denotes the fluctuations around the mean intensity, ≤I(t)>. Calculations of the autocorrelation curves were performed on-line by FCS Access Fit software (EVOTEC BioSystems GmbH), with subsequent display of the resulting fluorescence autocorrelation curve. Because each FCS run engaged the diffusion of one fluorescent species in a three-dimensional Gaussian beam, the fluorescence autocorrelation curve was fitted by a nonlinear least-squares method adapting the one-component diffusion model to the correlation function
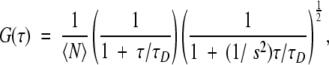 |
where N is the number of fluorescent molecules in the detection volume element, τD the diffusion time, that is, the average lateral transit time of the particles through the focus, and s the structure parameter that characterizes the shape of the ellipsoidal detection volume (quotient of axial and lateral radius, s = z/w). The diffusion time relates to the diffusion coefficient by
 |
where D is the translational diffusion coefficient of the fluorescent species. The structure parameter s and the radius w were then determined from simple calibration measurements using standard rhodamine 6G with diffusion time and diffusion coefficient of 2.8 × 10⁻¹⁰ m2sec−1, as obtained by the one-component fit of the measured fluorescence autocorrelation function. Consequently, the values of s and the detection volume were estimated to be about 5–10 and 0.4–0.6 fl, respectively. Each sample was measured in triplicate, and each experiment was carried out twice.
The hydrodynamic radius of molecules was estimated with the Stokes-Einstein relationships
 |
where r is the hydrodynamic radius of the diffusing molecule, k is the Boltzmann constant, T is the absolute temperature, and η is the viscosity of the solvent. Substituting equation 3 transforms equation 4 to:
 |
The radius of the molecule is expressed as a relative value to that of the standard lysozyme, which is assumed to have the same diffusion time whether in the presence or absence of urea and/or crowding agent, as discussed in the text.
RNase activity
The enzyme activity of RNase A was measured with the RNaseAlert Kit (Ambion, Inc.). The RNaseAlert kit employed a RNA substrate tagged with a fluorescent reporter molecule (fluor), which emits a green fluorescence if cleaved by RNase. The rate of fluorescence increase is proportional to the amount and activity of RNase in solution. The reaction mixture (40 μL) containing the enzyme sample and 20 pmole of substrate was kept at 25°C for 1 h. The reaction was quenched subsequently by shifting the mixture to pH 7.0 with the addition of 60 μL of 1 U ribonuclease inhibitor (Wako Pure Chemical Industries, Ltd.) in 500 mM potassium phosphate (pH 7.0). RNase activity was detected by the fluorescence emission of the solution at 520 nm (excitation at 488 nm) using the ABI PRISM 7700 Sequence Detector (PE Applied Biosystems).
NMR measurement
All spectra were recorded at 25°C on a 500-MHz spectrometer (Brucker DRX 500). We used presaturation to eliminate the water signal and Watergate to eliminate the PEG signal. The sample conditions were 2 mg/mL in 90% (v/v) H2O, 10% (v/v) H2O. The pH protein solution was adjusted to 3.0 by adding small amounts of sodium hydroxide. A filed frequency lock was referenced to the signal from H2O.
Acknowledgments
We thank Dr. Katsuhide Yutani and Dr. Kyoko Ogasahara of the Institute for Protein Research, Osaka University, for experimental guidance and discussions on the protein analysis using the CD spectroscopy. This work was supported in part by Grant 11CE2006 and a grant from The 21st Century Center of Excellence Program of the Ministry of Education, Science, Sports and Culture, Japan, and by a grant from the Rice Genome Project PR-2103, MAFF, Japan.
The publication costs of this article were defrayed in part by payment of page charges. This article must therefore be hereby marked “advertisement” in accordance with 18 USC section 1734 solely to indicate this fact.
Article and publication are at http://www.proteinscience.org/cgi/doi/10.1110/ps.03288104.
References
- Apetri, A.C. and Surewicz, W.K. 2002. Kinetic intermediate in the folding of human prion protein. J. Biol. Chem. 277 44589–44592. [DOI] [PubMed] [Google Scholar]
- Ellis, R.J. 2001. Macromolecular crowding: Obvious but underappreciated. Trends Biochem. Sci. 26 597–604. [DOI] [PubMed] [Google Scholar]
- Flaugh, S.L. and Lumb, K.J. 2001. Effects of macromolecular crowding on the intrinsically disordered proteins c-Fos and p27(Kip1). Biomacromolecules 2 538–540. [DOI] [PubMed] [Google Scholar]
- Hatters, D.M., Minton, A.P., and Howlett, G.J. 2002. Macromolecular crowding accelerates amyloid formation by human apolipoprotein C-II. J. Biol. Chem. 277 7824–7830. [DOI] [PubMed] [Google Scholar]
- Leng, X., Starchev, K., and Buffle, J. 2001. Applications of fluorescence correlation spectroscopy: Measurement of size–mass relationship of native and denatured schizophyllan. Biopolymers 59 290–299. [DOI] [PubMed] [Google Scholar]
- Li, J., Uversky, V.N., and Fink, A.L. 2002. Conformational behavior of human α-synuclein is modulated by familial Parkinson’s disease point mutations A30P and A53T. Neurotoxicology 23 553–567. [DOI] [PubMed] [Google Scholar]
- Ma, J., Wollmann, R., and Lindquist, S. 2002. Neurotoxicity and neurodegeneration when PrP accumulates in the cytosol. Science 298 1781–1785. [DOI] [PubMed] [Google Scholar]
- Martin, J. 2002. Requirement for GroEL/GroES-dependent protein folding under nonpermissive conditions of macromolecular crowding. Biochemistry 41 5050–5055. [DOI] [PubMed] [Google Scholar]
- Minton, A.P. 1981. Excluded volume as a determinant of macromolecular structure and reactivity. Biopolymers 20 2093–2120. [Google Scholar]
- ———. 2000a. Effect of a concentrated “inert” macromolecular cosolute on the stability of a globular protein with respect to denaturation by heat and by chaotropes: A statistical-thermodynamic model. Biophys. J. 78 101–109. [DOI] [PMC free article] [PubMed] [Google Scholar]
- ———. 2000b. Implications of macromolecular crowding for protein assembly. Curr. Opin. Struct. Biol. 10 34–39. [DOI] [PubMed] [Google Scholar]
- ———. 2001. The influence of macromolecular crowding and macromolecular confinement on biochemical reactions in physiological media. J. Biol. Chem. 276 10577–10580. [DOI] [PubMed] [Google Scholar]
- Pack, C.G., Nishimura, G., Tamura, M., Aoki, K., Taguchi, H., Yoshida, M. and Kinjo, M. 1999. Analysis of interaction between chaperonin GroEL and its substrate using fluorescence correlation spectroscopy. Cytometry 36 247–253. [DOI] [PubMed] [Google Scholar]
- Qu, Y. and Bolen, D.W. 2002. Efficacy of macromolecular crowding in forcing proteins to fold. Biophys. Chem. 101–102 155–165. [DOI] [PubMed] [Google Scholar]
- Sasahara, K., McPhie, P., and Minton, A.P. 2003. Effect of dextran on protein stability and conformation attributed to macromolecular crowding. J. Mol. Biol. 326 1227–1237. [DOI] [PubMed] [Google Scholar]
- Uversky, V.N., M Cooper, E., Bower, K.S., Li, J., and Fink, A.L. 2002. Accelerated α-synuclein fibrillation in crowded milieu. FEBS Lett. 515 99–103. [DOI] [PubMed] [Google Scholar]
- van den Berg, B., Ellis, R.J., and Dobson, C.M. 1999. Effects of macromolecular crowding on protein folding and aggregation. EMBO J. 18 6927–6933. [DOI] [PMC free article] [PubMed] [Google Scholar]
- van den Berg, B., Wain, R., Dobson, C.M., and Ellis, R.J. 2000. Macromolecular crowding perturbs protein refolding kinetics: Implications for folding inside the cell. EMBO J. 19 3870–3875. [DOI] [PMC free article] [PubMed] [Google Scholar]
- Vasilevskaya, V.V., Khokhlov, A.R., Matsuzawa, Y., and Yoshikawa, K. 1995. Collapse of single DNA molecule in poly(ethylene glycol) solutions. J. Chem. Phys. 102 6595–6602. [Google Scholar]
- Zimmerman, S.B. and Minton, A.P. 1993. Macromolecular crowding: Biochemical, biophysical, and physiological consequences. Annu. Rev. Biophys. Biomol. Struct. 22 27–65. [DOI] [PubMed] [Google Scholar]
- Zimmerman, S.B. and Trach, S.O. 1991. Estimation of macromolecule concentrations and excluded volume effects for the cytoplasm of Escherichia coli. J. Mol. Biol. 222 599–620. [DOI] [PubMed] [Google Scholar]