

Abstract
Olfactory receptors (ORs) are a large family of proteins involved in the recognition and discrimination of numerous odorants. These receptors belong to the G-protein coupled receptor (GPCR) hyperfamily, for which little structural data are available. In this study we predict the binding site residues of OR proteins by analyzing a set of 1441 OR protein sequences from mouse and human. The central insight utilized is that functional contact residues would be conserved among pairs of orthologous receptors, but considerably less conserved among paralogous pairs. Using judiciously selected subsets of 218 ortholog pairs and 518 paralog pairs, we have identified 22 sequence positions that are both highly conserved among the putative orthologs and variable among paralogs. These residues are disposed on transmembrane helices 2 to 7, and on the second extracellular loop of the receptor. Strikingly, although the prediction makes no assumption about the location of the binding site, these amino acid positions are clustered around a pocket in a structural homology model of ORs, mostly facing the inner lumen. We propose that the identified positions constitute the odorant binding site. This conclusion is supported by the observation that all but one of the predicted binding site residues correspond to ligand-contact positions in other rhodopsin-like GPCRs.
Keywords: orthologs, paralogs, G-protein coupled receptors, homology modeling
Olfaction, the sense of smell, is a versatile mechanism for detecting odorous molecules. The initial step of the olfactory biochemical cascade is the interaction of an odorant with an olfactory receptor (OR) protein, embedded in the ciliary membrane of olfactory sensory neurons. ORs constitute the largest mammalian gene superfamily, including more than 1000 genes and pseudogenes (Fuchs et al. 2001; Glusman et al. 2001; Young et al. 2002; Zhang and Firestein 2002). ORs are members of the hyperfamily of G-protein coupled receptors (GPCRs; http://www.gpcr.org/7tm/seq/001_005/001_005.html), and more specifically are rhodopsin-like GPCRs, integral membrane proteins with seven helical transmembrane (TM) domains and an extracellular N terminus.
A large majority of ORs are semiorphan receptors, meaning that although they are known to bind odorants, the specificity of each receptor for target ligands is not available in most cases. This is largely due to the relative difficulty in functional expression of these proteins in heterologous expression systems (Gimelbrant et al. 1999). Also, to date, no experimentally determined structure of an OR protein exists in the literature. Consequently, relatively little is known about protein structural attributes of ligand recognition in ORs.
The sequencing of the first OR proteins revealed that TM helices 3 to 6 were more variable between paralogs, relative to the rest of the protein (Buck et al. 1991). Based on the notion that in a large protein repertoire, geared to recognize thousands of ligands, contact positions would show pronounced variability between paralogs (Wu and Kabat 1970), these segments were hypothesized to participate in odorant binding (Buck et al. 1991). Later studies have attempted to predict odorant binding residues in olfactory receptors based upon sequence analysis, docking simulations using structural models, and predictions combining sequence analysis with structure information. Some of the earlier attempts included correlated mutation analysis used to identify eight contact positions (Singer et al. 1995a) and positive selection moments, which predicted three specificity-determining residues within TM6 (Singer et al. 1996).
Additional studies predicted ligand-contact residues by computer-based docking of odorants to structural models of the receptors (Afshar et al. 1998; Floriano et al. 2000; Singer 2000; Vaidehi et al. 2002). Together, these studies predicted 22 putative contact residues, located on TMs 3 to 7 in their models. In an elaboration of the original variability detection concept, analysis of the TM regions of ~200 OR paralog sequences combined with a low-resolution structural homology model allowed the prediction of 17 olfactory complementarity determining residues (CDRs; Pilpel and Lancet 1999). The predicted 17 positions were suggested to constitute a hypervariable odorant binding site, similar to that of immunoglobulins. This analysis was subsequently enhanced by introducing comparisons of ortholog pairs. The hypothesis in this case was that functional residues would tend to be conserved in orthologs, assuming that such pairs may recognize the same or similar odorant ligands. In a limited analysis (Lapidot et al. 2001), which included six human–mouse OR orthologous pairs, 16 of the 17 originally predicted CDRs (Pilpel and Lancet 1999) displayed low interortholog variability and high interparalog variability. A more recent study by Kondo et al. (2002) similarly predicted binding site residues by identifying positions variable between two different OR paralogs but fully conserved among five fish orthologs of each. They identified 14 potential contact residues dispersed on TMs 3, 5, 6, and 7.
The resolution of both the human and mouse complete OR subgenomes (Fuchs et al. 2001; Glusman et al. 2001; Young et al. 2002; Zhang and Firestein 2002) provided large sets of paralog and putative ortholog OR pairs. In this study we predict the binding site of ORs in an analysis that is unbiased by a priori assumptions as to the location of the binding site, using a large number of sequences from both humans and the mouse. This is done by identifying sequence positions with high conservation within ortholog pairs but with significantly lower sequence preservation in paralog pairs. A similar approach has recently been successful in the prediction of the binding sites of bacterial transcription factors and eukaryotic and prokaryotic protein kinases (Mirny and Gelfand 2002; Li et al. 2003). However, the exact methodology used in these studies could not be transferred to the case of ORs due to the availability of the complete set of OR sequences for only two species, and the paucity of functional data. We therefore developed an alternative methodology, which uses sequence pairs.
Results
Identifying putative odorant binding site residues
To identify potential odorant binding site residues, we searched for positions that are both highly conserved within ortholog pairs and significantly less conserved within paralog pairs. Underlying our analysis were three assumptions. First, that signal transduction in OR proteins occurs through the propagation of structural changes from the functional contact residues to the highly conserved putative G-protein interface (Pilpel and Lancet 1999). Therefore, the structural locations, and as a result the alignment positions of the binding site residues, would be largely shared by all ORs. Second, that orthologs have similar odorant specificities, and are therefore likely to show conservation at odorant recognition positions. Finally, that paralogs would be inclined to differ in their odorant specificities, and hence in their contact amino acids (Buck et al. 1991; Pilpel and Lancet 1999).
As a first step towards the prediction of the odorant binding site we wanted to identify positions that are highly conserved within OR ortholog pairs. To this end we selected a set of 218 predicted OR ortholog pairs, using conservative cutoff criteria of bearing mutual best-hit relationship and having higher than 77% sequence identity. Figure 1 ▶ illustrates the phylogenetic relationships captured by the ortholog selection criteria. We then calculated the positional conservation, C, in the predicted OR ortholog set (Fig. 1A ▶), and compared it to the conservation expected solely due to the overall sequence identity among the ortholog pairs (0.838 ± 0.003). We found 146 positions to be significantly conserved within orthologous OR pairs with a false discovery rate (FDR) of 0.05, as assessed by a modified chi-square test (Fig. 1B ▶).
Figure 1.
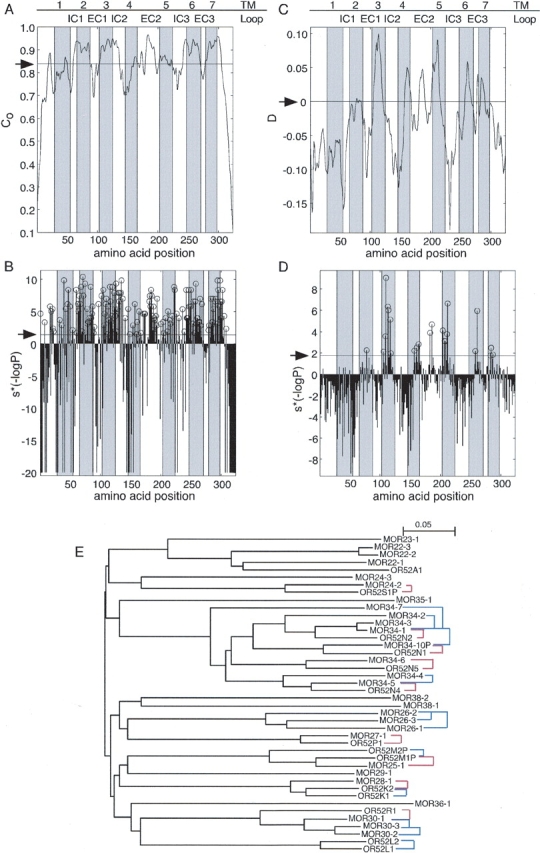
(A) Positional conservation within orthologous OR pairs computed along the multiple sequence alignment of 218 such pairs using equation 1. (B) The significance (P) of the positional conservation computed along the OR multiple sequence alignment. In the profile plotted, S*(−logP) is shown. S indicates whether the observed positional conservation is more (S = 1) or less (S = −1) than that expected by chance. Positions that are significantly conserved are marked with open circles. (C) The difference between the positional conservation within 218 orthologous OR pairs (Co) and that within 518 paralogous OR pairs (Cp), D, computed along the multiple sequence alignment. (D) The significance (P) of the difference D computed along the OR multiple sequence alignment. In the profile plotted, S*(−logP) is shown. S differentiates between positions for which D > 0 (S = 1) from positions for which D < 0 (S = −1). Positions that are significantly more conserved within orthologous pairs than within paralogous pairs are marked with open circles. The positions of TM segments, as inferred from rhodopsin, are shown as shaded areas. In A and C the arrow indicates the expectation value; in B and D it indicates the cutoff dictated by an FDR of 0.05. The original profiles in A and C were smoothed using the “hamming” function of the MATLAB/Math Works Inc. package with a window size = 7. (E) The phylogenetic relationships captured by the ortholog and paralogs sets. A neighbor-joining tree (Saitou and Nei 1987) is shown for selected ORs. Distances within the tree correspond to divergence between the receptors. Names of human ORs begin with OR, whereas those of mouse begin with MOR. Red lines indicate pairs from the ortholog set; blue lines indicate pairs from the paralog set. As can be seen, in some cases a receptor has more than one ortholog according to the tree. In such cases our ortholog selection criteria chose the ortholog with the highest sequence identity (least divergence). Thus, the selected pair was the one most likely to contain ORs that share similar odorant specificity.
The large number of positions found to be conserved within orthologous pairs suggested that this group of positions also contains, in addition to the odorant binding site positions, positions that are important for maintaining the OR structure and for interaction with partners common to all ORs. Therefore, a control group of OR pairs that share all structural and functional features except odorant specificity was needed to filter out positions that are conserved within ortholog pairs but do not participate in odorant binding. Based on the assumption that contact residues would tend to differ between paralogs, we selected paralog pairs as our control. Positions conserved among the pairs of paralogs to the same extent or more than among the pairs of the ortholog set would be ruled out as binding site residues.
For the comparison between the positional conservation profiles of the ortholog and paralogs sets to be valid, the expected conservation for both groups has to be similar. We therefore chose only paralog pairs, which had mutual sequence identity between 77% and 95%, corresponding to the range of values found among the ortholog pairs. The expected positional conservation for paralog pairs using all OR paralog pairs with a mutual sequence identity within the specified range was lower than the expected value for the ortholog pairs set (0.834 ± 0.003 versus 0.838 ± 0.003, P = 0.018, assessed by a binomial proportions test). Using all 1374 pairs of paralogs specified by the range of sequence identities within the ortholog set would have resulted in spurious predictions. As an example, if we were to examine a position in which both sets had a C-value equal exactly to their respective mean expected positional conservation, we would conclude that at this position orthologs are more conserved than paralogs (P = 0.018, as assessed by a binomial proportions test). Therefore, we chose to work with a set of paralogs where each pair constituted an OR and its closest paralog with a mutual sequence identity within the desired range. The resultant set, which contained 518 pairs, had an expected positional conservation of 0.868 ± 0.002, and thus qualified as a conservative control set for our analysis. The phylogenetic relationships captured by this paralog set are illustrated in Figure 1E ▶.
We define D, as the difference in positional conservation between the set of orthologs and the control set of paralogs (Fig. 1C ▶). Twenty-three positions were found to display a significantly greater conservation among ortholog pairs than among paralog pairs with an FDR of 0.05, as assessed by a binomial proportions test (Fig. 1D ▶).
We singled out those positions that were found both to be significantly conserved among ortholog pairs (C criterion) and to be significantly more conserved amongst ortholog pairs than amongst paralog pairs (D criterion). Only one residue identified by the D criterion was below the C criterion threshold. In other words, high D-values tend to predict high ortholog C-values. Thus, a set of 22 positions was identified (Table 1; Fig. 2 ▶). These positions are disposed on the predicted TMs 2 to 7, and on the second extracellular loop. We propose that this set of positions may play a major role in constructing the odorant binding site of the OR protein superfamily.
Table 1.
The predicted binding site positions
| OR segment position | Alignment position | Other GPCR | GPCR amino acid |
| TM2 13 | 86 | Human endothelin-1 receptor precursor (ET-A) | Y:129 |
| TM3 4 | 115 | Rat muscarinic m1 receptor | L:102 |
| TM3 7 | 118 | Rat muscarinic m1 receptor | D:105 |
| TM3 8 | 119 | Rat muscarinic m3 receptor | Y:148 |
| TM3 11 | 122 | Human dopamine D3 receptor | C:114 |
| TM3 12 | 123 | Rat muscarinic m1 receptor | N:110 |
| TM3 15 | 126 | Rat muscarinic m1 receptor | V:113 |
| TM3 16 | 127 | NA | |
| TM4 12 | 167 | Bovine rhodopsin | A:164 |
| TM4 16 | 171 | Human dopamine D2 receptor | S:267 |
| TM4 19 | 174 | Rat muscarinic m3 receptor | P:201 |
| EL2-1 | 193 | cholecystokinin type B (CCKB) receptor | Q:204 |
| EL2 2 | 196 | cholecystokinin type B (CCKB) receptor | H:207 |
| TM5 2 | 214 | Human α2A adrenergic receptor | V:197 |
| TM5 6 | 218 | Human α2A adrenergic receptor | C:201 |
| TM5 9 | 221 | Human α2A adrenergic receptor | S:204 |
| TM5 10 | 222 | Rat 5HT2A serotonin receptor | F:243 |
| TM6 12 | 288 | Bovine rhodopsin | F:261 |
| TM6 15 | 291 | Rat type-1B angiotensin II receptor | S:252 |
| TM7 5 | 321 | Human neurokinin-1 (substance P) receptor | I:290 |
| TM7 6 | 322 | Human dopamine D3 receptor | T:369 |
| TM7 9 | 325 | Rat muscarinic m1 receptor | C:407 |
The 22 predicted binding site positions in OR proteins with their numbering within the various protein segments and the alignment. The “other GPCR” column lists non-OR GPCRs in which the corresponding residue was linked to ligand binding, and the “GPCR amino acid” column gives the enumeration of this residue in the original protein sequence. NA indicates that no functional residue in a non-ORGPCR was found to align against the position. Information regarding functional residues was derived from the tiny GRAP mutant database (Edvardsen et al. 2002) via the GPCRDB graphical interface (Horn et al. 2001), and from (Baldwin 1994; Ji et al. 1995; Silvente-Poirot and Wank 1996; Lu and Hulme 1999; Ballesteros et al. 2001; Shi and Javitch 2002), and was matched to the prediction using the alignment in Figure 2A ▶.
Figure 2.
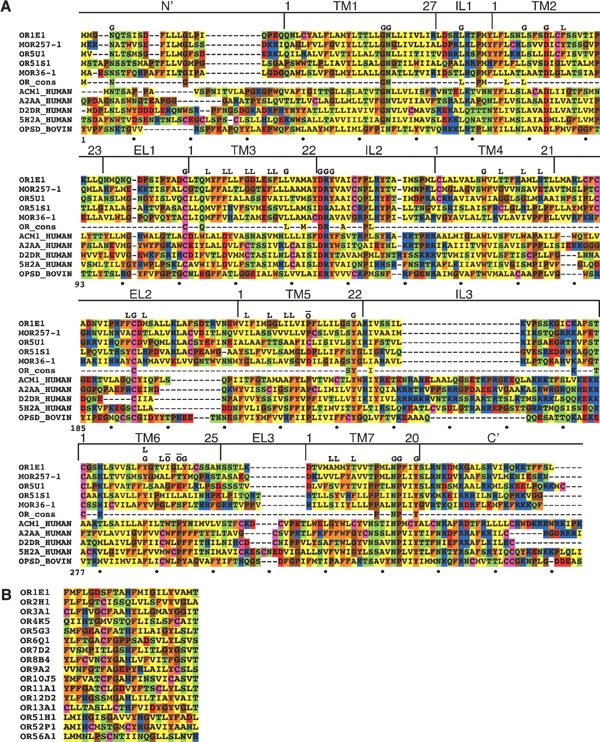
(A) Multiple alignment of OR proteins (upper rows) and non-OR GPCRs (lower rows). Five typical OR sequences and five non-OR GPCRs (lower rows) are shown. The row marked “OR cons” contains positions, which are 90% conserved in both class I and class II intact mouse ORs. The OR sequences shown are OR1E1 (human), MOR257-1 (mouse, AY073101), OR5U1 (human), OR51S1 (human), and MOR36-1 (mouse, AY073738). The other GPCR sequences are muscarinic M1 acetylcholine receptor (human, P11229), α2A adrenergic receptor (human, P08913), D2 dopamine receptor (human, P14416), 5-hydroxytryptamine 2A receptor (human, P28223), and rhodopsin (bovine, P02699). The N and C termini of the sequences have been partially truncated and the central part of the third intracellular loop has been removed for the muscarinic, adrenergic, dopamine, and serotonin receptors. The boundaries of the seven TM segments and the intracellular and extracellular loops are shown above the sequences. The following positions are marked above the sequences: G, conserved positions among all GPCRs (Oliveira et al. 1993), which are also conserved in ORs (over 60% conservation in intact mouse ORs); Ō, GPCR-conserved positions, which do not appear (TM6) or display very low conservation (TM5) in ORs; L, the proposed OR binding site positions (as defined in Table 1). The total alignment positions numbering is displayed below the sequences and a TM numbering is given for the individual helices. The alignment shown is a subset of a larger alignment of 205 sequences—112 OR sequences and 93 non-OR GPCR sequences. (B) Alignment of the putative binding site residues (corresponding to the list in Table 1) of human ORs from different families.
The location of the binding site residues in the predicted OR structure
We next asked where the binding site residues were located in a structurally relevant context. Past reports have described three-dimensional OR models (Afshar et al. 1998; Floriano et al. 2000; Singer 2000; Vaidehi et al. 2002), but they were based on a rhodopsin low resolution (7.5 Å) two-dimensional map (Schertler et al. 1993). Here we constructed an OR homology model based on the high-resolution (2.8 Å) X-ray crystallographic structure of bovine rhodopsin (Palczewski et al. 2000). The target to template alignment in the modeling process was based on a comprehensive amino acid multiple sequence alignment of 112 selected ORs against 93 other rhodopsin-like GPCRs, including bovine rhodopsin (Fig. 2A ▶). The human OR5U1 receptor was selected as a modeling target, as it was found to be intact in human as well as in four other primates (Gilad et al. 2003), and to conserve the entire OR consensus (Fig. 2A ▶), indicating a high probability that this receptor is functional. Remarkably, when the predicted binding site residues were highlighted on the model (Fig. 3 ▶), they all clustered around a pocket-shaped region in the model, and were located mainly in the extracellular two-thirds of TM helices 2 to 7. Furthermore, all the identified residues are on the inner (lumenal) face of these helices (Fig. 4 ▶). Finally, we compared the putative OR binding site definition to parameters related to rhodopsin. We found that the OR binding region spatially overlapped with the retinal binding site in rhodopsin (Fig. 3 ▶). We also compared our results to the calculated solvent accessible surface area (SASA) of rhodopsin. For rhodopsin, 90 out of 193 residues located within TM helices had a calculated SASA of less than 10%, 92 had a calculated SASA of more than 15%, and 11 had an intermediate calculated SASA (Ballesteros et al. 2001; Fig. 4A ▶). In our results, 18 of the predicted OR binding site residues aligned with amino acids that in rhodopsin have a calculated SASA of less than 10% (P = 6.45 × 10⁻⁵), and all 20 OR residues located in TMs had a calculated SASA of less than 15% (P = 2.37 × 10⁻⁶).
Figure 3.
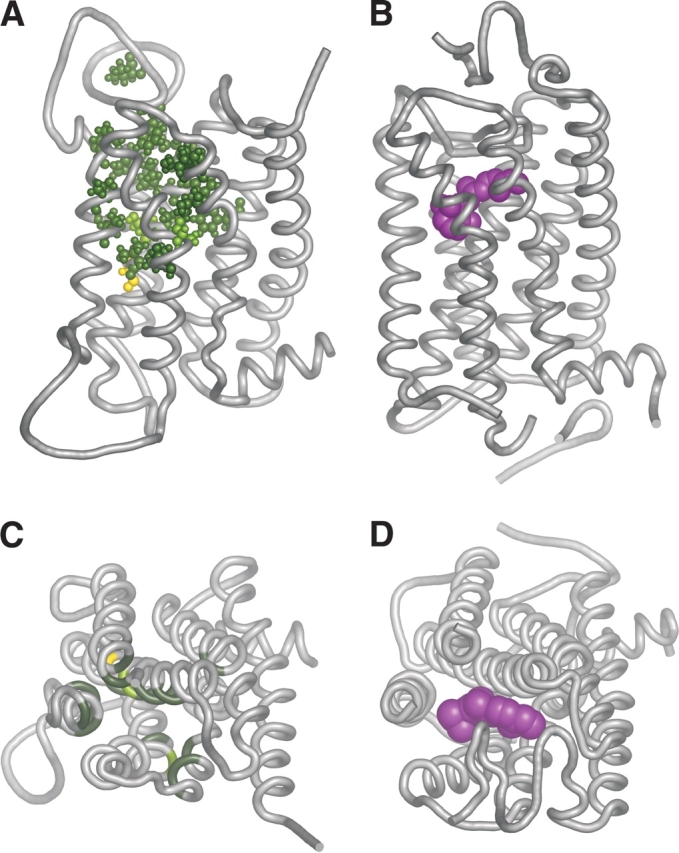
Comparison of the predicted odorant binding site with the retinal binding site of rhodopsin. Two views are shown: a side view as seen from within the membrane (A, B), and a view from the extracellular milieu (C,D). In all panels a tube depicts the backbone of the receptor. (A, C) A homology model of OR5U1, based on a high-resolution structure of bovine rhodopsin. The predicted binding site residues are shown either in ball and stick format (A) or as color patches (C). The color coding for residues is as follows: light green—residues that align against a functional residue in a non-OR GPCR (Table 1); dark green—residues for which the corresponding residue in the human dopamine D2 receptor has also been shown to be accessible by SCAM analysis; and yellow—residues that are negative for both criteria. (B, D) Structure of bovine rhodopsin (PDB id 1F88; Palczewski et al. 2000). The retinal moiety is shown in space-filling form and colored in magenta. In C and D the second extracellular loop is not shown for clarity. All pictures were generated using PyMol (Delano 2002).
Figure 4.

The predicted binding site residues as seen in two-dimensional space. (A) Helical net representation of a typical OR. The TM residues are numbered as in Figure 2 ▶. The OR consensus (Fig. 2A ▶) is indicated by circles containing the single-letter code of the appropriate amino acid. Red circles indicate residues for which the corresponding rhodopsin residue has a calculated SASA of less than 10%; blue circles indicate residues for which the corresponding rhodopsin residue has a calculated SASA of more than 15%. The predicted binding site residues are shaded using the following color code: light green—residues that align against a functional residue in a non-OR GPCR (Table 1); dark green—residues for which the corresponding residue in the human dopamine D2 receptor has also been shown to be accessible by SCAM analysis; and yellow—residues that are negative for both criteria. The snake diagram, which was the basis for the helical net, was created using the Viseur program (Campagne et al. 1999). (B) A projection of the extracellular two-thirds of a homology model of human OR5U1. Each TM helix, except that of TM3, is represented by four ovals, that are the result of four projections of the TM barrel that were made at different, equidistant, values of the Z coordinate (i.e., depth within the membrane). TM3 is represented by five ovals, as an additional projection was made to show the location of the cysteine at the N terminus of this helix, which probably participates in a disulfide bond with the cysteine in the second extracellular loop. The second extracellular loop is illustrated by a black line, and is shown to be constrained by the disulfide bond, so that it covers the putative binding pocket. Line widths indicate the depth of the oval within the membrane—the closer an oval is to the membrane surface, the thicker its line. The predicted binding site residues are shown as projected on to the ovals. They are numbered according to their relative position within their segment, and are color coded as in (A). The sizes of the individual circles representing the binding site residues indicate their depth within the membrane—the smaller the circle, the deeper the residue is within the membrane.
We further investigated whether the predicted OR binding site residues had overlap with amino acids found to be accessible in the binding pocket of other rhodopsin-like GPCRs. A comparison was performed with the results of the substituted-cysteine accessibility method (SCAM) performed on the human D2 dopamine receptor (D2R). In this receptor 73 out of 159 residues tested were found to be accessible in the binding pocket by using this method (Ballesteros et al. 2001). Seventeen out of the 20 putative OR binding site residues located in the TMs align against D2R residues accessible in the binding pocket (P = 3.73 × 10⁻⁴).
Two of the 22 functional OR residues (alignment positions 193 and 196, Table 1) were not in the TM barrel, but in the second extracellular loop. These residues were in close sequence proximity (relative positions −1 and +2) to a highly conserved cysteine within this loop, which in rhodopsin forms a disulfide bond with another highly conserved cysteine at the N terminus of the third helix (Fig. 4 ▶). The high conservation of these two cysteines in ORs (both are 99.77% conserved in intact mouse ORs) leads us to believe that this disulfide bond is found also in ORs. In rhodopsin, the disulfide bond pulls the second extracellular loop towards the binding pocket, bringing the counterparts of the predicted OR contact residues near the putative binding site. They are the first and last residues of a β-strand, which secludes the retinal from bulk solution on the extracellular surface (Menon et al. 2001). Ile189 in rhodopsin (alignment position 196) interacts with the methyl group bonded to C9 of the retinal ployene chain, while the other, Ser186 (alignment position 193), was shown to be within 4.5 Å of retinal. Thus, these loop residues are disposed favorably to interact with OR ligands.
Comparison of the predicted odorant binding site to experimental data
For other rhodopsin-like GPCRs, a wealth of data is available concerning ligand-contact residues. Using this information and the alignment of ORs against other rhodopsin-like GPCRs, we found that 21 out of 22 predicted binding site residues align against a ligand-contact residue in at least one other GPCR (Table 1). This overlap set includes the two residues in the second extracellular loop. For comparison, Shi and Javitch (2002) listed 33 residue positions within the TM segments that have been implicated in ligand binding in aminergic receptors based on experiments. Eleven of these residue positions are within our set of predicted binding site residues (P ≤ 1.33 × 10⁻⁴)
A functional expression study of rat and mouse OR I7 (Krautwurst et al. 1998), whose human ortholog is OR6A1, indicated a ligand-contact residue at position 206 (position 216 in our global alignment). It was discovered, as it accounts for a difference in affinity towards n-heptanal between the rat I7 OR (valine at this position) and the mouse I7 OR (isoleucine at this position). The residue at this position in the amino acid sequence is not included in our predicted binding site set. This discrepancy is, however, alleviated by a more recent report, which did not find this difference in affinity (Bozza et al. 2002).
Conservation of the entire binding site among ortholog and paralog pairs
Although the method used ensures that each individual binding site position would be conserved within most of the ortholog pairs, it does not guarantee that in a given pair of orthologs all or most of the binding site residues would be conserved. We observed that 147 out 218 ortholog pairs (67%) conserve at least 21 of 22 of the binding site residues (P = 0.0087, as assessed by simulation). Thus, it appears that overall conservation of the entire proposed binding site amino acid set could be used as a criterion for OR functionality as well as for the functional significance of orthologous pair assignment.
As an example, in two cases (human OR8A1 and mouse MOR171-2 and MOR171-3; and human OR8D1 and mouse MOR171-9 and MOR171-22) we found that an OR had an identical putative binding site with its second best hit, instead of its predicted ortholog. In both cases the difference between the overall sequence percent identity with the first and second best hits was less than 2%. Thus, it is in the realm of possibility that the true functional ortholog does not coincide with the counterpart with highest overall sequence identity.
A study attempting to identify the dog OR subgenome (Olender et al. 2003), found 137 triplets, each containing a dog, human, and mouse OR, which were reciprocal best hits for all three interspecies sequence comparisons. No cutoff was imposed on the percent identities within the individual pairs. We calculated the number of differences within the putative binding site for every pair within every triplet. The binding sites were remarkably conserved with 26 triplets (19%) displaying an identical binding site, and 54 triplets (39%) displaying a conservation pattern where two of the ORs had an identical binding site and the binding site of the third differed from them by at most a single amino acid. The highest conservation was observed for the two macrosomatic species, dog and mouse, where 87 pairs (64%) had at most one difference within the binding site. Thus, although the analysis was performed only on ORs from human and mouse, the prediction holds for other species as well.
Discussion
The odorant binding site
In this study we proposed a set of 22 amino acid positions as the binding site of ORs, based on their high conservation among orthologs and variability among paralogs. We made no assumption as to the location of the binding site in the three-dimensional structure of ORs. Nonetheless, most of the proposed binding site positions mapped to the TM regions of the receptors. More specifically, an overwhelming majority of the positions mapped to TM helices 3 to 7, which have previously been predicted to form the binding pocket of ORs (Floriano et al. 2000; Singer 2000). When superimposed on a three-dimensional model, all positions cluster around the binding pocket proposed by structural studies. Furthermore, based on previous work (Ballesteros et al. 2001), both SASA analysis of the bovine rhodopsin structure and SCAM analysis of the human D2 dopamine receptor indicate that most of these residues are accessible in the binding pocket. Thus, our results suggest that the location of the OR binding site coincides with that of many other GPCRs (Baldwin 1994).
Several theoretical studies have attempted to predict specific odorant-binding residues in the past. One of these studies (Kondo et al. 2002) based its prediction on the identification of positions that are fully conserved within groups of orthologs, but differ between paralogs. They examined the representative sequences of two OR paralogs in five strains of Japanese medaka fish, and predicted 14 specificity determining residues, five of which overlap with our prediction. However, an overwhelming majority (87%) of sequence positions, including 16 of the positions in our prediction, are fully conserved within the 10 homologous sequences examined. On the other hand, nine positions, which separate the paralogs in that study, do not display a significantly higher conservation within ortholog pairs, compared to paralog pairs in our analysis. Thus, both the small number of sequences examined and the relatively high similarity between them restricted the power of this previous study.
Another study (Pilpel and Lancet 1999) predicted the odorant binding site by detecting hypervariable positions in an alignment of ~200 paralogous ORs. To filter out nonspecific variability these authors imposed additional restriction, considering only residues located in the extracellular two-thirds of TMs 3 to 5, and facing the interior of the TM barrel in a low-resolution rhodopsin-based homology model. The resultant predicted binding site contained 17 residues, 10 of which appear also in our prediction. This previous study required strict hypervariability from the sequence positions of the odorant binding site, and thus overlooked residues that may be responsible for the fine tuning of specificity. Such residues may exhibit only slight variability, and would thus only be detected when contrasting their conservation among orthologs against that among paralogs. In addition, the a priori assumption of Pilpel and Lancet as to the location of the odorant binding site excluded the analysis of the loop regions of the receptor, and filtered out several hypervariable sequence positions found within the TM segments. Two such hypervariable positions, namely position 15 of TM6 and position 6 of TM 7, were indicated by the present analysis to be involved in receptor specificity. As for the seven residues missing from our prediction, two of them clearly face the exterior of the helix bundle in the present homology model, whereas the remaining five are all located in the cleft between TMs four and five, in a region not corresponding to the ligand-binding pocket of any other GPCR. The authors of the previous study hypothesized that this region might act as a binding site unique to ORs. None of the residues proposed by the present study is located in this region, indicating that the variability observed in this region may be nonspecific.
Several other studies used computer-based docking of odorants to structural models of ORs to predict residues that participate in the binding of odorants (Afshar et al. 1998; Floriano et al. 2000; Singer 2000; Vaidehi et al. 2002). The unified set of predicted residues from these studies constitutes 22 residues (Table 2), 10 of which were predicted by the present study. Although all the contact residues predicted by these studies were located in TMs 3 to 7 in their respective models, four of the predicted residues lie in regions that are not membrane-embedded according to the homology model generated in the present study. This discrepancy may be due to the fact that most of these studies (Floriano et al. 2000; Singer 2000; Vaidehi et al. 2002) predicted the location of TMs, whereas we inferred the location of these segments by aligning ORs to rhodopsin, for which the bounds of the TMs have been determined experimentally. All odorant-binding residues predicted by the docking simulation studies, but excluded from the set of residues identified by our analysis, face the exterior of the TM bundle in our model. All these studies made use of the rhodopsin low-resolution (7.5 Å) two-dimensional map (Schertler et al. 1993) in which the kinks now known to be a prominent feature of the rhodopsin structure were not apparent. Interestingly, the greatest overlap between our prediction and those made by the docking simulation studies is in the third TM helix, the only helix that is not kinked in the rhodopsin structure. It is thus possible that the use of low resolution structural data in these studies compromised their ability to correctly predict residues that bind odorants in ORs.
Table 2.
OR residues predicted by docking studies to participate in odorant binding
| Location in OR model | Alignment position | Predicting studies | Predicted by the present study |
| TM3 | 115 | (Floriano et al. 2000) | Yes |
| TM3 | 118 | (Floriano et al. 2000; Vaidehi et al. 2002) | Yes |
| TM3 | 119 | (Floriano et al. 2000) | Yes |
| TM3 | 122 | (Floriano et al. 2000) | Yes |
| TM3 | 123 | (Floriano et al. 2000; Vaidehi et al. 2002) | Yes |
| TM3 | 126 | (Vaidehi et al. 2002) | Yes |
| TM4 | 174 | (Singer 2000; Vaidehi et al. 2002) | Yes |
| EL2 | 178 | (Floriano et al. 2000) | No |
| EL2 | 182 | (Floriano et al. 2000) | No |
| In the fifth helix but outside TM5 | 210 | (Floriano et al. 2000) | No |
| TM5 | 214 | (Afshar et al. 1998; Singer 2000) | Yes |
| TM5 | 215 | (Floriano et al. 2000; Singer 2000) | No |
| TM5 | 216 | (Floriano et al. 2000) | No |
| TM5 | 218 | (Singer 2000) | Yes |
| TM5 | 219 | (Floriano et al. 2000) | No |
| TM6 | 286 | (Vaidehi et al. 2002) | No |
| TM6 | 289 | (Singer 2000) | No |
| TM6 | 290 | (Floriano et al. 2000) | No |
| TM6 | 293 | (Floriano et al. 2000; Singer 2000) | No |
| EL3 | 306 | (Floriano et al. 2000) | No |
| TM7 | 318 | (Floriano et al. 2000) | No |
| TM7 | 322 | (Singer 2000) | Yes |
Residues predicted by docking studies (Afshar et al. 1998; Floriano et al. 2000; Singer 2000; Vaidehi et al. 2002) are listed together with their location in the OR structure, as inferred by homology from the rhodopsin crystal structure (Palczewski et al. 2000), and an indication of whether they were predicted by our analysis. The “Location in OR model” provides the location of the residues in the context of the homology model generated by the present study (Fig. 3 ▶); the “Alignment position” columns specifies the position of the residues in the alignment in Figure 2A ▶; and the “Predicting studies” column indicates which studies suggested that the residue participates in odorant binding.
In conclusion, the present study overcomes many of the shortcomings of previous studies. Our data sets were large, and consisted of informative pairs of orthologs and paralogs, which gave us substantial statistical power, and relieved us of the need to make a priori assumptions about the binding site, or use structural information. Positions exhibiting nonspecific variability should be variable in both orthologs and paralogs, and would therefore be rejected on the grounds of not being conserved in orthologs. On the other hand, positions related to the common infrastructure of ORs should be conserved in both orthologs and paralogs, and would thus be rejected due to a nonsignificant difference in conservation between the two sets. Thus, by contrasting the conservation within pairs of orthologs and paralogs we are able to avoid erroneous results.
Limitations of the prediction
One of the assumptions on which the present study is based is that the same residues determine odorant specificity in all ORs. If this assumption were not true, only the set of residues determining specificity shared by all (or most) ORs would be detected. Two additional assumptions are that paralogs have different odorant specificities and orthologs share identical odorant specificities. Noise in the form of false orthologs or orthologs with diverged specificity may thus cause the analysis to overlook some specificity-determining residues. Two recent studies, which predicted the binding sites of bacterial transcription factors (Mirny and Gelfand 2002) and the specificity-determining residues of protein kinases (Li et al. 2003), utilizing the same concept as our prediction, indeed used only unambiguous orthologs based on known function. However, for the OR superfamily this is not possible; thus, we resorted to predicting orthologs based solely on sequence similarity criteria. Despite this drawback we were able to predict a binding site that is corroborated both by its location on a structural model and by its high correspondence to ligand-contact residues in other GPCRs. This was aided by the large size of the sample, compared to previous studies, resulting in enhanced statistical power.
A high-resolution homology model for ORs
The binding site prediction process presented in this paper did not rely on any structural information. The homology model was generated solely for locating the implicated residues in the framework of the OR structure. For this, we used the crystal structure of bovine rhodopsin (Palczewski et al. 2000), the only structural template available for GPCRs. This is the first report of an OR homology model based on such high-resolution structural data. The rhodopsin structure contains many kinks and distortions in the TM domains, some of which were not seen in the low-resolution data of rhodopsin (Menon et al. 2001). Thus, our model is an improvement on previously published models (Floriano et al. 2000; Singer 2000; Vaidehi et al. 2002). However, it should be noted that this model still suffers from some of the disadvantages of its predecessors.
One such weakness is the loop regions. These are the most inaccurate feature of the model. On the one hand, these regions could not be modeled according to rhodopsin: some of their residues are absent from the crystal structure (Palczewski et al. 2000), they may be affected by packing forces within the crystal (Vaidehi et al. 2002), and they are the most divergent feature of GPCRs (Fig. 2A ▶). On the other hand, the second extracellular loop is of functional importance in ligand binding, as demonstrated experimentally for non-OR GPCRs (Silvente-Poirot and Wank 1996; Shi and Javitch 2002) and by our analysis for ORs. We, therefore, modeled the loop regions by using an ab initio method. The method used (Sali and Blundell 1993; Fiser et al. 2000) has been shown to perform well in the simultaneous prediction of short loops (up to 14 residues), with the accuracy of prediction dropping with length. The second extracellular loop of ORs is exceptionally long, and even when the disulfide bond-forming cysteine at its middle is used to divide it into two loops, each contains more than 14 residues. For our purposes the resultant limited quality model of this region was sufficient, because the location of the predicted binding residues in this region is quite well determined due to their proximity to the cysteine that participates in the disulfide bond. However, it is possible that this loop may have additional functional roles, as has been previously suggested (Singer et al. 1995b). To investigate this region, as well as other regions that are divergent between ORs and other rhodopsin-like GPCRs, it may be necessary to employ additional, complementary approaches to modeling the structure and function of ORs.
Materials and methods
OR sequences
A collection of 898 human OR genes and 1296 mouse OR genes was initially analyzed. Human sequences were obtained from version 38 of the HORDE database (Safran et al. 2003); mouse sequences were from the work of Zhang et al. (Zhang and Firestein 2002), and were obtained from GenBank, accession numbers AY072961-AY074256. The conceptual translation of the mouse OR genes was generously provided by Zhang et al. Out of this collection of sequences we selected those sequences that have a coding region that spans all seven TMs, have no ambiguous residues (due to sequencing errors), and have at most two disruptions within the open reading frame. We also removed nine human OR sequences, which were found to be identical at the protein level to another sequence in the HORDE database. The final set comprised 1441 complete OR sequences—402 human sequences and 1039 mouse sequences, each having either an intact open reading frame or up to two frame disruptions.
A basic assumption made in the analysis is that the pseudogenes used are recent, and therefore, may be informative for the analysis. To test this assumption, we compared the conservation of the pseudogenes to that of the intact genes. We quantified the conservation of a gene by computing the percentage of a consensus it conserves. The consensus used was a group of 31 positions (Fig. 2A ▶) that are 90% conserved in both class I and class II intact ORs, which have been shown to display distinct conservation patterns (Zhang and Firestein 2002). We used only mouse intact ORs for the generation of the consensus, because these were previously shown to have higher conservation than human intact ORs (Young et al. 2002). Ninety percent of the OR pseudogenes were found to conserve more than 90% of the consensus, indicating that a similar proportion of the binding site residues may be conserved in these ORs. Thus, these sequences could provide substantial information for our analysis.
Non-OR GPCR sequences
To compare the predicted binding site to ligand contact residues in other GPCRs, we selected vertebrate sequences from the following rhodopsin-like GPCR families: opsins, acetylcholine (muscarinic), adrenergic, dopamine, serotonin, histamine, and angiotensin receptors. Sequences were obtained from the SWISS-PROT database (Bairoch and Apweiler 2000), and divided into sets according to the highest resolution division in the GPCRDB (Horn et al. 2001) classification.
Multiple sequence alignments
To date, experimentally determined structures have been published only for one GPCR, bovine rhodopsin (Palczewski et al. 2000). This precludes any possibility of a structure-based sequence alignment for GPCRs. We therefore created multiple sequence alignments based on sequence information and the knowledge of the location of the TM helices in rhodopsin. We employed a hierarchical approach in creating the alignments. In this approach, small sets of very close sequences were first aligned automatically. Alignments of increasing distance were then merged. In cases of gaps in the TM regions the alignments were edited manually, assuming that all aligned receptors share a similar seven-transmembrane bundle. Manual intervention was also necessary in cases where conserved residues or motifs (such as a N-glycosylation site common to most ORs) were misaligned. Automatic alignments of sequences were done using the Clustal X (Thompson et al. 1997) software with default parameters. The same software, in its profile alignment mode, was used for automatic merging of alignments. Manual editing and merging of alignments was done using the Seaview (Galtier et al. 1996) software.
To create the alignment of OR sequences we performed the following steps:
For each OR family we built an alignment. Each family was partitioned into sets of up to 20 sequences, according to a neighbor-joining tree built using Clustal X with default parameters. Each of these sets was then aligned automatically. Individual alignments belonging to the same OR family were then merged manually, obtaining eventually a single alignment for each family. Positions in which more than 50% of the sequences had a gap were edited out.
The alignments of the various OR families were merged manually. No positions were edited out, so that insertions present in the final alignment are a characteristic of at least one OR family.
A subset of 112 ORs was selected for alignment against non-OR GPCRs. This set contained at least two representatives from each OR family. Where possible, we selected sequences that conserved all 31 positions of the OR consensus (Fig. 2 ▶). From families 3 and 56, in which no sequence conserved all the consensus positions, we chose sequences conserving 30 and 29 of these positions, respectively.
The alignment of the non-OR GPCR sets and the merging of the resultant alignments were done automatically. Manual editing of the alignments was performed in the same cases detailed for the OR-only alignment. The OR subset was added to the alignment in the same way. We removed from the final alignment all non-OR GPCR sequences displaying more than 60% identity with another sequence in the set. The final alignment contained 205 sequences—112 OR sequences and 93 non-OR GPCR sequences.
Both the alignment of ORs alone and of ORs with other rhodopsin like GPCRs are available online as Supplemental Material, together with a table of the positions of the predicted binding site residues within these alignments.
Location of TM segments and residue numbering
We used the annotation for bovine rhodopsin found in the SWISS-PROT database (Bairoch and Apweiler 2000). The location of the TM segments for the ORs and the other GPCRs was inferred from their alignment against this protein. Residues within the TM segments are numbered relative to the beginning of the TM segments. Residues within the second extracellular loop are numbered relative to the disulfide bond-forming cysteine, which is numbered zero.
Construction of the set of OR ortholog pairs
The construction process constituted the following steps:
For each possible human–mouse OR pair, (hOR, mOR), compute γ(hOR,mOR), the overall sequence identity, using the alignment of all ORs in the data set.
Using the γ values computed in step 1, select those pairs where the members are reciprocal best hits (Mushegian et al. 1998), that is, pairs (hOR, mOR) such that the overall sequence identity γ(hOR,mOR) fulfills γ(hOR,mOR) = maxmOR′ɛM γ(hOR,mOR′) and γ(hOR,mOR) = maxhOR′ɛH γ(hOR′,mOR) where H and M are the sets of human and mouse receptors within the data set, respectively. This step identified 257 pairs.
To minimize the fraction of false positives within the set, a cutoff was imposed on the overall sequence identity within pairs. This cutoff was set at 77%, obtaining a set of 218 pairs, 85% of the original set. The highest overall sequence identity within this set was 94% at the protein level.
Construction of the set of OR paralog pairs
The construction process constituted the following steps:
For each pair (ORA, ORB) of paralogous ORs compute γ(ORA, ORB), the overall sequence identity, using the alignment of all ORs in the data set.
Using the γ values computed in step 1, select all nonredundant paralogous pairs (ORA,ORB), such that γ(ORA,ORB) fulfills, γ(ORA,ORB) = maxOR′ɛS γ(ORA,OR′); ORA,ORB ɛ S, where S is either human or mouse.
From the set formed in 2, select only those pairs complying with the overall sequence identity cutoff imposed on the ortholog pairs, that is, pairs fulfilling γ(ORA,ORB) > 77%.
Pairs displaying above 95% overall sequence identity are probably the result of very recent duplications, and are thus noninformative. Also, the range of sequence identities within the sets of orthologs and paralogs should match. Therefore, remove from the any pair (ORA, ORB) for which γ(ORA, ORB) = maxOR′ɛS γ(ORA, OR′) > 95%. Where possible, try to replace the pair (ORA, ORB) with a pair (ORA, ORB′), such that, 77% ≤ γ(ORA, ORB) ≤ 95%, and for any receptor ORC ≠ ORB′ within species S γ(ORA, ORC) ≤ γ(ORA, ORB′).
These steps resulted in a set of 518 paralogous OR pairs.
Phylogenetic analysis
The Clustal X (Thompson et al. 1997) software was used to generate a neighbor-joining tree (Saitou and Nei 1987) from an existing manually curated alignment, using default parameters. The program NJPLOT (Perriere and Gouy 1996) was used to visualize the resultant tree.
Calculation and assessment of positional conservation
In calculating the conservation of a position in an alignment one considers whether the substitutions seen at a specified position are conservative or not. One possibility for assessing whether a certain substitution may be classified as conservative or not is the examination of the score corresponding to the substitution in a scoring matrix, such as BLOSUM62 (Henikoff and Henikoff 1996). However, such substitution matrices were designed for database searching and pairwise alignment, and have not been tested for their ability to predict whether a substitution would alter a protein or not (Ng and Henikoff 2001). Therefore, we conservatively chose to use the strict measure of identity in the calculation of conservation. For each alignment position i we consider the subset of pairs in which at least one of the sequences has an amino acid at that alignment position, that is, excluding pairs in which both sequences have a gap. The number of pairs in this subset will be denoted by n(i) in the following calculations.
The conservation at position i was calculated as
 |
(1) |
where nI(i) is the number of pairs in which both members have the same amino acid at position i.
In the equations that follow, all quantities refer to a specific alignment position i, which will be omitted for clarity.
For each position we expect to find a certain amount of conservation that is due only to the fact that each pair contains related sequences, exhibiting some degree of sequence identity. It is therefore necessary to assess the significance of the observed value of C, given the overall sequence identity in the pairs of the set examined. To determine the statistical significance of C we employed a modified one-sided chi-square test with one degree of freedom. The expected number of pairs in which both members have the same amino acid at position i was calculated as
 |
(2) |
where γ(j) is the overall sequence identity within the jth pair in the subset.
The expected number of pairs differing at position i was calculated as
 |
(3) |
The χ2 value for the statistical significance of C is then calculated by
 |
(4) |
The statistical significance of Y was then extracted from the χ2 distribution with one degree of freedom.
Comparison of the positional conservation between orthologs and paralogs
We wished to distinguish positions that are equally conserved among ortholog and paralog pairs from those that show differential conservation between these two sets. For this purpose we tested, for each position i, the null hypothesis that the probability of this position to be conserved within a pair of orthologs is equal to that within a pair of paralogs, using a two-sample binomial proportions test (Collet 1991). We denote by no and np the number of ortholog and paralog pairs, respectively, in which at least one sequence has an amino acid at position i; by nIo and nIo the number of ortholog and paralog pairs, respectively, in which both sequences have the same amino acid at alignment position i; and Co and Cp are the respective positional conservations of alignment position i in the ortholog and paralog sets, as calculated by equation 1. Under the null hypothesis there is a common conservation probability, p, for the ortholog and paralog sets, which can be estimated by:
 |
(5) |
(Collet 1991).
We may consider Co and Cp as the estimated conservation probabilities for the ortholog and paralog sets, respectively. If we assume the two sets represent independent samples then for large enough sample sizes the difference
 |
(6) |
will have an approximate normal distribution and variance given by:
 |
(7) |
and so
 |
(8) |
(where s.e.(D) denotes the standard error of D) is approximately normally distributed with zero mean and unit variance. Positions for which the null hypothesis is rejected, and for which D > 0, were considered as having higher conservation within ortholog pairs than within paralog pairs.
Correction for multiple testing
Both the test for positional conservation and the test for comparison of positional conservations were performed for each alignment position. We used the FDR method (Benjamini and Hochberg 1995) to eliminate possible false positives due to multiple tests.
Statistical significance of the overlap between the predicted binding site set and results obtained by an alternative method
The following section deals with the calculation of the statistical significance of the overlap between the predicted binding site set and the results of SASA calculation for the rhodopsin structure, SCAM analysis of the human D2 dopamine receptor, and ligand contact residues obtained experimentally for aminergic receptors. Let T be the set of sequence positions analyzed in the particular method, R the set of sequence positions identified by the method, A the subset of the prediction contained within T, and O = A∩R the overlap between the prediction and the results of the particular method. Then,
 |
(9) |
In the case of the ligand contact residues obtained experimentally for aminergic receptors (Shi and Javitch 2002), we had no information as to the identity of the test set T. We therefore conservatively assumed that only residues within the transmembrane helices of receptors were tested.
Statistical significance of the conservation of the predicted binding site in ortholog pairs
A simulation was designed to test the hypothesis that the conservation of the binding site within ortholog pairs is purely due to the fact that its positions were selected for their high conservation within ortholog pairs. A binary matrix M of size no × b (no is the number of ortholog pairs; b is the number of residues within the predicted binding site) was generated, where each row corresponds to an ortholog pair, and each column corresponds to a binding site position. Mij = 1 if both members of the ith pair had an identical amino acid at the jth binding site position; otherwise, Mij = 0. In each of 10,000 iterations, we permuted each column independently, thus preserving the positional conservation values of the binding site positions. We then examined the rows of the modified matrix to find the number of pairs that had at most one difference within the binding site. We assessed the significance of the observed result by calculating the fraction of iterations where the simulated result was at least as good as the one observed.
Homology modeling
A homology model of OR5U1 (HORDE id 512) was constructed, using the high-resolution bovine rhodopsin crystal structure (PDB id 1F88; Palczewski et al. 2000) as a template. The modeling process was made up of the following steps:
The “homology” module of the InsightII suite was used to generate a model of the helical bundle of OR5U1 with rhodopsin as the template. Palczewski et al.’s (2000) definition of the helical region was used in conjunction with the alignment in Figure 2A ▶. Due to the extremely short third extracellular loop the seventh helix was started two residues after its beginning in the rhodopsin structure, so that this loop could be modeled.
The MODELLER interface (Sali and Blundell 1993; Fiser et al. 2000) in the “homology” module of the InsightII suite was used to create a template for the loops. To do so we created an alignment of OR5U1 and bovine rhodopsin, in which the helical regions were aligned as in Figure 2A ▶ and the loop regions were aligned against gaps. Using this alignment we generated an automatic all-atoms model with no molecular dynamics for the helical regions, a disulfide bond as in the rhodopsin structure, and a molecular dynamics level set at “low” for the loop regions. This model was used as a basis for five models in which only the loops were refined with molecular dynamics level set at “high”. Out of these five models we selected one model as a template for the extracellular loops and one as a template for the intracellular loops, aiming at a minimal number of violations in these regions. The fact that these two regions do not contact each other allowed us to choose the templates from two separate models. The coordinates of the loops in the chosen model were added to the model of the helices created in step 1.
The termini of the receptor were assigned coordinates in extended conformation.
The “biopolymer” module of the InsightII suite was used to create the disulfide bond between the third helix and the second extracellular loop.
The “discover” module of this suite was used for minimization of the model, setting the force field to CVFF and the dielectric constant to 1.0. We used the default potential parameters. Minimization was performed in two stages: minimization with the heavy atoms of the helices fixed, and then with the heavy atoms of the helices tethered. In both stages the derivative was set to 1.0 and the number of iterations to 1000. In each stage minimization was first run using the steepest descent algorithm, and following that the conjugate gradient algorithm was used.
A bump check was performed with an overlap parameter of 0.6 Å.
The termini of the receptor (residues 1–15 and 305–321), which were not extensively modeled, were deleted from the final model.
Electronic supplemental material
A multiple sequence alignment of all ORs analyzed in ClustalW format (ORs_only.aln), a multiple sequence alignment of selected ORs with non-OR GPCRs in ClustalW format (ORs_and_GPCRs. aln), and a table with the alignment positions of the predicted binding site residues in the two alignments (predicted_bs_in_aln. pdf). “PDF” (Portable Data Format) files were generated on a Macintosh running on MacOS X (10.2.6).
Acknowledgments
We thank Itsik Pe’er for help with the statistical analysis and helpful comments on the manuscript. We thank Yitzhak Pilpel, Joel Sussman, and Itai Yanai for helpful comments on the manuscript. D.L. holds the Ralph and Lois Silver Chair in Human Genetics. This work was supported by the Crown Human Genome Center. Y.G. is supported by the Clore Foundation.
The publication costs of this article were defrayed in part by payment of page charges. This article must therefore be hereby marked “advertisement” in accordance with 18 USC section 1734 solely to indicate this fact.
Supplemental material: see www.proteinscience.org
Article and publication are at http://www.proteinscience.org/cgi/doi/10.1110/ps.03296404.
References
- Afshar, M., Hubbard, R.E., and Demaille, J. 1998. Towards structural models of molecular recognition in olfactory receptors. Biochimie 80 129–135. [DOI] [PubMed] [Google Scholar]
- Bairoch, A. and Apweiler, R. 2000. The SWISS-PROT protein sequence database and its supplement TrEMBL in 2000. Nucleic Acids Res. 28 45–48. [DOI] [PMC free article] [PubMed] [Google Scholar]
- Baldwin, J.M. 1994. Structure and function of receptors coupled to G proteins. Curr. Opin. Cell Biol. 6 180–190. [DOI] [PubMed] [Google Scholar]
- Ballesteros, J.A., Shi, L., and Javitch, J.A. 2001. Structural mimicry in G protein-coupled receptors: Implications of the high-resolution structure of rhodopsin for structure–function analysis of rhodopsin-like receptors. Mol. Pharmacol. 60 1–19. [PubMed] [Google Scholar]
- Benjamini, Y. and Hochberg, Y. 1995. Controlling the false discovery rate—A practical and powerful approach to multiple testing. J. R. Stat. Soc. B Met. 57 289–300. [Google Scholar]
- Bozza, T., Feinstein, P., Zheng, C., Mombaerts, P., Horn, F., Vriend, G., and Cohen, F.E. 2002. Odorant receptor expression defines functional units in the mouse olfactory system. J. Neurosci. 22 3033–3043. [DOI] [PMC free article] [PubMed] [Google Scholar]
- Buck, L., Axel, R., Fiser, A., Do, R.K., and Sali, A. 1991. A novel multigene family may encode odorant receptors: A molecular basis for odor recognition. Cell 65 175–187. [DOI] [PubMed] [Google Scholar]
- Campagne, F., Jestin, R., Reversat, J.L., Bernassau, J.M., and Maigret, B. 1999. Visualisation and integration of G protein-coupled receptor related information help the modelling: Description and applications of the Viseur program. J. Comput. Aided Mol. Des. 13 625–643. [DOI] [PubMed] [Google Scholar]
- Collet, D. 1991. Modelling binary data, 1st ed., p. 369. Chapman & Hall, London.
- Delano, W.L. 2002. The pymol molecular graphics system, 0.91 ed. Delano Scientific, San Carlos, CA.
- Edvardsen, O., Reiersen, A.L., Beukers, M.W., and Kristiansen, K. 2002. tGRAP, the G-protein coupled receptors mutant database. Nucleic Acids Res. 30 361–363. [DOI] [PMC free article] [PubMed] [Google Scholar]
- Fiser, A., Do, R.K., and Sali, A. 2000. Modeling of loops in protein structures. Protein Sci. 9 1753–1773. [DOI] [PMC free article] [PubMed] [Google Scholar]
- Floriano, W.B., Vaidehi, N., Goddard 3rd, W.A., Singer, M.S., and Shepherd, G.M. 2000. Molecular mechanisms underlying differential odor responses of a mouse olfactory receptor. Proc. Natl. Acad. Sci. 97 10712–10716. [DOI] [PMC free article] [PubMed] [Google Scholar]
- Fuchs, T., Glusman, G., Horn-Saban, S., Lancet, D., and Pilpel, Y. 2001. The human olfactory subgenome: From sequence to structure and evolution. Hum. Genet. 108 1–13. [DOI] [PubMed] [Google Scholar]
- Galtier, N., Gouy, M., and Gautier, C. 1996. SEAVIEW and PHYLO_WIN: Two graphic tools for sequence alignment and molecular phylogeny. Comput. Appl. Biosci. 12 543–548. [DOI] [PubMed] [Google Scholar]
- Gilad, Y., Man, O., Paabo, S., and Lancet, D. 2003. Human specific loss of olfactory receptor genes. Proc. Natl. Acad. Sci. 100 3324–3327. [DOI] [PMC free article] [PubMed] [Google Scholar]
- Gimelbrant, A.A., Stoss, T.D., Landers, T.M., and McClintock, T.S. 1999. Truncation releases olfactory receptors from the endoplasmic reticulum of heterologous cells. J. Neurochem. 72 2301–2311. [DOI] [PubMed] [Google Scholar]
- Glusman, G., Yanai, I., Rubin, I., and Lancet, D. 2001. The complete human olfactory subgenome. Genome Res. 11 685–702. [DOI] [PubMed] [Google Scholar]
- Henikoff, J.G. and Henikoff, S. 1996. Blocks database and its applications. Methods Enzymol. 266 88–105. [DOI] [PubMed] [Google Scholar]
- Horn, F., Vriend, G., and Cohen, F.E. 2001. Collecting and harvesting biological data: The GPCRDB and NucleaRDB information systems. Nucleic Acids Res. 29 346–349. [DOI] [PMC free article] [PubMed] [Google Scholar]
- Ji, H., Zheng, W., Zhang, Y., Catt, K.J., and Sandberg, K. 1995. Genetic transfer of a nonpeptide antagonist binding site to a previously unresponsive angiotensin receptor. Proc. Natl. Acad. Sci. 92 9240–9244. [DOI] [PMC free article] [PubMed] [Google Scholar]
- Kondo, R., Kaneko, S., Sun, H., Sakaizumi, M., and Chigusa, S.I. 2002. Diversification of olfactory receptor genes in the Japanese medaka fish, Oryzias latipes. Gene 282 113–120. [DOI] [PubMed] [Google Scholar]
- Krautwurst, D., Yau, K.W., Reed, R.R., Sali, A., and Blundell, T.L. 1998. Identification of ligands for olfactory receptors by functional expression of a receptor library. Cell 95 917–926. [DOI] [PubMed] [Google Scholar]
- Lapidot, M., Pilpel, Y., Gilad, Y., Falcovitz, A., Sharon, D., Haaf, T., and Lancet, D. 2001. Mouse–human orthology relationships in an olfactory receptor gene cluster. Genomics 71 296–306. [DOI] [PubMed] [Google Scholar]
- Li, L., Shakhnovich, E.I., and Mirny, L.A. 2003. Amino acids determining enzyme-substrate specificity in prokaryotic and eukaryotic protein kinases. Proc. Natl. Acad. Sci. 100 4463–4468. [DOI] [PMC free article] [PubMed] [Google Scholar]
- Lu, Z.L. and Hulme, E.C. 1999. The functional topography of transmembrane domain 3 of the M1 muscarinic acetylcholine receptor, revealed by scanning mutagenesis. J. Biol. Chem. 274 7309–7315. [DOI] [PubMed] [Google Scholar]
- Menon, S.T., Han, M., and Sakmar, T.P. 2001. Rhodopsin: Structural basis of molecular physiology. Physiol. Rev. 81 1659–1688. [DOI] [PubMed] [Google Scholar]
- Mirny, L.A. and Gelfand, M.S. 2002. Using orthologous and paralogous proteins to identify specificity-determining residues in bacterial transcription factors. J. Mol. Biol. 321 7–20. [DOI] [PubMed] [Google Scholar]
- Mushegian, A.R., Garey, J.R., Martin, J., and Liu, L.X. 1998. Large-scale taxonomic profiling of eukaryotic model organisms: A comparison of orthologous proteins encoded by the human, fly, nematode, and yeast genomes. Genome Res. 8 590–598. [DOI] [PubMed] [Google Scholar]
- Ng, P.C. and Henikoff, S. 2001. Predicting deleterious amino acid substitutions. Genome Res. 11 863–874. [DOI] [PMC free article] [PubMed] [Google Scholar]
- Olender, T., Fuchs, T., Linhart, C., Shamir, R., Adams, M., Kalush, F., Khen, M., and Lancet, D. 2003. The canine olfactory subgenome. Genomics (in press). [DOI] [PubMed]
- Oliveira, L., Paiva, A.C.M., and Vriend, G. 1993. A common motif in G-protein-coupled seven transmembrane helix receptors. J. Comput. Aided Mol. Des. 7 649–658. [Google Scholar]
- Palczewski, K., Kumasaka, T., Hori, T., Behnke, C.A., Motoshima, H., Fox, B.A., Le Trong, I., Teller, D.C., Okada, T., Stenkamp, R.E., et al. 2000. Crystal structure of rhodopsin: A G protein-coupled receptor. Science 289 739–745. [DOI] [PubMed] [Google Scholar]
- Perriere, G. and Gouy, M. 1996. WWW-query: An on-line retrieval system for biological sequence banks. Biochimie 78 364–369. [DOI] [PubMed] [Google Scholar]
- Pilpel, Y. and Lancet, D. 1999. The variable and conserved interfaces of modeled olfactory receptor proteins. Protein Sci. 8 969–977. [DOI] [PMC free article] [PubMed] [Google Scholar]
- Safran, M., Chalifa-Caspi, V., Shmueli, O., Olender, T., Lapidot, M., Rosen, N., Shmoish, M., Peter, Y., Glusman, G., Feldmesser, E., et al. 2003. Human gene-centric databases at the Weizmann Institute of Science: GeneCards, UDB, CroW 21 and HORDE. Nucleic Acids Res. 31 142–146. [DOI] [PMC free article] [PubMed] [Google Scholar]
- Saitou, N. and Nei, M. 1987. The neighbor-joining method: A new method for reconstructing phylogenetic trees. Mol. Biol. Evol. 4 406–425. [DOI] [PubMed] [Google Scholar]
- Sali, A. and Blundell, T.L. 1993. Comparative protein modelling by satisfaction of spatial restraints. J. Mol. Biol. 234 779–815. [DOI] [PubMed] [Google Scholar]
- Schertler, G.F., Villa, C., and Henderson, R. 1993. Projection structure of rhodopsin. Nature 362 770–772. [DOI] [PubMed] [Google Scholar]
- Shi, L. and Javitch, J.A. 2002. The binding site of aminergic G protein-coupled receptors: The transmembrane segments and second extracellular loop. Annu. Rev. Pharmacol. Toxicol. 42 437–467. [DOI] [PubMed] [Google Scholar]
- Silvente-Poirot, S. and Wank, S.A. 1996. A segment of five amino acids in the second extracellular loop of the cholecystokinin-B receptor is essential for selectivity of the peptide agonist gastrin. J. Biol. Chem. 271 14698–14706. [DOI] [PubMed] [Google Scholar]
- Singer, M.S. 2000. Analysis of the molecular basis for octanal interactions in the expressed rat 17 olfactory receptor. Chem. Senses 25 155–165. [DOI] [PubMed] [Google Scholar]
- Singer, M.S., Oliveira, L., Vriend, G., and Shepherd, G.M. 1995a. Potential ligand-binding residues in rat olfactory receptors identified by correlated mutation analysis. Receptors Channels 3 89–95. [PubMed] [Google Scholar]
- Singer, M.S., Shepherd, G.M., and Greer, C.A. 1995b. Olfactory receptors guide axons. Nature 377 19–20. [DOI] [PubMed] [Google Scholar]
- Singer, M.S., Weisinger-Lewin, Y., Lancet, D., Shepherd, G.M., Floriano, W.B., Vaidehi, N., and Goddard 3rd, W.A. 1996. Positive selection moments identify potential functional residues in human olfactory receptors. Receptors Channels 4 141–147. [PubMed] [Google Scholar]
- Thompson, J.D., Gibson, T.J., Plewniak, F., Jeanmougin, F., and Higgins, D.G. 1997. The CLUSTAL_X windows interface: Flexible strategies for multiple sequence alignment aided by quality analysis tools. Nucleic Acids Res. 25 4876–4882. [DOI] [PMC free article] [PubMed] [Google Scholar]
- Vaidehi, N., Floriano, W.B., Trabanino, R., Hall, S.E., Freddolino, P., Choi, E.J., Zamanakos, G., and Goddard 3rd, W.A. 2002. Prediction of structure and function of G protein-coupled receptors. Proc. Natl. Acad. Sci. 99 12622–12627. [DOI] [PMC free article] [PubMed] [Google Scholar]
- Wu, T.T. and Kabat, E.A. 1970. An analysis of the sequences of the variable regions of Bence Jones proteins and myeloma light chains and their implications for antibody complementarity. J. Exp. Med. 132 211–250. [DOI] [PMC free article] [PubMed] [Google Scholar]
- Young, J.M., Friedman, C., Williams, E.M., Ross, J.A., Tonnes-Priddy, L., and Trask, B.J. 2002. Different evolutionary processes shaped the mouse and human olfactory receptor gene families. Hum. Mol. Genet. 11 535–546. [DOI] [PubMed] [Google Scholar]
- Zhang, X. and Firestein, S. 2002. The olfactory receptor gene superfamily of the mouse. Nat. Neurosci. 5 124–133. [DOI] [PubMed] [Google Scholar]