Abstract
We describe expression, purification, and characterization of three site-specific mutants of recombinant human stefin B: H75W, P36G, and P79S. The far- and near-UV CD spectra have shown that they have similar secondary and tertiary structures to the parent protein. The elution on gel-filtration suggests that recombinant human stefin B and the P36G variant are predominantly monomers, whereas the P79S variant is a dimer. ANS dye binding, reflecting exposed hydrophobic patches, is highest for the P36G variant, both at pH 5 and 3. ANS dye binding also is increased for stefin B and the other two variants at pH 3. Under the chosen conditions the highest tendency to form amyloid fibrils has been shown for the recombinant human stefin B. The P79S variant demonstrates a longer lag phase and a lower rate of fibril formation, while the P36G variant is most prone to amorphous aggregation. This was demonstrated by ThT fluorescence as a function of time and by transmission electron microscopy.
Keywords: amyloid-fibrils, circular dichroism (CD), cystatins, conformational disease, domain-swapped dimer, proline mutants, protein folding
Cysteine proteinase inhibitor human stefin B (Turk and Bode 1991, Turk et al. 2001) is a protein of molecular mass 11 kD. It contains no disulphide bonds, in contrast to egg-white cystatin of molecular mass of 13 kD, which possesses two disulphide bonds. It was first purified from a human source (Brzin et al. 1983), then cloned and expressed in Escherichia coli in high yield (Jerala et al. 1988, 1994). The 3D structures of stefin B in complex with papain (Stubbs et al. 1990) and of stefin A in complex with cathepsin H (Jenko et al. 2003) have been determined by X-ray diffraction. The solution structure of free stefin A has also been determined by heteronuclear NMR (Martin et al. 1995).
Human stefin B is an inhibitor of several papain-family cysteine proteases, the lysosomal cathepsins. Stefin B (cystatin B) was also shown as part of a multiprotein complex of unknown function, existing predominantly in the cerebellum (Di Giamo et al. 2002). In studies with stefin B deficient mice, it has been demonstrated that lack of this protein is associated with signs of cerebellar granular cells apoptosis, ataxia, and myoclonus (Pennacchio et al. 1998), and that genes involved in activation of glial cells are overexpressed (Lieuallen et al. 2001). An inherited progressive myoclonus epilepsy of the Unverricht-Lundborg type has previously been shown to result from mutations in the stefin B (cystatin B) gene leading to lack of the protein (Pennacchio et al. 1996). It has been shown that reduced stefin B (cystatin B) activity correlates with enhanced cathepsins B, L, and S activities (Rinne et al. 2002).
We have been studying the stability and folding properties of stefins (Žerovnik et al. 1992a,b, 1997a,b, 1998a,b, 1999) and their mutants (Kenig et al. 2001). To probe the role of proline residues in the slow phases of refolding (Žerovnik et al. 1998a,b, 1999) the two prolines of stefin B at sites 36 and 79, which are glycine and serine, respectively, in stefin A, were exchanged. To be able to follow folding reactions by tryptophan fluorescence, in addition to tyrosine fluorescence, His at site 75 was exchanged for a Trp. Figure 1 ▶ shows the ribbon structure of human stefin B with the mutated amino acids labeled.
Figure 1.
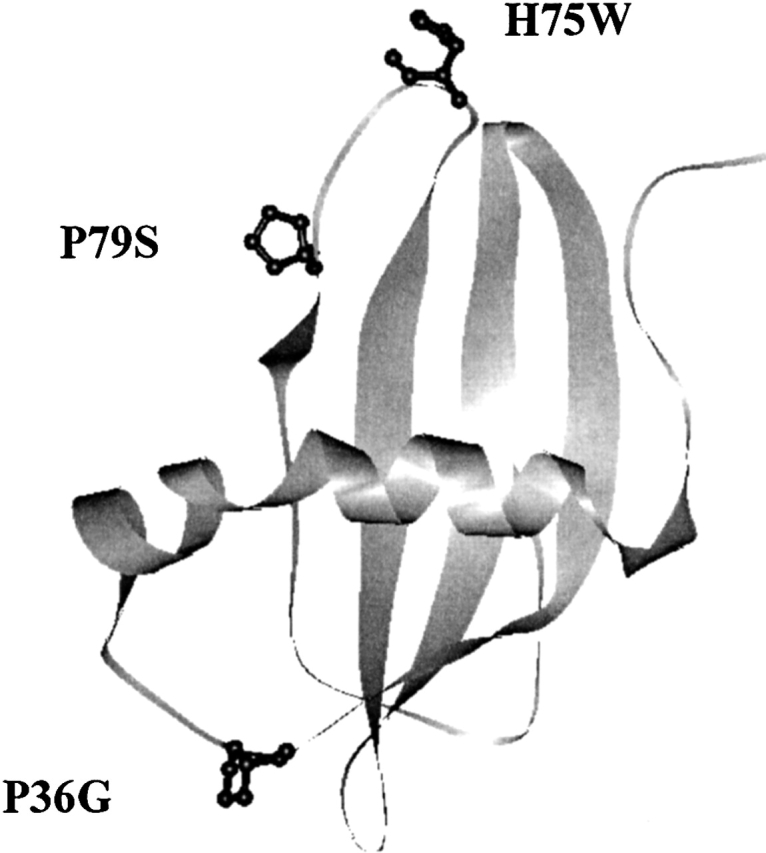
Three-dimensional structure of human stefin B obtained by using RasMol viewer. The coordinates were taken from PDB. The positions of the mutant residues are marked. P36 is in the first loop between the N-terminal α-helix and the first strand; H75 and P79 are placed in the middle and at the end of the third loop, respectively, which equals the second papain-binding loop (Stubbs et al. 1990).
Domain-swapped dimers have been demonstrated in the homologous inhibitors stefin A and cystatin C (Jerala and Žerovnik 1999; Janowski et al. 2001; Staniforth et al. 2001), which may have a role in amyloid fibril formation of this family of proteins (Staniforth et al. 2001). Recently, it has been shown that recombinant human stefin B is prone to form amyloid fibrils under mildly denaturing conditions (Žerovnik et al. 2002a,b,c).
To characterize P36G, P79S, and H75W site-specific mutants of the recombinant human stefin B, we have measured their CD spectra in the far- and near-UV regions, thermal and urea stability, oligomeric state, and dyes binding. ANS was used to show acid-induced molten globule state(s) and ThT was used to measure the propensity to form amyloid fibrils. To observe amyloid fibrils in protein aggregates, transmission electron microscopy (TEM) was used.
Results
Expression and purification
To get a high level of expression for the mutant proteins, the BL21(DE3) pLysS strain of Escherichia coli was used. In the case of the P36G variant, the yield of expression was much higher in BL21(DE3) strains than in BL21(DE3) pLysS; therefore, the former was used for this variant.
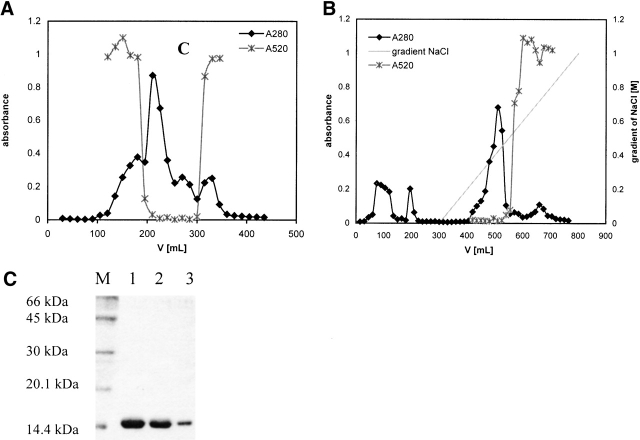
The first step of purification was gel filtration on Sephacryl-100. In Figure 2A ▶, the elution profile of the H75W variant is shown as an example. Gel filtration alone was not sufficient to obtain pure mutant proteins. Cation exchange chromatography using SP Sepharose fast flow (Fig. 2B ▶) was performed next, at pH 6.05 in a phosphate buffer (see Materials and Methods). Higher pH values (6.3 and 6.5) were also tried, but the mutant proteins did not bind to the column. After elution from the column, pure folded mutant proteins were obtained. The purity of the mutant proteins was confirmed by SDS-PAGE (Fig. 2C ▶).
Figure 2.
(A) Gel-filtration of the H75W variant of recombinant human stefin B using Sephacryl-100 size-exclusion chromatography (SEC) column. Protein content was followed at 280 nm (filled diamonds, black line). Fractions with inhibitory activity against papain were collected and used in additional purification steps. (x) Represents inhibitory activity of the mutant H75W. (B) Cation exchange chromatography of the H75W variant of recombinant human stefin B on a SP-Sepharose fast flow column. Protein content was followed at 280 nm (black line, filled diamonds). Fractions with inhibitory activity against papain (x) were pooled and used for further application. (C) SDS-PAGE analysis of the purified site-specific mutants of the recombinant human stefin B after cation exchange chromatography. Lane 1, P36G; lane 2, P79S; lane 3, H75W; and lane M, molecular mass markers (kD).
Oligomeric state of the recombinant proteins
Analytical gel filtration was used to obtain elution volumes for the recombinant human stefin B and the three variants. Recombinant human stefin A monomer and dimer were used as internal standards. Stefin B and P36G eluted mainly as monomers. (Table 1). In contrast, P79S eluted at exactly the same position as stefin A domain-swapped dimer. This latter was obtained by heating the protein (Jerala and Žerovnik 1999). Anomalous retention of the H75W variant was observed at an elution volume of over 12 mL. Nonspecific interaction with the column matrix may be an explanation for this observation.
Table 1.
Characteristic molecular data
| Protein | A1 mg/mL | Mr | MS | % mon | % dim |
| Stefin B | 0.48 | 11,028 | / | 70 | 30 |
| P36G | 0.54 | 11,117 | 11,116.7 | 75 | 25 |
| H75W | 0.96 | 11,206 | 11,205.6 | / | / |
| P79S | 0.50 | 11,147 | 11,147.0 | 100 |
Specific extinction coefficients (A1 mg/mL) and relative molecular masses (Mr) of the recombinant human stefin B (C3S) and the three variants: P36G, H75W, and P79S. Mr were calculated (see text); MS were determined by ES MS. In the last two columns the percentages of monomers and dimers are given, respectively. The volume of elution (Ve) on the Bio-Prep SE (Biorad) column was 9.3 ± 0.1 mL for the monomer, and was 8.2 ± 0.1 mL for the dimer, stefin A, taken as a standard.
CD spectra
Far- and near-UV CD spectra were recorded at 25°C. They show that the mutant proteins have similar secondary and tertiary structures to the recombinant human stefin B, and are therefore correctly folded. The Tyr peak in near-UV CD spectra (Fig. 3A ▶) of all the variantsis at the same position, at 275 nm. Surprisingly, no additional Trp peaks are observed for the H75W variant. Due to lowered intensity the Trp contribution to CD might be of different sign. In the far-UV CD spectra (Fig. 3B ▶) all three variants and stefin B show characteristic spectra for α/β proteins. The minimum for stefin B, P79S, and P36G is at 225 nm and for H75W it is shifted to 223 nm. The minimum at 225 nm could be due to strong contribution of tyrosine (aromatic) CD to the peptide region (Manning and Woody 1989). The difference in intensity in the far-UV CD spectra is repeatably observed, and does not fall within experimental error.
Figure 3.
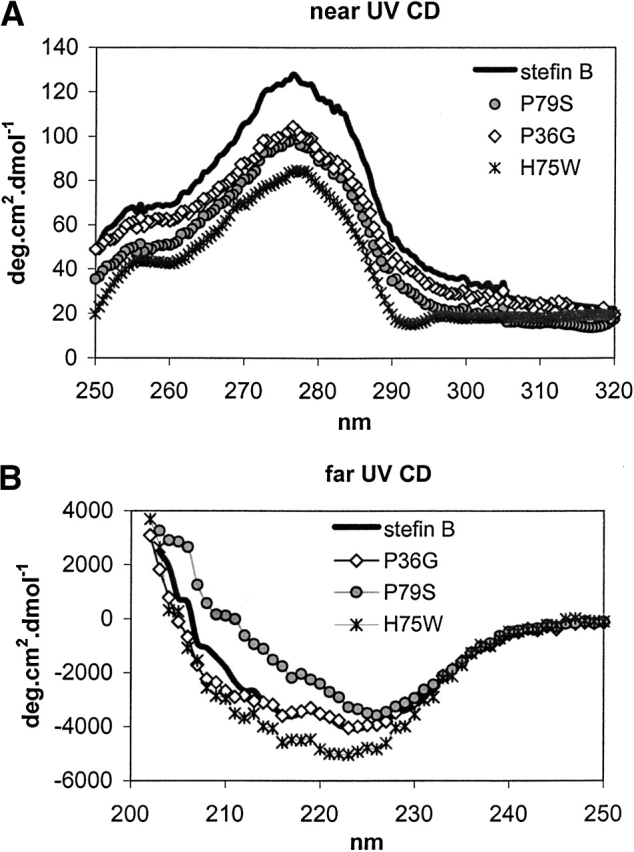
(A) Near-UV CD spectra from 320 to 250 nm. Mean residue weight (MRW) ellipticity was calculated using exact Mr and calculated extinction coefficients (see Table 1). (B) Far-UV CD spectra from 250 nm to 203 nm. Mean residue weight (MRW) ellipticity was calculated using exact Mr and calculated extinction coefficients (see Table 1).
Urea denaturation
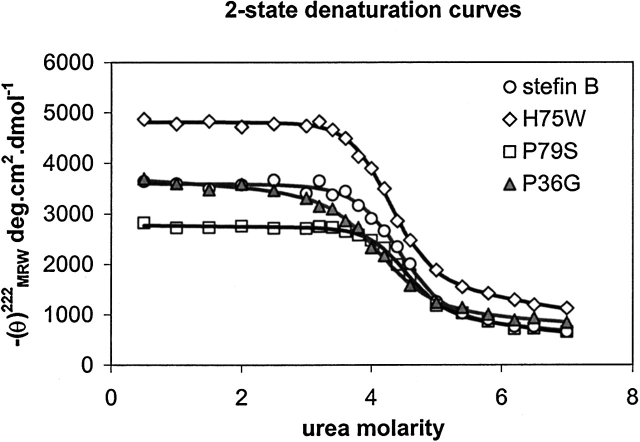
In Figure 4 ▶, experimental CD data points at 222 nm as a function of urea concentration are shown, together with the calculated curves. The curves have been calculated by taking a two-state approximation (Santoro and Bolen 1988) and the thermodynamic parameters are given in Table 2. From Table 2 it follows that the order of stability is: P36G < stB ~ H75W < P79S, which is in accordance with thermal denaturation data (not shown).
Figure 4.
Urea denaturation curves of the recombinant human stefin B and the site-specific mutants: P79S, P36G, and H75W. Protein concentration was 34 μM. The CD data at 222 nm were measured at 25°C after equilibration for at least 16 h. Calculated curves were fit to a two-state transition, according to Santoro and Bolen (1988).
Table 2.
Stability data
| Protein | cm [M]a | ΔG°N-U [kJ/mole]b | mb [kJ/Mmole] | Tm |
| P36G | 4.12 | −24.9 | 6.06 | 62c |
| Stefin B | 4.4 | −30.6 | 6.91 | 64 ± 1 |
| H75W | 4.3 | −33.0 | 7.76 | 66c |
| P79S | 4.5 | −37.9 | 8.42 | 67 ± 1 |
Urea denaturation for the recombinant human stefin B and the three variants P36G, H75W, and P79S has been measured (Fig. 4 ▶). The denaturation curves have been analysed by using two-state approximation (Santoro and Bolen 1988). Melting temperatures have been estimated as the midpoints of thermal denaturation transitions. They were complicated due to protein aggregation in case of H75W and P36G.
acm values (urea molarity at the midpoint of denaturation) were determined from the best fit to a two-state transition as described (Jackson et al. 1993).
b ΔG°N-U and m values were determined by fitting each data set to a two-state unfolding transition (Santoro and Bolen 1988). Errors are around 10%.
c Taken at the onset of aggregation.
Dye binding
Recombinant human stefin B and the three variants were first compared for ANS binding. It has been shown previously that recombinant human stefin B undergoes a conformational change to a typical molten globule at pH around 3, which binds ANS (Žerovnik et al. 1992a, 1997). Native protein at pH 6 does not bind ANS. ANS binding to stefin B and the variants was examined after 24 h of equilibration at pH 6.2, 4.8, and 3.3. At pH 4.8, 10% TFE (Fig. 5A ▶) increased emission was observed only for the P36G variant, which also visibly precipitated. Increased emission of ANS dye fluorescence was observed for all the proteins at pH 3.3 (Fig. 5B ▶), with the highest value found for P36G, followed by stefin B, P79S, and H75W.
Figure 5.
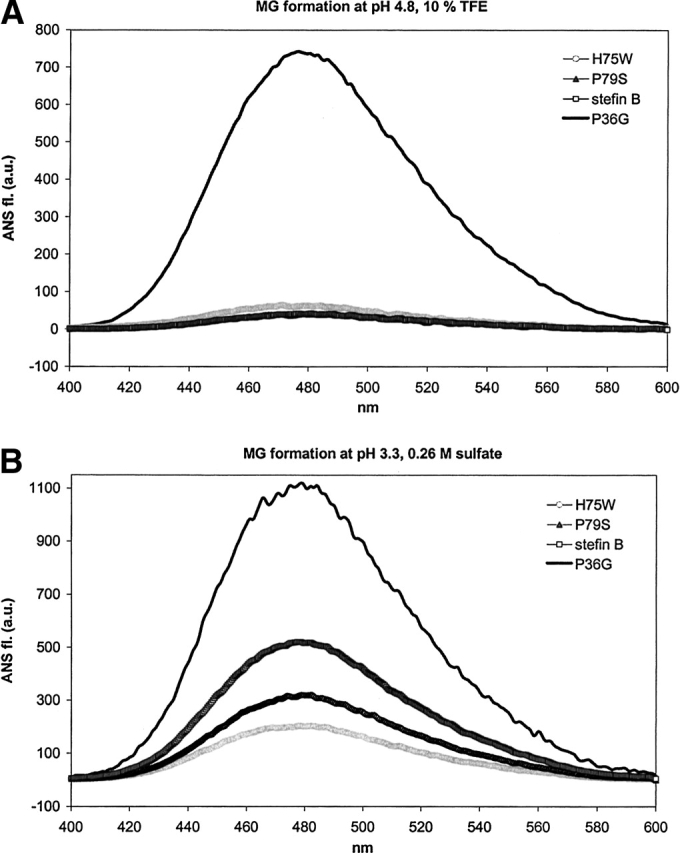
(A,B) ANS dye binding/fluorescence to recombinant human stefin B and the three variants: P36G, H75W, and P79S in two solvents. Protein concentration was 5.5 μM and the molar ratio of ANS to protein was 50 : 1. MG in the title stands for molten globule. (A) Solvent of pH 4.8, 10% TFE. (B) Solvent of pH 3.3, 0.26 M sulfate. The calculated thermodynamic parameters are given in Table 2.
The transition to the molten globule state at pH from 3 to 3.5 correlates with decreased protein stability. Thermal and urea stabilities of P36G and P79S mutants compared to stefin B have been measured by CD (not shown and Fig. 4 ▶). P36G was found less stable and P79S more stable than stefin B, which is in line with the order of ANS fluorescence increase (Fig. 5B ▶).
Another dye, thioflavin T, was used to probe fibril formation at three pH values: pH 6.2, 4.8, and 3.3. Appearance of the amyloid-like fibrils was followed in time over 4 weeks in two solvents, which promote amyloid fibril formation by recombinant human stefin B (Žerovnik et al. 2002a,b,c). In Figure 6A ▶, fibril growth at pH 4.8, 10% TFE, is shown. After 900 h, the highest rate and amount of fibril formation is seen with the recombinant human stefin B. Before the growth phase a lag phase of about 200 h is observed, which is typical for such processes. The P79S variant follows the same behavior with a prolonged lag phase of 450 h. The P36G variant behaves unusually as it immediately exhibits an increased ThT fluorescence with no further change. The H75W lower tendency to form amyloid fibrils in comparison to stefin B might be an effect of lower protein concentration taken for this particular experiment (keeping equal A280).
Figure 6.
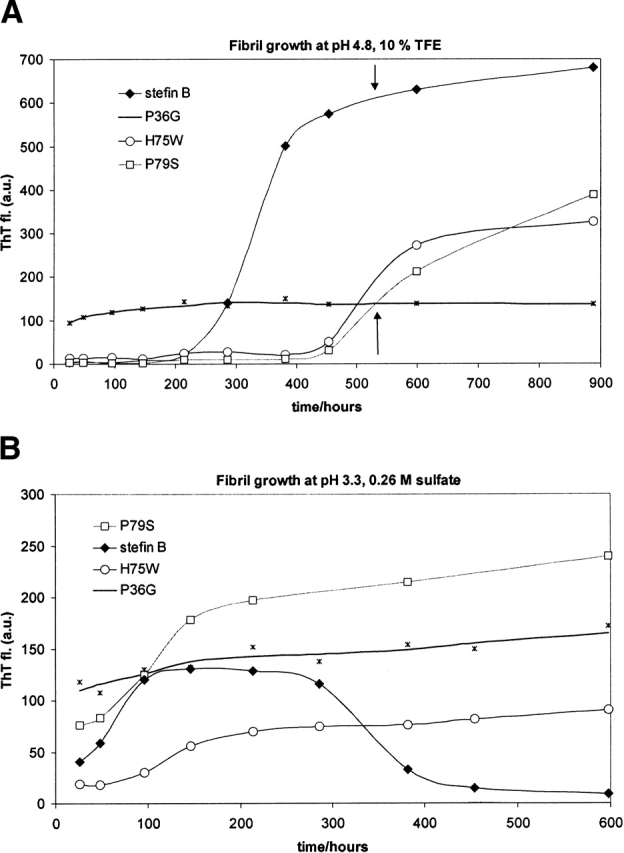
(A, B) Time course of ThT dye binding/fluorescence for recombinant human stefin B and the three variants: P36G, H75W, and P79S. Initial protein concentration was 34 μM. ThT stock solution was 15 μM, dissolved in a pH 7.5 buffer (Materials and Methods). After 10-fold dilution for the assay, the protein to ThT molar ratio was 1 : 4. (A) Fibril growth in solvent 7 (pH 4.8, 10% TFE). (B) Fibril growth in solvent 1 (pH 3.3, 0.26 M sulfate).
In Figure 6B ▶, fibril growth at pH 3.3, 0.26 M sulfate is shown. In this solvent, where all the proteins transform into a molten globule state (Fig. 5B ▶), again the highest rate is seen for the recombinant human stefin B. Nevertheless, the final amount of the fibrils is higher for the P79S variant. Stefin B fibrils seem to disintegrate with time (or the decrease in ThT fluorescence is due to other effect such as aggregation). For the P36G variant, similar behavior as before is observed, with an immediate increase of ThT fluorescence and no typical lag and growth phases.
TEM images
It has been shown by others as well as by ourselves that ThT fluorescence correlates with actual amyloid fibril appearance as observed by transmission electron microscopy (TEM). Protein fibrils’ samples were taken for TEM analysis at 3 weeks time of growth at pH 4.8 (see arrows in Fig. 6A ▶) and the results are presented in Figures 7A–F ▶.
Figure 7.
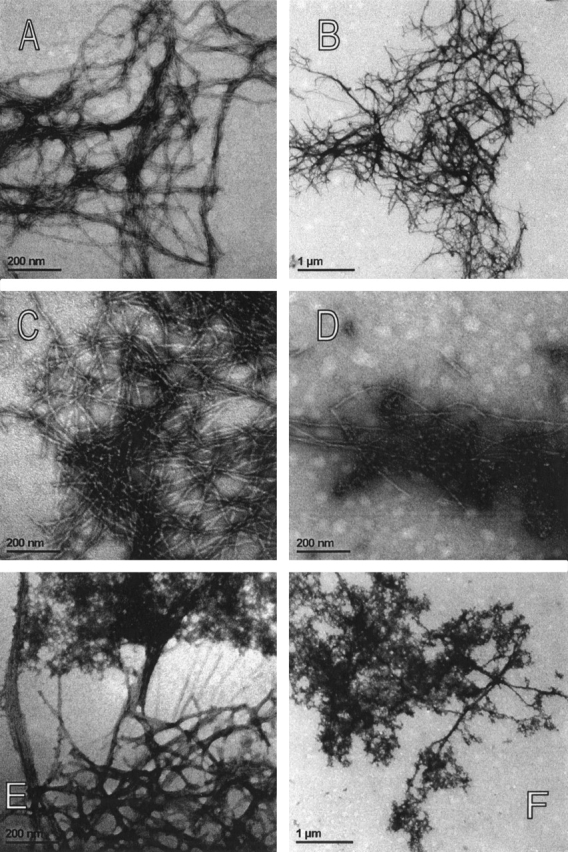
(A–F) TEM images of the amyloid-fibrils and the amorphous aggregates. Protein concentration was 34 μM. (A,B) Recombinant human stefin B at lower and higher magnification. (C,D) P79S variant. (C) P79S amyloid fibrils and (D) granular aggregates. (E,F) P36G variant. (E) Extension of amorphous aggregate into smeared fibrils. (F) Amorphous aggregates.
In Figure 7A and B ▶, TEM images of the recombinant human stefin B are shown. The amyloid fibrils can clearly be resolved. For more clarity they are shown in two magnifications. At this point in time the fibril growth by stefin B has reached a plateau (Fig. 6A ▶), and the mature fibrils are observed with no granular aggregates left. This contrasts the situation with the P79S variant, which only started fibril growth after 3 weeks (arrows in Fig. 6A ▶). In Figure 7 ▶, C and D, it can be seen that granular aggregates merge with the growing fibrils. This is seen especially well in Figure 7D ▶.
In Figure 7 ▶, E and F, the morphology of the P36G aggregate can be observed. It should be noted that this variant exhibited a rather extraordinary behavior in ThT fluorescence (previous section). A very fast increase of ThT fluorescence, which persisted at rather low intensity was observed (Fig. 6A,B ▶). In TEM images an amorphous aggregate and a kind of fibrils are seen (Fig. 7F ▶, at lower magnification). A closer inspection (Fig. 7E ▶, at higher magnification), nevertheless, shows that the aggregate extends into somewhat less regular, smeared fibrils. The fibrillar component can explain the observed increase in ThT fluorescence.
Discussion
It is not clear at this moment exactly how protein stability and folding/unfolding rates influence the process of amyloid fibril formation. Our studies confirm observations made by some other authors before (Kelly 1996; McParland et al. 2000; Dobson 2001) that protein stability and amyloid fibril formation are inversely correlated.
We have observed that the trend for stability: P79S > wt > P36G (Fig. 4 ▶; Table 2), is the opposite of that of ANS binding (Fig. 5 ▶) and the kinetics by ThT fluorescence (Fig. 6 ▶). Nevertheless, some details are worth discussing. It seems that protein stability, which is higher for the P79S variant than for stefin B (Fig. 4 ▶; Table 2) indeed prolongs the lag phase and reduces the rate as well as the amount of fibril growth (Fig. 6A ▶). This could be explained if the events of global unfolding needed for preamyloidic conformational change (Goers et al. 2002) would become more rare. On the other side, protein unstability, which leads to ANS binding (Fig. 5 ▶), and is highest for the P36G variant, does not necessarily lead to regular fibrils. Rather, amorphous aggregates (with some traces of the fibrils) form (Fig. 7E,F ▶), with no further potential for fibril growth.
In line with the observations of some other authors, structural aspects of the protein sequence appear to be a strong determinant also (Chiti et al. 2002; Ventura et al. 2002; Jones et al. 2003). Prolines play an important role in domain swapping, as they control the rigidity of loops between secondary structure elements. The specific role of the two prolines in human stefin B should also be considered.
The first, P36 (Fig. 1 ▶) is at the end of the α-helix. It is glycine in stefin A. In stefin B, it may act as a helix breaker, which otherwise would continue to residue 44 (secondary structure prediction algorithms). If such a residue were exchanged, a nonnative α-helical intermediate could result. However, experimentally at neutral pH, the secondary structure remained the same as for recombinant human stefin B (Fig. 3B ▶). For this variant, exposure of hydrophobic patches observed by ANS binding/fluorescence is the highest (Fig. 5A,B ▶). It is speculated that transformation to a molten globule state leads to amorphous aggregation, rather than regular amyloid fibril formation (Fig. 7E,F ▶). With stefin B itself less regular (more glued) fibrils have been observed starting from the molten globule state (Žerovnik et al. 2002c).
The second proline, P79, is situated at the end of the third loop, preceding strand 4. Its role in forming a domain-swapped dimer is surprising. The domain-swapped dimer studied for cystatin C (Janowski et al. 2001) and for stefin A (Staniforth et al. 2001) swap strands 2 and 3. It does not appear that dimerisation of P79S would influence fibril formation. The P79S mutant does indeed show an extended lag phase (Fig. 6A ▶), otherwise the process of amyloid fibril formation is similar to that observed for recombinant human stefin B (Žerovnik et al. 2002a,b,c). In the first stages of fibril growth and in the lag phase granular aggregates predominate, composed of annular structures, which later transform into mature fibrils (Fig. 7D ▶).
In conclusion, our study adds further evidence to the growing notion that partial unfolding occurs prior to amyloid fibril formation, and that a decreased stability of a protein can enhance its tendency to form amyloid fibrils (Kelly 1996; McParland et al. 2000; Dobson 2001). Somewhat contrasting is our finding that very low stability (in our case of the P36G variant) may lead to precursor states, which aggregate “too fast,” and thus do not allow proper amyloid fibril formation.
Materials and methods
Materials
All chemicals were at least of analytical grade. The irreversible inhibitor E-64 (L-3-carboxy-trans-2,3-epoxypropyl-L-leucylamido[4-guanidino] butane) was purchased from the Peptide Research Institute (Japan). The chromogenic substrate Z-Phe-Arg-pNA (benzyloxycarbonyl-phenylalanine-arginine-p-nitroanilide) was from Bachem. Dithiothreitol, EDTA (ethylenediaminetetraacetic acid) and a twice-crystallized enzyme papain were purchased from Sigma. To prevent enzyme inactivation, papain used in the kinetic studies was further purified and protected with MMTS (methyl methane thiosulfonate; Sigma).
2,2,2-Trifluoroethanol (TFE) was from Fluka, 99% pure. 1,Anilino-naphthalene 8-sulfonate (ANS) was purchased at SERVA. Thioflavine T (ThT) was from Aldrich. Solvents were prepared with double-distilled water and filtered through 0.22-μm filters.
Preparing site-specific mutants
The starting protein we use for mutagenesis is recombinant human stefin B, cloned in 1988 (Jerala et al. 1988). This recombinant protein, often called simply “stefin B,” has C3 replaced by a serine. That the protein is active and folded is best shown by 3D structure in complex with papain (Stubbs et al. 1990).
Mutagenesis was performed by PCR reaction on Perkin-Elmer Gene Amp PCR system 2400 using amplitaq polymerase. The mutant H75W was prepared using mutagen primer H75W (5′-CCAGTCTCTGCCGTGGGAGAACAAACCGCTG-3′), SB3 forward primer (5′-ATCGGGATCCTAGAAGTAGGTCAGCTCGTCG- 3′). As a template, a chemically synthesised gene for stefin B was used (Fig. 1B ▶; Jerala et al. 1988). The product of 100 bp was used as primer in the second PCR reaction together with primer SB3 back (5′ATCGCATATGATGTCTGGTGCTCCGTC- 3′).
Products of 100 and 300 bp have been demonstrated by electrophoresis in 2% and 1.5% agarose gels, respectively. The fragments were purified using QIAquick gel extraction protocol (Qiagen). The 300-bp fragment was ligated into pGEM T-easy vector (Promega). DNA sequence was confirmed using the Sanger method (Sanger et al. 1977) on a Perkin-Elmer ABI Prism 310 Genetic Analyzer.
For the mutant P79S the mutagen primer P79S (5′-CACGAGAACAAATCGCTGACTCTG-3′), and for the mutant P36G the mutagen primer (5′-CAACAAGAAATTCGGGGTTTTCAA AGCTG-3′) were used. All the other steps were the same as described above for the H75W mutant.
Expression in E. coli
Genes for the mutants H75W, P79S, and P36G were digested with NdeI and BamHI (New England Biolabs) and ligated into the pET11a expression vector, previously digested with the same enzymes. The pET11a vectors containing mutants H75W and P79S genes were transformed into BL21(DE3) pLysS strain of E. coli. In the case of P36S, expression in the BL21(DE3) pLysS strain was not successful; therefore, the BL21(DE3) strain was used instead. In this study 5 mL of the overnight culture was inoculated into 500 mL LB medium containing 100 μL/mL of amphicylin (Sigma) and 25 μL/mL of chloramphenicol (Sigma). The culture was incubated at 37°C up to OD600 0.6. IPTG was added to a final concentration of 1 mM. Three hours after induction cells were lysed as described (Jerala et al. 1988).
Purification procedure
Purified cell lysate was loaded on a Sephacryl 100 size-exclusion chromatography column (Amersham Pharmacia Biotech) equilibrated in 0.01 M phosphate buffer, pH 6.3, containing 0.12 M NaCl. Additional purification was done with SP Sepharose Fast Flow (Amersham Pharmacia Biotech) using 0.01 M phosphate buffer, pH 6.05. Recombinant proteins were eluted with a linear gradient of NaCl from 0 to 1 M, in the same buffer. Final protein solutions were dialyzed against 0.01 M phosphate buffer, 0.06 M NaCl, pH 6.05. The purity of the mutant proteins was confirmed by sodium dodecyl sulfate-polyacrylamide gel electrophoresis (SDS - PAGE). Activity against papain was determined as described (Barrett and Kirschke 1981).
Determination of protein concentration
The A280 value was extrapolated from the protein spectra scanned from 340 to 240 nm on a Perkin-Elmer UV/VIS spectrometer Lambda 18. The specific extinction coefficient and relative molecular mass (Mr) used in the calculations (Table 1) were obtained from the literature or calculated from the amino acid sequence (http://www.expasy.ch/tools/protparam.html). Control experiment was performed by ES MS, giving exactly the same masses as calculated for all the three variants (Table 1).
CD spectroscopy
Circular dichroism (CD) spectra were measured using an Aviv model 60 DS CD spectropolarimeter; 10 mm and 2 mm rectangular cells at bandwidths of 1 nm and 0.5 nm were used for the near- and far-UV CD spectra, respectively. Temperature was 25°C throughout. Data in the far UV were collected every 1 nm, using a scan rate of 0.25 nm/sec, and data in the near UV every 0.5 nm at a scan rate of 0.16 nm/sec. The protein concentrations were 0.707, 1.414, 1.128, and 1.40 mg/mL for the near-UV CD for H75W, P79S, P36G, and stefin B, respectively. For the far-UV CD protein concentrations were 0.354, 0.707, 0.524, and 0.702 mg/mL for H75W, P79S, P36G, and stefin B, respectively.
For thermal scans a 2-mm rectangular cell was used. Scanning was performed from 16° to 86°C with a step of 2°, using a rate of 1° per minute. Bandwidth was set at 1 nm. Recordings were done at two wavelengths simultaneously: 222 nm and 210 nm. Protein concentrations were such that A280 in the 1-cm cell was equal to 0.18.
For urea denaturation, solutions in various concentrations of urea were prepared at least 16 h before measurements. The quivette of 2-mm light path was used again. The temperature was 25°C. The values at 252 nm and 222 nm were read upon averaging the signal for 30 sec at each wavelength. Protein concentrations were kept at 34 μM for all the variants.
Analytical gel filtration
Biorad Bio-Prep SE 100/17 gel-filtration column was equilibrated in a phosphate 0.01-M buffer, 0.1 M NaCl, pH 6.05. The volumes of elution of the recombinant human stefin B and the three variants were compared to monomeric and dimeric forms of stefin A, a homologous protein of the same molecular mass. The volume of elution (Ve) on the column was in all cases 9.3 ± 0.1 mL for the monomer, and was 8.2 ± 0.1 mL for the dimer (Table 1).
Dye binding
ANS and ThT dyes were used to determine exposed hydrophobic patches (characteristic of molten globules) and presence of amyloid-like fibrils, respectively. Fluorescence was measured using a Perkin-Elmer model LS 50 B luminescence spectrometer. For the emission spectra of solutions containing ANS, the excitation wavelength was 379 nm and the spectra were recorded from 400 nm to 600 nm. For ThT emission, an excitation of 440 nm was used and spectra were recorded from 455 nm to 600 nm. In both cases the rate of recording was 180 nm/min. ANS stock solution in water (0.01 M) was diluted into corresponding buffers or protein solutions to obtain 275 μM ANS. A molar ratio of ANS to protein was 50 : 1. ThT was dissolved in a phosphate buffer (25 mM, 0.1 M NaCl, pH 7.5) at a concentration of 15 μM (A416 = 0.6). After mixing, the final concentration of ThT was 13.4 μM, and that of the protein was 3.4 μM.
Transmission electron microscopy (TEM)
Protein samples (15 μL of 34 μM protein solution) were applied on a Formvar and carbon-coated grid. After 10 min the sample was soaked away and stained with 1% uranyl acetate. Samples were observed with a Philips CM 100 transmission electron microscope operating at 80 kV. Images were recorded by Bioscan CCD camera Gatan, using Digital Micrograph software.
Acknowledgments
We thank Prof. Roger Pain for editing English. Dr. Veronika Stoka is acknowledged for help in activity measurements. This work was supported by a bilateral grant from the Ministry of Education, Science and Sport of the Republic of Slovenia and Federal Ministry of Education, Science, Culture and Sport of Bosnia and Herzegovina.
The publication costs of this article were defrayed in part by payment of page charges. This article must therefore be hereby marked “advertisement” in accordance with 18 USC section 1734 solely to indicate this fact.
Abbreviations
ANS, 1, anilino-naphthalene 8-sulfonate
ES MS, electrospray mass spectrometry
IPTG, isopropyl-β-d-thiogalactopyranoside
SEC, size-exclusion chromatography
TEM, transmission electron microscopy
TFE, 2,2,2-trifluoroethanol
ThT, thioflavin T
Article and publication are at http://www.proteinscience.org/cgi/doi/10.1110/ps.03270904.
References
- Barrett, A.J. and Kirschke, H. 1981. Cathepsin B, cathepsin H, and cathepsin L. Methods Enzymol. 80 535–561. [DOI] [PubMed] [Google Scholar]
- Brzin, J., Kopitar, M., Turk, V., and Machleidt, W. 1983. Protein inhibitors of cysteine proteinases. I. Isolation and characterization of stefin, a cytosolic protein inhibitor of cysteine proteinases from human polymorphonuclear granulocytes. Hoppe Seylers Z. Physiol. Chem. 364 1475–1480. [DOI] [PubMed] [Google Scholar]
- Chiti, F., Taddei, N., Baroni, F., Capanni, C., Stefani, M., Ramponi, G., and Dobson, C.M. 2002. Kinetic partitioning of protein folding and aggregation. Nat. Struct. Biol. 9 137–143. [DOI] [PubMed] [Google Scholar]
- Di Giamo, R., Riccio, M., Santi, S., Galeotti, C., Ambrosetti, D.C., and Melli, M. 2002. New insights into the molecular basis of progressive myoclonus epilepsy: A multiprotein complex with cystatin B. Hum. Mol. Gen. 11 2941–2950. [DOI] [PubMed] [Google Scholar]
- Dobson, C.M. 2001. The structural basis of protein folding and its links with human disease. Philos. Trans. R. Soc. Lond. B 356 133–145. [DOI] [PMC free article] [PubMed] [Google Scholar]
- Goers, J., Permyakov, S.E., Permyakov, E.A., Uversky, V.N., and Fink, A.L. 2002. Conformational prerequisites for α-lactalbumin fibrillation. Biochemistry 41 12546–12551. [DOI] [PubMed] [Google Scholar]
- Jackson, S.E., Moracci, M., elMasry, N., Johnson, C.M., and Fersht, A.R. 1993. Effect of cavity-creating mutations in the hydrophobic core of chymotrypsin inhibitor 2. Biochemistry 32 11259–11269. [DOI] [PubMed] [Google Scholar]
- Janowski, R., Kozak, M., Jankowska, E., Gzonka, Z., Grubb, A., Abrahamson, M., and Jaskolski, M. 2001. Human cystatin C, an amyloidogenic protein, dimerizes through three-dimensional domain swapping. Nat. Struct. Biol. 8 316–320. [DOI] [PubMed] [Google Scholar]
- Jenko, S., Dolenc, I., Guncar, G., Doberšek, A., Podobnik, M., and Turk, D. 2003. Crystal structure of stefin A in complex with cathepsin H: N-terminal residues of inhibitors can adapt to the active sites of endo- and exo-peptidases. J. Mol. Biol.. 326 875–885. [DOI] [PubMed] [Google Scholar]
- Jerala, R. and Žerovnik, E. 1999. Accessing the global minimum conformation of stefin A dimer by annealing under partially denaturing conditions. J. Mol. Biol. 291 1079–1089. [DOI] [PubMed] [Google Scholar]
- Jerala, R., Trstenjak, M., Lenarčič, B. and Turk, V. 1988. Cloning a synthetic gene for human stefin B and its expression in E. coli. FEBS Lett. 239 41–44. [DOI] [PubMed] [Google Scholar]
- Jerala, R., Kroon-Žitko, L., and Turk, V. 1994. Improved expression and evaluation of polyethyleneimine precipitation in isolation of recombinant cysteine proteinase inhibitor stefin B. Protein Expr. Purif. 5 65–69. [DOI] [PubMed] [Google Scholar]
- Jones, S., Manning, J., Kad, N.M., and Radford, S.E. 2003. Amyloid-forming peptides from β(2)-microglobulin—Insights into the mechanism of fibril formation in vitro. J. Mol. Biol. 325 249–257. [DOI] [PubMed] [Google Scholar]
- Kelly, J.W. 1996. Alternative conformations of amyloidogenic proteins govern their behavior. Curr. Opin. Struct. Biol. 6 11–17. [DOI] [PubMed] [Google Scholar]
- Kenig, M., Jerala, R., Kroon-Žitko, L., Turk, V., and Žerovnik, E. 2001. Major differences in stability and dimerization properties of two chimeric mutants of human stefins. Proteins 42 512–522. [PubMed] [Google Scholar]
- Lieuallen, K., Pennacchio, L.A., Park, M., Myers, R.M., and Lennon, G.G. 2001. Cystatin B-deficient mice have increased expression of apoptosis and glial activation genes. Hum. Mol. Genet. 10 1867–1871. [DOI] [PubMed] [Google Scholar]
- Manning, M.C. and Woody, R.W. 1989. Theoretical study of the contribution of aromatic side chains to the circular dichroism of basic bovine pancreatic trypsin inhibitor. Biochemistry 28 8609–8613. [DOI] [PubMed] [Google Scholar]
- Martin, J.R., Craven, C.J., Jerala, R., Kroon-Žitko, L., Žerovnik, E., Turk, V., and Waltho, J.P. 1995. The three-dimensional solution structure of human stefin A. J. Mol. Biol. 246 331–343. [DOI] [PubMed] [Google Scholar]
- McParland, V.J., Kad, N.M., Kalverda, A.P., Brown, A., Kirwin-Jones, P., Hunter, M.G., Sunde, M., and Radford, S.E. 2000. Partially unfolded states of β(2)-microglobulin and amyloid formation in vitro. Biochemistry 39 8735–8746. [DOI] [PubMed] [Google Scholar]
- Pennacchio, L.A., Lehesjoki, A.E., Stone, N.E., Willour, V.L., Virtaneva, K., Miao, J., D’Amato, E., Raminez, L., Faham, M., Koskiniemi, M., et al. 1996. Mutations in the gene encoding cystatin B in progressive myoclonus epilepsy (EPM1). Science 271 1731–1734. [DOI] [PubMed] [Google Scholar]
- Pennacchio, L.A., Bouley, D.M., Higgins, K.M., Scott, M.P., Noebels, J.L., and Myers, R.M. 1998. Progressive ataxia, myoclonic epilepsy and cerebellar apoptosis in cystatin B-deficient mice. Nat. Genet. 20 251–258. [DOI] [PubMed] [Google Scholar]
- Rinne, R., Jarvinen, S.P., and Lehesjoki, A.E. 2002. Reduced cystatin B activity correlates with enhanced cathepsin activity in progressive myoclonus epilepsy. Ann. Med. 34 380–385. [DOI] [PubMed] [Google Scholar]
- Sanger, F., Nicklen, S., and Coulson, A.R. 1977. DNA sequencing with chain-terminating inhibitors. Proc. Natl. Acad. Sci. 74 5463–5467. [DOI] [PMC free article] [PubMed] [Google Scholar]
- Santoro, M.M. and Bolen, D.W. 1988. Unfolding free energy changes determined by the linear extrapolation method. 1. Unfolding of phenylmethanesulfonyl α-chymotrypsin using different denaturants. Biochemistry 27 8063–8068. [DOI] [PubMed] [Google Scholar]
- Staniforth, R.A., Giannini, S., Higgins, L.D., Conroy, M.J., Hounslow, A.M., Jerala, R., Craven, C.J., and Waltho, J.P. 2001. Three-dimensional domain swapping in the folded and molten-globule states of cystatins, an amyloid-forming structural superfamily. EMBO J. 20 4774–4781. [DOI] [PMC free article] [PubMed] [Google Scholar]
- Stubbs, M.T., Laber, B., Bode, W., Huber, R., Jerala, R., Lenarčič, B., and Turk, V. 1990. The refined 2.4 Å X-ray crystal structure of recombinant human stefin B in complex with the cysteine proteinase papain: A novel type of proteinase inhibitor interaction. EMBO J. 9 1939–1947. [DOI] [PMC free article] [PubMed] [Google Scholar]
- Turk, V. and Bode, W. 1991. The cystatins: Protein inhibitors of cysteine proteinases. FEBS Lett. 285 213–219. [DOI] [PubMed] [Google Scholar]
- Turk, V., Turk, B., and Turk, D. 2001. Lysosomal cysteine proteinases: Facts and opportunities. EMBO J. 20 4629–4633. [DOI] [PMC free article] [PubMed] [Google Scholar]
- Ventura, S., Lacroix, E., and Serrano, L. 2002. Insights into the origin of the tendency of the PI3–SH3 domain to form amyloid fibrils. J. Mol. Biol. 322 1147–1158. [DOI] [PubMed] [Google Scholar]
- Žerovnik, E., Lohner, K., Jerala, R., Laggner, P., and Turk, V. 1992a. Calorimetric measurements of thermal denaturation of stefins A and B; comparison to predicted thermodynamics of stefin B unfolding. Eur. J. Biochem. 210 217–221. [DOI] [PubMed] [Google Scholar]
- Žerovnik, E., Jerala, R., Kroon-Žitko, L., Pain, R.H., and Turk, V. 1992b. Intermediates in denaturation of a small globular protein, recombinant human stefin B. J. Biol. Chem. 267 9041–9046. [PubMed] [Google Scholar]
- Žerovnik, E., Jerala, R., Kroon-Žitko, L., Turk, V., and Lohner, K. 1997. Characterization of the equilibrium intermediates in acid denaturation of human stefin B. Eur. J. Biochem. 245 364–372. [DOI] [PubMed] [Google Scholar]
- Žerovnik, E., Virden, R., Jerala, R., Turk, V., and Waltho, J.P. 1998a. On the mechanism of human stefin B folding: I. Comparison to homologous stefin A. Influence of pH and trifluoroethanol on the fast and slow folding phases. Proteins 32 296–303. [PubMed] [Google Scholar]
- Žerovnik, E., Jerala, R., Virden, R., Kroon-Žitko, L., Turk, V., and Waltho, J.P. 1998b. On the mechanism of human stefin B folding: II. Folding from GuHCl unfolded, TFE denatured, acid denatured, and acid intermediate states. Proteins 32 304–313. [DOI] [PubMed] [Google Scholar]
- Žerovnik, E., Virden, R., Jerala, R., Kroon-Žitko, L., Turk, V., and Waltho, J.P. 1999. Differences in the effects of TFE on the folding pathways of human stefins A and B. Proteins 36 205–216. [PubMed] [Google Scholar]
- Žerovnik, E., Pompe-Novak, M., S̆karabot, M., Ravnikar, M.. Muševič, I., and Turk, V. 2002a. Human stefin B readily forms amyloid fibrils in vitro. Biochim. Biophys. Acta 1594 1–5. [DOI] [PubMed] [Google Scholar]
- Žerovnik, E., Zavašnik-Bergant, V., Kopitar-Jerala, N., Pompe-Novak, M., S̆karabot, M., Goldie, K., Ravnikar, M., Muševič, I., and Turk, V. 2002b. Amyloid fibril formation by human stefin B in vitro: Immunogold labelling and comparison to stefin A. Biol. Chem. 383 859–863. [DOI] [PubMed] [Google Scholar]
- Žerovnik, E., Turk, V., and Waltho, J.P. 2002c. Amyloid fibril formation by human stefin B: Influence of the initial pH-induced intermediate state. Biochem. Soc. Trans. 30 543–547. [DOI] [PubMed] [Google Scholar]


