

Abstract
Ionizable groups play critical roles in biological processes. Computation of pKas is complicated by model approximations and multiple conformations. Calculated and experimental pKas are compared for relatively inflexible active-site side chains, to develop an empirical model for hydration entropy changes upon charge burial. The modification is found to be generally small, but large for cysteine, consistent with small molecule ionization data and with partial charge distributions in ionized and neutral forms. The hydration model predicts significant entropic contributions for ionizable residue burial, demonstrated for components in the pyruvate dehydrogenase complex. Conformational relaxation in a pH-titration is estimated with a mean-field assessment of maximal side chain solvent accessibility. All ionizable residues interact within a low protein dielectric finite difference (FD) scheme, and more flexible groups also access water-mediated Debye-Hückel (DH) interactions. The DH method tends to match overall pH-dependent stability, while FD can be more accurate for active-site groups. Tolerance for side chain rotamer packing is varied, defining access to DH interactions, and the best fit with experimental pKas obtained. The new (FD/DH) method provides a fast computational framework for making the distinction between buried and solvent-accessible groups that has been qualitatively apparent from previous work, and pKa calculations are significantly improved for a mixed set of ionizable residues. Its effectiveness is also demonstrated with computation of the pH-dependence of electrostatic energy, recovering favorable contributions to folded state stability and, in relation to structural genomics, with substantial improvement (reduction of false positives) in active-site identification by electrostatic strain.
Keywords: protein electrostatics, pKas, ionization entropy, side-chain packing, active-site identification, structural genomics
Ionizable group interactions are important factors in various biological processes (Warshel 1981, 2003; Honig and Nicholls 1995; Warshel and Papazyan 1998; Simonson 2001), and are a focus of attempts to identify functional sites for structural genomics (Elcock 2001; Ondrechen et al. 2001). Grid-based continuum electrostatics methods, such as Finite Difference Poisson-Boltzmann (FDPB; Warwicker and Watson 1982; Klapper et al. 1986; Warwicker 1986) using a low protein-relative dielectric (typically ɛp = 4; Gilson and Honig 1986) have been applied to pKa calculations (Bashford and Karplus 1990). These can be useful when applied to regions with limited solvent accessibility (SA; Demchuk and Wade 1996; Warwicker 1998), but ɛp = 4 calculations based on a single conformer have been largely unreliable for overall pKa analysis. Generally ɛp = 20 performs better (Antosiewicz et al. 1994, 1996), presumably accounting to some degree for other factors (Schutz and Warshel 2001) such as conformational variation (Simonson and Perahia 1995), proton/hydrogen-bond network relaxation (Nielsen et al. 1999), or specific internal water binding (Fitch et al. 2002). Indeed, a Debye-Hückel (DH) model with water dielectric also gives reasonable agreement over-all for pKas, and for the pH dependence of folding energy when combined with a simple model for ionizable group interactions in the unfolded state (Warwicker 1999). A Tanford-Kirkwood model gives reasonable estimates for carboxylate pKas in ubiquitin (Sundd et al. 2002). As with FDPB/ɛp = 20, the DH and Tanford-Kirkwood models fail to generate the large ΔpKas often associated with functional groups (Warwicker 1998).
The problem of accounting for large and small ΔpKas in one scheme is being addressed with inclusion of conformational and proton configurational relaxation in ɛp = 4 calculations. Multiple conformers are generally sampled from molecular dynamics simulations (You and Bashford 1995; Zhou and Vijayakumar 1997; van Vlijmen et al. 1998; Koumanov et al. 2001; Gorfe et al. 2002), with some improvement in match to experiment and significant increase in computational requirement. A key issue is to address those conformational adjustments of most relevance to a pH titration. Multiconformation continuum electrostatics (MCCE) samples side-chain ionization and conformation (Alexov and Gunner 1997; Georgescu et al. 2002; Alexov 2003), yielding a pKa root-mean-square (RMS) error of 0.83. An approximation in this model is that all conformers are combined to produce a single dielectric boundary. A method that assigns higher or lower electrostatic screening functions, (applied to Coulomb potentials), according to the hydrophobicity/hydrophilicity of residue microenvironments performs well, giving an RMS error of 0.5 for a large pKa set (Mehler and Guarnieri 1999).
The current work also pursues two interaction schemes, the DH model that is effective for flexible groups, and FDPB/ɛp = 4, which can give large ΔpKas of functional interest, with combination in a framework of conformational relaxation. FD (for FDPB/ɛp = 4) interactions are always sampled for the experimental conformer, and DH interactions are selectively introduced as a mimic for relaxation from this conformer. Two examples illustrate this idea. First, a buried lysine, neutral at pH 7 due to dehydration (lower residue in Fig. 1 ▶). The DH model omits the Born term and underestimates such a ΔpKa, whereas FD with the Born term provides the required destabilization. Because DH would give a higher statistical weight than FD, a combined scheme must exclude DH and reflect the restricted conformation. Secondly (top of Fig. 1 ▶), in a relatively flexible salt bridge the Born contributions are balanced by favorable charge–charge interactions. For a pH shift that neutralizes one of the partners, without conformational relaxation FD will record a Born term for the remaining ionized group that is not balanced by charge–charge interactions (other than potential hydrogen bonds). The ionized partner is likely to seek a more solvent accessible conformation, reducing the Born energy penalty. Interactions in this water-dominated situation could be estimated by DH modeling of the salt bridge, as an alternative to FD calculations on a range of generated conformers.
Figure 1.

Schematic diagram of ionizable group relaxation with pH in two different environments. An upper salt bridge can alter hydration upon pH titration, while the lower basic group cannot (e.g., a lysine with a reduced pKa).
A mean-field algorithm is used to describe side-chain rotamer packing (Koehl and Delarue 1994; Cole and Warwicker 2002), and to define access to DH interactions, through assessment of maximal SA (SAmax) for each ionizable group over rotamer variation. The method, termed FD/DH, reproduces ΔpKas over a wide range, and is compared with other techniques. The contribution of ionizable groups to folded state stability is discussed, with FD/DH delivering overall stabilization in contrast to much FD/ɛp = 4 single conformer work. The utility of a distinction between flexible and buried groups is considered in the context of active-site finding for structural genomics, and with regard to automation of active-site subset selection for detailed electrostatic analysis (Nielsen and McCammon 2003).
An earlier empirical analysis of hydration entropy and pKa calculations (Warwicker 1997) has been extended with study of relatively buried ionizable groups in the FD/ɛp = 4 model, and comparison made to small molecule ionization entropies. It is concluded that pKa adjustments due to hydration entropy are relatively small, except in the case of cysteine. Changes in hydration entropy that can be important in binding energetics (Jung et al. 2002) are discussed in the framework of the empirical analysis.
Results and Discussion
Estimation of hydration entropy changes upon ionization and charge burial
A subset of ionizable groups with large ΔpKas and surrounding ionizations that can be reasonably assigned at a pH around the pKa of interest are studied, partitioning the analysis from the wider prediction of pH dependence (Table 1). Figure 2 ▶ shows that these groups are relatively buried in terms of subsequent FD/DH analysis (Fig. 3 ▶), and estimates of changes in hydration entropy are made with the single conformer FD/ɛp = 4 model. Polar hydrogen optimization is applied for the hydroxyl groups of serine and threonine. Tyrosine hydroxyls are included where the unionized form is used, which for entropic term modeling is in all calculations other than those of Figure 2C ▶. A previous study (Warwicker 1997) looked at carboxylate and thiolate groups in a range of SA environments, deriving differential hydration numbers upon ionization (Ns) of about 2 (carboxylate) and 6 (thiolate). Current work extends the analysis for groups with large ΔpKas, and includes polar hydrogen optimization.
Table 1.
Proteins and groups used for pKacalculations
| PDB ID | FD/DH gps | Ns group | Protein | Source |
| 4pti | 11 | — | trypsin inhibitor | bovine pancreas |
| 3icb | 10 | — | Calbindin | bovine intestine |
| 1b0d | 18 | E35 | Lysozyme | hen egg-white |
| 1pga | 13 | — | protein G | Streptococcus |
| 3rn3 | 15 | — | ribonuclease A | bovine pancreas |
| 2rn2 | 22 | — | ribonuclease H | Escherichia coli |
| 1a2p | 10 | — | Barnase | Bacillus amyloliquefaciens |
| 1ppf | 11 | — | ovomucoid inhibitor 3rd domain | turkey |
| 1xnb | 1 | E172 | Xylanase | Bacillus circulans |
| 9pap | 1 | C25 | Papain | papaya |
| 1a21 | 1 | C30 | DsbA (reduced) fructose 1,6-bisphosphate | Escherichia coli |
| 1ado | 1 | K229 | Aldolase | rabbit muscle |
| 1axt | 1 | K93 (H) | immunoglobulin/aldolase | mouse |
| 1gsd | 1 | Y9 | glutathione S-transferase A1-1 | human |
| 1nai | 1 | Y149 | UDP-galactose 4-epimerase | Escherichia coli |
| 2trx | — | C32 | thioredoxin | Escherichia coli |
| 1p2p | — | H48 | phospholipase A2 | porcine pancreas |
| 4cha | — | H57 | α-chymotrypsin | Bovine |
| 1163 | — | H31 | lysozyme (C54T, C97A mutant) | T4 phage |
FD/DH gps gives the number of ionisable groups used in FD/DH calculation. Ns group specifies those used in Ns derivation. Monomers were used in all cases (selecting the first subunit from crystal coordinates where required). For thioredoxin, a model of the reduced D26N mutant was derived from the oxidised wild-type structure. Details (e.g. inclusion of ligands) are given in the text.
Figure 2.

Active-site groups, with conformational restriction, used to derive Ns values for hydration entropy modification. The Born and Q–Q (interaction with background and other ionizable group charge), ΔpKa contributions are calculated components, which together with the experimental ΔpKa (Expt), and the fraction of the hydration shell buried in the protein relative to isolated amino acid (Vf), are used to derive Ns (see Materials and Methods). (A) Glutamic acid; (B) Cysteine; (C) Tyrosine; (D) Lysine.
Figure 3.
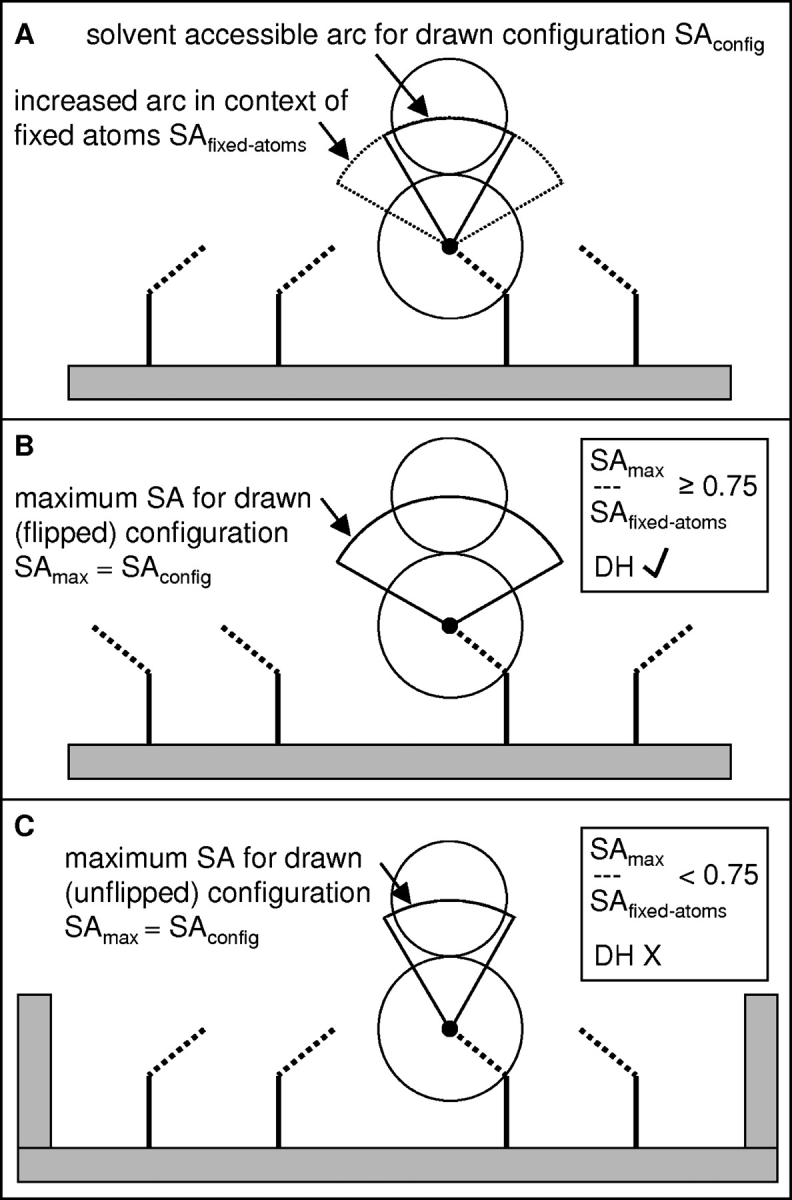
Schematic diagram for determination of access to DH interactions. (A) Solvent probing of a side chain gives two SA arcs according to whether probed in the context of the drawn rotamer set (SAconfig) or fixed atoms only (SAfixed-atoms). (B) A different rotamer set gives higher solvent accessibility, such that [SAmax/SAfixed-atoms] ≥ 0.75 and access to DH interactions is allowed. (C) In this case, the rotamer set of B is not possible, SA remains small, and DH interactions are disallowed.
Hydration entropy and pKas: Aspartic and glutamic acids, cysteine, and tyrosine
Bacillus circulans xylanase E172 has an elevated pKa (6.7; Joshi et al. 1997) that, along with E78 (pKa = 4.6), defines the pH optimum for hydrolysis. Calculated electrostatic interactions are shown for E172 in Figure 2A ▶. Ionization assignment for other groups was made with reference to measured pKas (Joshi et al. 1997), and with model compound pKas at neutral pH otherwise. H149 has a measured pKa of <2.3 and H156 of 6.7. The distance between carboxylate (172) and imidazole (156) groups is about 23 Å, and the protonation state of H156 makes no significant difference to the calculations. Modeled hydrogen bonds between E172 and N35, Y80 are shown in Figure 2A ▶. Discrepancy between the sum of calculated ΔpKa contributions and the measured ΔpKa, with a burial fraction (Vf) of 0.57, gives Ns = 0.7. A second calculation, with partially charged forms for ionized and neutral E172 and torsioning of the Y80 hydroxyl to point away from neutral E172, gives Ns = 1.9. Without Ns modification, partial charge analysis gives ΔpKa = 3.7 versus 2.8 for the net charge model and 2.3 experimentally. Both calculations qualitatively capture the pKa shift.
Hen egg white lysozyme is a well-known model for electrostatic calculations, particularly E35 (pKa = 6.1; Kuramitsu and Hamaguchi 1980). Figure 2A ▶ shows the restricted environment of E35 and the elements that give Ns = 1.5, again with qualitative agreement to the experiment without Ns modification (Warwicker 1997). If discrepancies in the carboxylate group calculations of Figure 2A ▶ are approximated as hydration entropy within the FD framework, then a related single Ns value is relatively small and positive (Table 2; Warwicker 1997).
Table 2.
Nsvalues for pKacalculations: derived with the hydration shell model
| Asp, Glu | Cys | Tyr | Lys | His | |
| Ns each site | 0.7, 1.5 | 4.5, 4.2, 4.9 | 1.4, 0.8 | 0.2, 2.0 | 2.0, 0.9, 3.1 |
| Ns average | 1.1 | 4.5 | 1.1 | 1.1 | 2.0 |
Ns calculation scheme given in Materials and Methods, and details of protein sites in Results and Discussion.
In contrast, cysteine residues with large ΔpKas require a high value of Ns to match experiment (Table 2; Warwicker 1997). Figure 2B ▶ shows the active site around papain C25 and H159, with a pKa of 3.3 for C25 (Noble et al. 2000). Oxygen atoms were removed from oxidized C25 in the crystal structure. Calculations were made with H159 protonated and carboxylates deprotonated. Of the two closest acidic groups, D158 has a pKa around 2.8 (Noble et al. 2000), and the mutation E50A in caricain has only a small affect on the pH dependence of activity (Ikeuchi et al. 1998).
Calculations (Fig. 2B ▶) with a reduced DsbA crystal structure (Guddat et al. 1998) give Ns = 4.2, where H60, E24, and E38 were assigned neutral (Warwicker 1998), and the measured C30 pKa is 3.4 (Grauschopf et al. 1995). A reduced model of the D26N mutant was made from oxidized, wild-type thioredoxin, uncoupling the similar pKas of C32 and D26, with C32 pKa = 7.5 (Chivers et al. 1997) and Ns = 4.9. Calculated Ns of 4.5, 4.2, and 4.9 imply significant discrepancies in FD/ɛp = 4 calculations of pKas for relatively buried cysteines, without the Ns term.
For tyrosine, the active-site residue Y9 of glutathione S-transferase A1–1 has a low pKa (8.1) in the substrate-free enzyme (Björnestedt et al. 1995). Calculations with a monomer from the dimeric crystal structure (Cameron et al. 1995) give Ns = 1.4 (Fig. 2C ▶). A pKa of 6.1 has been measured for Y149 in the active site of UDP-galactose-4-epimerase with NAD+ bound (Liu et al. 1997). Removing UDP, but not NAD+, from the crystal structure (Thoden et al. 1996) gives Ns = 0.8 (Fig. 2C ▶), with a strong interaction to the positively charged side chain of K153 and a hydrogen bond between the deprotonated Y149 side chain and a ribose hydroxyl group.
Hydration entropy and pKas: Lysine, histidine, and arginine
Figure 2D ▶ shows the environment of K229 in rabbit muscle aldolase (Blom and Sygusch 1997), implicated in Schiff base formation, with pKa probably matching the decline of activity around pH 6.5 (Morris and Tolan 1994). A monomer from the tetramer (with product removed) gives Ns = 0.2. The network of ionizable groups around K229 (Fig. 2D ▶) were assigned unperturbed charges for neutral pH calculations. A catalytic antibody with aldolase activity has an active-site lysine (H chain K93) with a pKa of 5.5 estimated from the pH dependence of enamine formation (Barbas et al. 1997). Figure 2D ▶ shows the enclosed environment of K93(H), with W103(H) adjacent and H27(L) distant, but displayed to facilitate the view. NZ atom locations are shown from 1axt and modeled with more solvent exposure, because electron density for K93(H) does not extend beyond CE (Barbas et al. 1997). These give Ns = 2.0 (1axt, quoted in Fig. 2D ▶) and Ns = 0.8 (model), with the low pKa dominated by the Born term.
Histidine 48 of porcine pancreatic phospholipase A2 is catalytic (Thunnissen et al. 1990), with a pKa of 5.5 in the calcium-bound form (Verheij et al. 1980). Calculation gives Ns = 2.0 (Table 2). In chymotrypsin, interactions between partially charged/protonated or partially charged/neutral forms of H57, and other catalytic residues D102 and S195 have been evaluated, with S195 hydroxyl directed toward neutral H57 and away from protonated H57. Comparison with the measured pKa of 6.8 (Fersht and Renard 1974) gives Ns = 0.9 (Table 2). For T4 lysozyme, the noncatalytic residue H31 (pKa = 9.1) is significantly buried in a salt bridge with D70 (Anderson et al. 1990), giving Ns = 3.1 (Table 2). This Ns-based study of buried side chains with known pKas has excluded histidine residues with complicating factors such as strongly coupled titrations and ligand involvement. Variability in Ns values for histidine (prior to averaging) probably reflects relatively mixed environments and the omission of local relaxations (Edgcomb and Murphy 2002).
There is some evidence for reduced arginine pKas (Lehoux and Mitra 1999; Morillas et al. 1999), but not a clear example coupled to an atomic structure. Arginine side chain and N-terminal groups are assigned (Ns) as the lysine side-chain average, and C-terminal groups follow the average of the carboxylate containing side chains.
Comparison with ionization data for amino acids and analogs
The empirical modification for hydration entropy is generally small in ΔpKa terms compared with the Born and charge–charge contributions, with the exception of cysteine (Fig. 2 ▶; Table 2). The sense of the modification is in line with water molecule release upon ionizable group burial being greater (albeit slightly in most cases) for ionized versus unionized forms. Table 3 shows the enthalpies and entropies of ionization for amino acid side chains and molecular analogs (Izatt and Christensen 1976). Hydration entropies make the major contributions to ionization entropies (Alberty 1983), which show a wide variation for acidic and basic side chains in amino acids, partially due to overlapping proton binding equilibria. In contrast, the analog data show similar ionization ΔS within acidic and within basic groups, distinguishing between dissociation from one neutral to two charged species (acidic, larger ΔS), and from one charged to one charged and one neutral species (basic, smaller ΔS). Differencing between average ΔS values for each grouping (−103.5 J/deg/mole for AH ⇒ A− B + H+ and −17.0 J/deg/mole for BH+ ⇒ B + H+), cancelling the proton term, gives ΔS =−86.5 J/deg/mole for AH ⇒ A− summed with B ⇒ BH+. Approximating equal ΔS for each of these unionized to ionized form transitions, ΔS = −43.3 J/deg/ mole is obtained, equivalent to Ns = 1.7 (300 K) in the hydration shell model and consistent overall with the pKa calculations (other than cysteine). This favorable comparison supports use of the empirical model.
Table 3.
Amino acid side chain and analog ionization data
| Amino acid/analog | pKa | ΔH (kJ/mole) | ΔS (J/deg/mole) |
| Aspartic acid | 3.87 | 4.0 | −60.6 |
| Glutamic acid | 4.27 | 1.6 | −76.5 |
| Cysteine | 8.39 | 36.0 | −39.7 |
| Tyrosine | 10.05 | 25.1 | −108.7 |
| Arginine | 12.48 | 51.8 | −64.8 |
| Lysine | 10.53 | 48.5 | −38.9 |
| Histidine | 6.00 | 29.9 | 13.0 |
| Propanoic acid | 4.87 | −0.6 | −95.3 |
| Phenol | 9.98 | 23.6 | −111.6 |
| phenyl-arginine | 12.40 | 50.0 | −20.9 |
| Monomethylamine | 10.63 | 54.7 | −19.7 |
| Imidazole | 6.99 | 36.7 | −10.5 |
Measurements at 25°C and ionic strength between 0 and 0.15 M for the proton dissociations, AH <=> A− + H+ (acid) and BH+ <=> B + H+ (base) (Izatt and Christensen 1976). Only side-chain ionization pKa shown for amino acids.
A relatively small hydration entropy modification for pKas is expected where charged and neutral species differ little in water ordering for a first hydration shell, due to the propensity of both forms to accommodate multiple hydrogen bonds. This is consistent with high Ns for cysteine, which is relatively nonpolar in the neutral form. Table 4 compares ΔS values measured for small carboxylic acids and thiols (Irving et al. 1964). Consistently more negative ΔS for thiol group dissociation compared to carboxylic acids qualitatively matches the results of the hydration shell model, supporting a significant role for hydration entropy in cysteine pKa calculation.
Table 4.
Comparison of ionization ΔS values for carboxylates and thiolates
| Compound | ΔS (X3COOH) | ΔS (X3SH) | ΔΔS (COOH-SH) |
| CH3CH2X | −95.3 | −112.9 | 17.6 |
| (CH3)2CHX | −107.0 | −132.5 | 25.5 |
| (CH3)3CX | −106.6 | −140.0 | 33.4 |
Data from Irving et al. (1964), at 25°C, with ΔS units of J/deg/mole.
Entropic contributions to interactions within the pyruvate dehydrogenase complex
The interaction between dihydrolipoyl dehydrogenase (E3) dimer and the peripheral subunit-binding domain (PSBD) of dihydrolipoyl acyltransferase (E2) in the pyruvate dehydrogenase complex of Bacillus stearothermophilus has been subject to thermodynamic investigation (Jung et al. 2002). The binding (ΔGo =−52.7 kJ/mole) is entropically driven (−TΔSo = −61.9 kJ/mole), and alanine mutations demonstrate that one side chain (R135) makes a major entropic contribution (Table 5; Jung et al. 2002), leading the authors to conclude that water liberation upon charge network formation in the complex is important.
Table 5.
Binding energies for PSBD mutants relative to wild type, in complex with E3 dimer, and estimated entropic contributions
| Experiment (kJ/mole) | Calculation (kJ/mole) | ||||||
| ΔΔG0 | ΔΔH0 | Δ(TΔS0) | Δ(TΔS)QWAT | Δ(TΔS)SC | Δ(TΔS)NP | Δ{Δ(TΔS)} | |
| R135A | −11.7 | +20.1 | +31.8 | +20.8 | −1.0 | −0.3 | +19.5 |
| R139A | −10.5 | −10.5 | 0.0 | +12.1 | −3.5 | −6.0 | +2.6 |
Experimental data from Jung et al. (2002), differenced for wild type-mutant values. Calculations differenced for complexation, TΔS = TScomplex - [TSE3dimer + TSPSBD], followed by wild type to mutant differencing giving Δ(TΔS). Charge hydration entropy Δ(TΔS)QWAT derived from fraction of first hydration shell that is buried at interface for ionizable groups, multiplied by the cysteine shell value frompKa fitting of 36 kJ/mole. Side chain entropy Δ(TΔS)SC taken from mean-field calculations (Koehl and Delarue 1994; Cole and Warwicker 2002). Entropy changes associated with nonpolar surface burial Δ(TΔS)NP were approximated with the multiplicative factor 0.1 kJ/mole/Å2.
Whereas hydration modeling for pKa calculations involves differences for ionized/unionized forms and for charge burial, hydration modeling of complexation needs to consider primarily charge burial (although pKa changes upon burial could play a secondary role). Making the approximation that unionized cysteine has a weakly bound hydration shell, then pKa modification for this case is used to estimate the change in hydration entropy Δ (TΔS)QWAT for burial of a full ionizable group hydration shell in the E3 dimer:PSBD interface. The fractions of hydration shell occluded upon complexation are summed and multiplied by the 36 kJ/mole of a full shell. Mutant complexes were modelled with arginine side chain reduction to alanine (Fig. 4 ▶). Component parts (E3 dimer and PSBD) were modeled without conformational relaxation.
Figure 4.

PSBD (blue backbone):E3 dimer (green and orange surfaces) interface, showing mutated charge network.
Estimates of changes upon complexation for side chain rotameric entropy and water structure associated with buried nonpolar area are added (Table 5). Side-chain rotamer entropies derived from a mean-field calculation (Cole and Warwicker 2002). Nonpolar surface burial is converted to a free energy estimate (assumed due to water ordering) by the empirical factor 0.1 kJ/mole/Å2. The entropic term from ionizable group burial is the most significant in the wild-type to mutant differences. Summed values are qualitatively consistent with experiment for the two mutants (Table 5), demonstrating potential for the hydration model in binding studies.
Combination of FDPB and DH models: The FD/DH interaction scheme
The empirical modification of the FD/ɛp = 4 single conformer pKa calculations for hydration entropy is applied to the FD component of the FD/DH scheme. Figure 3 ▶ schematizes side-chain flexibility in different environments, and the derivation of SAmax and access to DH interactions. A VdW clash tolerance (VdWtol) is included in mean-field calculations that determine allowed rotamers for SA analysis. This parameter is varied to approximate conformational relaxation not explicitly included (nonlibrary rotamer packing and main-chain movement), and the best value determined with respect to experimental pKas (Fig. 5B ▶). VdWtol of around 0.8 Å is typically required to give a packing solution for united atom VdW radii, so that VdWtol > 0.8 Å represents additional flexibility that will lead to greater SAmax and successive entry of more ionizable groups to the DH calculation regime.
Figure 5.

VdWtol variation, SAmax, and RMS pKa errors. (A) Representative averages over a protein and active-site groups are shown for SAmax vs. VdWtol. Intersection of the SAmax = 0.75 and VdWtol = 1.4 lines gives FD/DH parameterization. (B) RMS pKa errors are shown for FD/DH calculations for each of the 110 and 117 group sets (with FD only and DH only at each extreme), and horizantal lines (“null”) give RMS errors for model compound pKas.
Variation of RMS pKa errors with VdWtol
Averages of fractional SAmax, over ionizable groups in representative proteins 1b0d and 1ado, show that most groups attain close to full SA by VdWtol = 0.8 Å, illustrative of general surface location (Fig. 5A ▶). Specific groups (E35 of 1b0d and K229 of 1ado shown) retain SAmax < 0.75 (Figs. 3 ▶, 5A ▶) at VdWtol = 1.4 Å. A fraction of 0.75 describes a pivot point largely separating relatively buried, active-site groups from surface, flexible side chains.
Figure 5B ▶ shows that for the 110 groups, excluding most of the large active-site ΔpKas, FD performs poorly and DH well in comparison to the null hypothesis. For the 117 set, the large ΔpKas impair DH performance, but have relatively little impact overall on FD, which remains dominated by inaccuracy within the 110 set. A broad region of optimal fit to experiment is found as VdWtol is varied for FD/DH. Increasing VdWtol adds flexibility that reduces the erroneously large ΔpKas for surface groups in the 110 set (schematically at the top of Fig. 1 ▶), while too much flexibility (beyond VdWtol = 1.4 Å) allows buried group relaxation (bottom of Fig. 1 ▶) to an extent that is inconsistent with experiment. From the optimal region, VdWtol = 1.4 Å is taken for FD/DH pKa calculations.
Comparison of pKa calculation methods
Table 6 gives overall RMS pKa errors for various methods. FD/ɛp = 20 (Antosiewicz et al. 1994) is similar to DH, consistent with a water-like environment (Warwicker 1999). Similarly, FD/ɛp = 4 with SA derived from VdW radii rather than a probe reentrant surface (Dong and Zhou 2002), has a large degree of internal water, and is comparable overall to DH. FD/DH performs moderately better with hydration entropy modification than without, with the largest difference for the active-site cysteine pKas of papain and DsbA (Table 7). Overall results are improved somewhat with the simple polar hydrogen optimization algorithm, consistent with previous observations (Nielsen et al. 1999). Differences associated with application of either the hydration entropy or polar hydrogen placement schemes are generally smaller than those from FD/DH introduction relative to FD (Table 6). The MCCE method gives an RMS pKa error for the 110 groups of 0.92 (Georgescu et al. 2002), compared with 0.58 for DH and 0.79 for FD/DH, while the single conformer FDPB method used by these authors gives 2.05, close to the current FD value of 2.10.
Table 6.
RMS pKaerrors compared across calculations
| Null | FD ɛp = 20 | FD VdW SA | DH | FD/DH | FD/DH no Δ(TΔS)QWAT | FD/DH no Hmove | FD | |
| 110 gps | 0.77 | 0.78 | 1.06 | 0.58 | 0.79 | 1.02 | 1.11 | 2.10 |
| 117 gps | 1.24 | 1.25 | 1.46 | 1.18 | 0.86 | 1.25 | 1.16 | 2.06 |
Sets of 110 and 117 groups explained in Materials and Methods. All calculations include polar hydrogen optimization except for the column labeled “no Hmove”. FD/DH schemes include hydration modification for the FD component except for the “no Δ(TΔS)QWAT” column. Of the FD calculations, only the FD column uses this modification. It is not appropriate for either ɛp = 20 or VdW solvent accessibility schemes, which are closer to DH in terms of water domination. FD/DH calculations were made with VdWtol = 1.4 Å. Null refers to model compound pKas in place of calculated values. RMS pKa error = sqrt {[∑(pKaexpl−pKacalc)2]/N}, where the sum runs over the N ionizable groups with measured pKas.
Table 7.
RMS pKa errors compared for DH, FD/DH, and FD methods
| PDB | Ngps | DH | FD/DH | FD/DH no Δ(TΔS)QWAT | FD |
| 4pti | 11 | 0.29 | 0.35 | 0.35 | 1.90 |
| 3icb | 10 | 0.40 | 0.37 | 0.39 | 0.97 |
| 1b0d | 18 | 0.74 | 0.47 | 0.61 | 1.49 |
| 1pga | 13 | 0.46 | 0.80 | 0.47 | 1.68 |
| 3rn3 | 15 | 0.45 | 0.87 | 2.02 | 2.43 |
| 2rn2 | 22 | 0.59 | 1.17 | 1.20 | 1.97 |
| 1a2p | 10 | 0.58 | 0.76 | 0.59 | 3.22 |
| 1ppf | 11 | 0.81 | 0.77 | 0.74 | 2.76 |
| 1xnb | 1 | 2.48 | 2.35 | 2.34 | 0.62 |
| 9pap | 1 | 4.85 | 2.64 | 4.95 | 0.65 |
| 1a21 | 1 | 4.86 | 0.71 | 5.35 | 1.14 |
| 1ado | 1 | 4.84 | 0.84 | 0.33 | 1.44 |
| 1axt | 1 | 6.04 | 1.06 | 1.85 | 1.55 |
| 1gsd | 1 | 1.59 | 1.36 | 1.69 | 0.22 |
| 1nai | 1 | 3.34 | 0.23 | 1.9 | 0.64 |
All FD component calculations are single conformer ɛp = 4, and use the 3(TΔS)QWAT modification unless stated. Polar hydrogen optimization is applied in all cases. FD/DH calculations made with VdWtol = 1.4 Å.
Scatter plots for ΔpKas and pKas (Fig. 6 ▶) show that FD has a bias toward overestimation of pKa shifts, while for DH an underestimation of ΔpKas is evident. These trends are corrected to a large extent in the FD/DH model, although several groups remain significantly in error.
Figure 6.

Scatter plots (calculation vs. experiment) for ΔpKas and pKas with FD, DH, and FD/DH calculations (117 group set).
Remaining discrepancies with the FD/DH method
Several of the groups used in the Ns analysis have FD ΔpKa > 1, despite derivation of Ns values from experimental pKas (Table 7). Discrepancy arises upon moving to multiple ionizable groups from a fixed charge environment, and from uniform Ns for each class of ionizable group. The DH model gives low RMS pKa errors for some proteins, but also some large values for active-site pKas. FD/DH largely matches the low RMS errors of DH within the 110 set, illustrating DH dominance of statistical weightings (Table 7). Ribo-nucleases 3rn3 and 2rn2 are the biggest exceptions.
For 3rn3, groups with ΔpKa to experiment >1.5 are H48 and H119. There are alternate locations for H119 (“A” was used), and a sulphate ion that may give overestimation of stabilizing interactions (FD/DH pKa = 8.3 and measured pKa = 6.1). H48 of 3rn3 has an FD/DH pKa of 4.6 and a measured pKa of 6.3. H48 is relatively buried and excluded from the DH scheme. FD interactions are dominated by an ion pair with D14 that varies between ribonuclease A structures (Georgescu et al. 2002).
Calculations for 2rn2 were made without magnesium to match experiment. FD/DH discrepancies with experiment >1.5 pKa units are E48 and H114. For E48 (1.7 calculated and 4.4 measured), DH is incorporated at VdWtol = 1.4 Å but not at VdWtol = 1.2 Å. However, the calculated pKa remains the same, because interactions are dominated by hydrogen bonding to background charges in the FD scheme. It is possible that unfavorable interactions with the D10, D70, and D134 charge cluster surrounding E48 have been underestimated. These groups are DH accessible, so that relatively weak DH interactions dominate. For H114 an FD/DH pKa at VdWtol = 1.4 Å of 1.0 compares with a measured pKa of 5.0. This residue is relatively buried, with an enforced FD-only scheme. The key (FD) interaction is a hydrogen bond to the peptide NH of C63, so that H114 protonation must involve some change in structure.
Of the seven additional proteins with individual groups, 1xnb/E172 and 9pap/C25 give the worst results for FD/DH (Table 7). For 1xnb, this discrepancy (calculated pKa = 4.4, measured = 6.7) is a failure of the FD/DH scheme, because FD alone gives a large positive ΔpKa for E172 with or without hydration entropy modification. Again, more detailed FD analysis of coupled clusters may improve the FD/DH model, a conclusion supported for xylanase by pKa calculations using subsets of ionizable groups (Nielsen and McCammon 2003).
The FD/DH pKa for C25 in papain (9pap) is 5.9, compared with 3.3 by experiment, and in contrast the FD pKa is a good match. Both C25 and H159 are accessible to the DH scheme at VdWtol = 1.4 Å. Because the FD result corresponds to significant stabilization of C25, it might be expected to figure more strongly in FD/DH calculation at VdWtol = 1.4 Å. Of the four possible samplings of C25 and H159 net charged forms, only one (both FD) will give a large favorable interaction. Alteration from FD to FD/DH may therefore result from relative weighting toward weak (DH) interactions. Active-site residue Y9 of 1gsd is allowed access to the DH scheme at VdWtol = 1.4 Å, (FD/DH pKa = 9.5 and measured 8.1), but not at VdWtol = 1.3 Å (calculated pKa = 8.7). It is tightly coupled to R20, which also has a DH accessibility transition over this VdWtol range.
Ionizable group electrostatic energy contributions
A move away from neutral pH generally destabilizes the folded state (Fink et al. 1994), consistent with a stabilizing network of positive and negative charges (Wada and Nakamura 1981), and with destabilization by charge reversal of surface amino groups (Hollecker and Creighton 1982). Computational methods with FD/ɛp = 20 or DH interactions accommodate such pH dependence, albeit with adjustment for pH-dependent effects in unfolded states (Schaefer et al. 1997; Warwicker 1999).
However, use of single conformer FD/ɛp = 4 has given rise to questions of salt-bridge stability (Hendsch and Tidor 1994; Dong and Zhou 2002), as is shown with the mostly unfavorable contributions of ionizable group interactions to stability at pH 7 (FD column of Table 8). In contrast to the DH column, FD calculations suggest that most of these folded proteins would be more stable with global replacement of ionizable groups, at variance with the prior discussion. The FD/DH method recovers favorable contributions to neutral pH stability. In many cases FD/DH matches DH closely, with DH interactions dominating FD overall. The particularly favorable values in Table 8 for 3icb/calbindin with FD and FD/DH calculation result from the strong binding of calcium ions by acidic side chains.
Table 8.
Predicted ionizable group array energies at pH 7 (kJ/mole)
| FD | DH | FD/DH | |
| 4pti | 24.1 | −5.8 | −5.2 |
| 3icb | −368.9 | −57.4 | −423.3 |
| 1b0d | 5.3 | −26.6 | −35.3 |
| 1pga | −11.3 | −23.5 | −43.1 |
| 3rn3 | 26.3 | −21.7 | −22.0 |
| 2rn2 | 67.4 | −29.7 | −30.5 |
| 1a2p | −21.3 | −38.9 | −69.4 |
| 1ppf | 0.1 | −8.3 | −17.5 |
| 1xnb | 53.6 | −29.1 | −22.4 |
| 9pap | 73.3 | −44.2 | −24.9 |
| 1a21 | 51.8 | −39.4 | −42.9 |
| 1ado | 90.4 | −101.5 | −92.9 |
| 1axt | 84.4 | −101.2 | −106.3 |
| 1gsd | 135.6 | −72.8 | −65.3 |
| 1nai | 81.2 | −81.6 | −73.4 |
Calcium ions were included in all 3icb calculations leading to significant stabilization. Ionizable group energy calculations given in Materials and Methods.
Improved active-site prediction
Figure 7 ▶ demonstrates the utility of a method that focuses on large ΔpKas in a background of smaller ΔpKas. Four representative examples are shown, with ionizable groups disallowed from DH interactions (VdWtol = 1.4 Å), further restricted to those with calculated pKas between 3 and 10. This latter feature excludes side chains such as tyrosine or histidine that are largely buried but remain neutral over a pH range around physiological, and buried groups in particularly stable charge networks. In Figure 7 ▶, just active-site residues remain, including D31 of 1nai that lies on the opposite end of the NAD binding groove to Y149. The large number of tyrosine side chains that are relatively buried (fractional SAmax < 0.75 at VdWtol = 1.4 Å), but with pKa > 10, show the potential for FD/DH to improve active-site identification methods (Elcock 2001; Ondrechen et al. 2001) that tend to give such groups as false positives. In addition, FD/DH allows detailed investigation of active-site electrostatics, coupled to existing biochemical data or on the basis of structural genomics predictions.
Figure 7.

Active-site identification using FD/DH. Four proteins (green backbones) used in pKa calculations are shown, with ionizable groups assessed as disallowed from DH interactions in orange, and a subset with calculated pKas between 3 and 10 shown in purple and labeled.
Conclusions
Extension of the hydration entropy modification for pKa calculations (Warwicker 1997) with a set of active-site ΔpKas (Fig. 2 ▶; Table 2) gives results that are consistent with small molecule ionization data (Tables 3,4). For cysteine, the modification can significantly influence calculated pKas. In general, the empirical modification makes relatively small changes (Tables 6,7), agreeing with the fruitful application of FD methods to active-site pKas in previous work. For some binding processes, entropy gain upon dehydration makes a significant contribution (Fig. 4 ▶; Jung et al. 2002), and the empirical hydration model could prove useful (Table 5).
The effectiveness of FD/DH calculations in combining FD/ɛp = 4 and DH computation is illustrated in Figure 5B ▶. The simple DH model is relatively good for the mostly small ΔpKas of the 110 groups set (Table 6), with an RMS pKa error of 0.58, matching the performance of more complex methods (Mehler and Guarnieri 1999; Georgescu et al. 2002). However, DH performance is eroded when larger ΔpKas are included (117 groups). The FD/ɛp = 4 single-conformer method fails to consistently predict ΔpKas in the 110 set. As the system is relaxed in the FD/DH model, with selective access to DH interactions mimicking side-chain and possibly main-chain readjustment on a limited scale, an optimal relaxation is evident before key groups are erroneously solvent-exposed. Large-scale conformational change cannot be reliably predicted, and is not the subject of this work. A VdWtol parameter controls conformational relaxation through mean-field rotamer packing and estimation of SAmax for each ionizable group (Figs. 3 ▶, 5A ▶). At VdWtol = 1.4 Å, FD/DH gives an RMS pKa error of 0.86 for the 117 groups, compared with null, DH and FD values of 1.24, 1.18, and 2.06, respectively. The tendencies of FD to overestimate small ΔpKas and DH to underestimate large ΔpKas are clear in Figure 6 ▶. Factors that could further improve the FD/DH scheme include modeling of larger scale flexibility and pH-dependent ion binding, and detailed water structure (Koumanov et al. 2002). Tightly coupled clusters, with groups that are borderline for access to the DH scheme at VdWtol = 1.4 Å, may benefit from FD analysis of individual rotamer combinations. This refers to relatively few groups; the majority would be included in FD/DH sampling.
Generally, the FD/DH model is improved by hydration entropy modification and polar hydrogen optimization, but not to the extent of FD/DH improvement over FD (Tables 6,7). Two areas further demonstrate potential. First (Table 8), FD/DH recovers overall stabilizing contributions for ionizable group interactions at pH 7, in contrast to the de-stabilization of the FD/ɛp = 4 single-conformer model. Second, Figure 7 ▶ demonstrates active-site identification, which could be used in a structural genomics context or provide subsets of residues to seed active-site–centered electrostatics calculations (Nielsen and McCammon 2003). The computational speed of the FD/DH method, coupled to accuracy over large and small pKa deviations, make it suitable for large-scale database analysis.
Materials and methods
Coordinates and pKas
Proteins and coordinate sets (Berman et al. 2000) are given in Table 1. A previous study of computational methods (Georgescu et al. 2002) has collated pKa data for the first eight proteins in Table 1, covering 126 ionizable groups, although the authors report that some of these ionizations may overlap either a limit of the measured pH range and/or a protein unfolding transition. Further investigation of the literature cited by Georgescu et al. (2002), with regard to these criteria, lead to the exclusion of the following groups in the current study: D54, E73, D93, D101 of 1a2p; Y23, Y35, and K41 of 4pti; D66 of 1b0d; D7, D27, Y31, and C-t of 1ppf; K13 of 1pga; D14 of 3rn3; D102 and D148 of 2rn2. These 16 exclusions reduce 126 groups for the eight proteins studied by Georgescu et al. (2002) to 110, which also excludes the C-t of 1pga.
This set of 110 groups was supplemented by a further seven active-site groups, with large ΔpKas for FD/DH analysis, forming the “117” set. Groups and coordinates used for development of the empirical hydration model (Warwicker 1997), including these seven active-site residues, are listed in Table 1. In addition, coordinate set 1ebd was used to study interactions within the pyruvate dehydrogenase complex.
Electrostatics calculations (FD and DH)
DH (Warwicker 1999) and FD (ɛp = 4, single conformer) (Warwicker 1998) calculations followed previous work, except for hydration entropy and polar hydrogen optimization modifications (next section). Model compound pKas used and charge assignment for ionizable group atoms were Arg 12.0 0.5/NH1 0.5/NH2; Lys 10.4 1.0/NZ; His 6.3 0.5/ND1 0.5/NE2; Asp 4.0–0.5/OD1–0.5/ OD2; Glu 4.4–0.5/OE1–0.5/OE2; Cys 8.3–1.0/SG (where not disulfide bonded); Tyr 10.2–1.0/OH; N-t 7.5 1.0/N; C-t 3.8–0.5/O–0.5/OXT. Cysteine side chains were excluded from pKa calculations, except for papain C25, DsbA C30 and C33, and thioredoxin C32 and C35. Partial charges were assigned from the GROMOS library (van Gunsteren and Berendsen 1987). Where specified, ɛp = 20 was used in place of ɛp = 4 for the FD model. A water relative dielectric of 78.4 was used throughout. An alternative to a solvent-probed (probe radius =1.4 Å) reentrant surface was tested, a VdW sphere derived surface giving greater water penetration into the protein. All DH and FD computations were made with a linear ion response at 0.15 Molar.
The energy of a protonation microstate relative to the fully unprotonated state for M titratable groups is (modified from Bashford and Karplus 1990):
 |
where xm,xn are members of vectors (lengths M) taking the values 0 (unprotonated) and 1 (protonated), qmo,qno are the charges of the unprotonated sites m,n, and pKm,model is the model compound pKa for site m. Interactions of group m with the protein dielectric and nonionizable (background) charge environments are differenced to calculations for each ionizable group extracted from the protein, but remaining on the same FD grid (ΔGBorn, ΔGback), while ΔGmn gives the interaction between ionizable groups. The term Δ G(TΔS)QWAT arises from the hydration entropy model discussed in the next section. This definition of Gs applies to either FD or DH calculations, but in the DH case ΔGBorn and ΔG(TΔS)QWAT terms are zero. In addition ΔG(TΔS)QWAT is set to zero for ɛp = 20 calculations. Average fractional protonation for site m is derived as:
 |
where a full evaluation of the partition function (Z) is possible for small numbers of groups using the reduced sites method (Bashford and Karplus 1990) at pH extremes, or alternatively monte carlo sampling of lowest energy states is used (Beroza et al. 1991). The calculated pKa of site m is that pH for which 〈xm〉=0.5.
Electrostatic energy contributions from ionizable groups were calculated by summing increments over pH according to ∂( ΔG)/ ∂pH =2.303RTΔQ, where ΔG, ΔQ differences are relative to pH titration of the same set of ionizable groups with model compound pKas (Antosiewicz et al. 1994). These sums were extended to an extreme pH at which a full evaluation of ionization states was possible, G =-RTlnZ, again with differencing to a calculation for the same groups titrating with model compound pKas.
Hydration entropy modification and polar hydrogen placement
An empirical estimate of the contribution that water ordering makes to the change in ionization energy upon transfer into protein is written as ΔG(TΔS)QWAT = Vf•Es (Warwicker 1997), where Vf is the fractional change in first hydration shell volume, and Es is a free energy associated with water ordering for the complete shell. Vf is calculated from FD grids for a group in the protein relative to that whole amino acid extracted from the protein. It is convenient to consider Es in terms of a notional number of water molecules (Warwicker 1997) in the first hydration shell (Ns), using 25 J/K/ mole entropy cost of immobilization of a single water molecule or 7.5 kJ/mole at 300 K. In pKa calculations, Es and Ns correspond to differences between water structure in ionized and unionized forms. Averages of Ns are taken over groups within a class, and individual Ns values derived with charge environments fixed according to expected ionization at physiological pH (see Results and Discussion). Thus, Ns derivation was separated from global pKa computation in the FD/DH method through the use of separate calculations with fixed ionization on all groups but one. The Ns parameter gives the empirically derived difference in hydration numbers between ionized and unionized forms, for a complete hydration shell. It is uniform for a class of ionizable group, but each individual modification is proportional to burial (Vf).
Optimization of polar hydrogen locations can improve pKa calculations (Nielsen et al. 1999; Koumanov et al. 2003). A simple procedure was implemented which optimizes polar hydrogen positions for the OH groups of Ser and Thr side chains (and Tyr if present in its neutral form). Torsions are sampled, with 12° resolution, against coulombic interactions from charges other than those belonging to the set of OH groups being optimized. Ionizable groups are specified in their ionized forms, to focus pKa calculations on the net difference upon titration.
Mean-field packing algorithm and access to the DH interaction scheme
A mean-field algorithm (Koehl and Delarue 1994), adjusted with hard sphere clashes replacing Lennard-Jones interactions (Cole and Warwicker 2002), establishes a set of allowed rotamers from a standard library (Tuffery et al. 1997) as well as those in the experimental structure. The conformational matrix (CM) or weight for rotamer k of side chain i (of N side chains), depends on clashes with fixed atoms and the rotamers of other side chains j:
 |
Weights for rotamers l =1 to Kj of side chain j are summed, and the multiplication of these side-chain and fixed-atom weights requires that each be nonzero for a packing solution for rotamer k of residue i. CM values are iterated from an initial assignment of equal weights. These mean-field methods were used previously to assess the entropy associated with side-chain rotamer distributions, but are used here simply to estimate possible rotamers for a given structure and packing tolerance (VdWtol).
Hydrogen atoms are absent in the packing calculations, which use united atom VdW radii, so that a VdWtol of about 0.8 Å is typically required to repack rotamers of the experimental structure, due particularly to side-chain/main-chain clashes. Above this value clashes may partially account for conformational relaxation, such as variation from library side-chain rotamers or small main-chain movements.
An estimate of maximal SA (SAmax) is obtained for each ionizable group. For each neighboring side chain, the (allowed) rotamer that provides the most SA for the charged atom of the ionizable group under study is used to mark SA information on a spherical polar grid around that atom. This grid is scanned after complete neighbor analysis for the overall SAmax. Maximal SA estimates for an ionizable group with more than one charged atom in our model are averaged. The likelihood that small conformational adjustment could lead to substantial solvent exposure of each group is assessed with SAmax (Fig. 3 ▶). If SAmax/SAfixed-atoms ≥ 0.75, where SAfixed-atoms is calculated in the context of fixed atoms only (i.e., excluding atoms that move in the rotamer library), then that group is allowed to sample DH (water-dominated) interactions.
Combined FD/DH calculations
In the FD/DH combination, each site m in the equation for microstate energy Gs is sampled as protonated or unprotonated in each of FD and DH (if allowed) schemes, with the component energies of Gs assigned appropriately. Thus, a standard single conformer pKa calculation with 2M states for M groups, approaches 4M states in FD/DH, because most sites are relatively flexible and have access to the DH scheme. Note that for any group m sampled as DH, all mn (and nm) interactions are DH whether group n is sampled as FD or DH, that is, the water-dominated scheme persists for any interaction involving a group sampled in a presumed water-rich environment. Ionizable group array energies and pKas in FD/DH calculations are derived as for FD or DH alone. No attempt is made to assign a density of conformational states, other than DH access or not, so that electrostatic energy determines the relative weightings of FD and DH. A moderate energy (favorable or unfavorable) from DH interaction would outweigh a highly unfavorable FD interaction, while a large and favorable FD term will dominate DH.
Acknowledgments
The European Union is thanked for funding during the course of this work.
The publication costs of this article were defrayed in part by payment of page charges. This article must therefore be hereby marked “advertisement” in accordance with 18 USC section 1734 solely to indicate this fact.
Article and publication are at http://www.proteinscience.org/cgi/doi/10.1110/ps.04785604.
References
- Alberty, R.A. 1983. Physical chemistry, 6th ed. John Wiley & Sons, New York.
- Alexov, E. 2003. Role of the protein side-chain fluctuations on the strength of pair-wise electrostatic interactions: Comparing experimental with computed pKas. Proteins 50 94–103. [DOI] [PubMed] [Google Scholar]
- Alexov, E. and Gunner, M.R. 1997. Incorporating protein conformational flexibility into the calculation of pH-dependent protein properties. Biophys. J. 74 2075–2093. [DOI] [PMC free article] [PubMed] [Google Scholar]
- Anderson, D.E., Becktel, W.J., and Dahlquist, F.W. 1990. pH-induced denaturation of proteins: A single salt bridge contributes 3–5 kcal/mol to the free energy of folding of T4 lysozyme. Biochemistry 29 2403–2408. [DOI] [PubMed] [Google Scholar]
- Antosiewicz, J., McCammon, J.A., and Gilson, M.K. 1994. Prediction of pH-dependent properties in proteins. J. Mol. Biol. 238 415–436. [DOI] [PubMed] [Google Scholar]
- ———. 1996. The determinants of pKas in proteins. Biochemistry 35 7819–7833. [DOI] [PubMed] [Google Scholar]
- Barbas III, C.F., Heine, A., Zhong, G., Hoffmann, T., Gramatikova, S., Björnestedt, R., List, B., Anderson, J., Stura, E.A., Wilson, I.A., et al. 1997. Immune versus natural selection: Antibody aldolases with enzymic rates but broader scope. Science 278 2085–2092. [DOI] [PubMed] [Google Scholar]
- Bashford, D. and Karplus, M. 1990. pKa’s of ionizable groups in proteins: Atomic detail from a continuum electrostatic model. Biochemistry 29 10219–10225. [DOI] [PubMed] [Google Scholar]
- Berman, H.M., Westbrook, J., Feng, Z., Gilliland, G., Bhat, T.N., Weissig, H., Shindyalov, I.N., and Bourne, P.E. 2000. The Protein Data Bank. Nucleic Acids Res. 28 235–242. [DOI] [PMC free article] [PubMed] [Google Scholar]
- Beroza, P., Fredkin, D.R., Okamura, M.Y., and Feher, G. 1991. Protonation of interacting residues in a protein by a Monte Carlo method: Application to lysozyme and the photosynthetic reaction center of Rhodobacter sphaeroides. Proc. Natl. Acad. Sci. 88 5804–5808. [DOI] [PMC free article] [PubMed] [Google Scholar]
- Björnestedt, R., Stenberg, G., Widersten, M., Board, P.G., Sinning, I., Jones, T.A., and Mannervik, B. 1995. Functional significance of arginine 15 in the active site of human class α glutathione transferase A1–1. J. Mol. Biol. 247 765–773. [DOI] [PubMed] [Google Scholar]
- Blom, N. and Sygusch, J. 1997. Product binding and role of the C-terminal region in class I D-fructose 1,6-bisphosphate aldolase. Nat. Struct. Biol. 4 36–39. [DOI] [PubMed] [Google Scholar]
- Cameron, A.D., Sinning, I., L’Hermite, G., Olin, B., Board, P.G., Mannervik, B., and Jones, T.A. 1995. Structural analysis of human α-class glutathione transferase A1–1 in the apo-form and in complexes with ethacrynic acid and its glutathione conjugate. Structure 3 717–727. [DOI] [PubMed] [Google Scholar]
- Chivers, P.T., Prehoda, K.E., Volkman, B.F., Kim, B.M., Markley, J.L., and Raines, R.T. 1997. Microscopic pKa values of Escherichia coli thioredoxin. Biochemistry 36 14985–14991. [DOI] [PubMed] [Google Scholar]
- Cole, C. and Warwicker, J. 2002. Side-chain conformational entropy at protein–protein interfaces. Protein Sci. 11 2860–2870. [DOI] [PMC free article] [PubMed] [Google Scholar]
- Demchuk, E. and Wade, R.C. 1996. Improving the continuum dielectric approach to calculating pKas of ionizable groups in proteins. J. Phys. Chem. 100 17373–17387. [Google Scholar]
- Dong, F. and Zhou, H.X. 2002. Electrostatic contributions to T4 lysozyme stability: Solvent-exposed charges versus semi-buried salt bridges. Biophys. J. 83 1341–1347. [DOI] [PMC free article] [PubMed] [Google Scholar]
- Edgcomb, S.P. and Murphy, K.P. 2002. Variability in the pKa of histidine side-chains correlates with burial within proteins. Proteins 49 1–6. [DOI] [PubMed] [Google Scholar]
- Elcock, A.H. 2001. Prediction of functionally important residues based solely on the computed energetics of protein structure. J. Mol. Biol. 312 885–896. [DOI] [PubMed] [Google Scholar]
- Fersht, A.R. and Renard, M. 1974. pH-dependence of chymotrypsin catalysis. Appendix: Substrate binding to dimeric α chymotrypsin studied by x-ray diffraction and equilibrium method. Biochemistry 13 1416–1426. [DOI] [PubMed] [Google Scholar]
- Fink, A.L., Calciano, L.J., Goto, Y., Kurotsu, T., and Palleros, D.R. 1994. Classification of acid denaturation of proteins: Intermediates and unfolded states. Biochemistry 33 12505–12511. [DOI] [PubMed] [Google Scholar]
- Fitch, C.A., Karp, D.A., Lee, K.K., Stites, W.E., Lattman, E.E., and Garcia- Moreno, E.B. 2002. Experimental pKa values of buried residues: Analysis with continuum methods and role of water penetration. Biophys. J. 82 3289–3304. [DOI] [PMC free article] [PubMed] [Google Scholar]
- Georgescu, R.E., Alexov, E., and Gunner, M.R. 2002. Combining conformational flexibility and continuum electrostatics for calculating pKas in proteins. Biophys. J. 83 1731–1748. [DOI] [PMC free article] [PubMed] [Google Scholar]
- Gilson, M.K. and Honig, B.H. 1986. The dielectric constant of a folded protein. Biopolymers 25 2097–2119. [DOI] [PubMed] [Google Scholar]
- Gorfe, A.A., Ferrara, P., Caflisch, A., Marti, D.N., Bosshard, H.R., and Jelesarov, I. 2002. Calculation of protein ionization equilibria with conformational sampling: pKas of a model leucine zipper, GCN4 and barnase. Proteins 46 41–60. [DOI] [PubMed] [Google Scholar]
- Grauschopf, U., Winther, J.R., Korber, P., Zander, T., Dallinger, P., and Bardwell, J.C. 1995. Why is DsbA such an oxidizing catalyst? Cell 83 947–955. [DOI] [PubMed] [Google Scholar]
- Guddat, L.W., Bardwell, J.C., and Martin, J.L. 1998. Crystal structures of reduced and oxidized DsbA: Investigation of domain motion and thiolate stabilization. Structure 6 757–767. [DOI] [PubMed] [Google Scholar]
- Hendsch, Z.S. and Tidor, B. 1994. Do salt-bridges stabilize proteins? A continuum electrostatic analysis. Protein Sci. 3 211–226. [DOI] [PMC free article] [PubMed] [Google Scholar]
- Hollecker, M. and Creighton, T.E. 1982. Effect on protein stability of reversing the charge on amino groups. Biochim. Biophys. Acta 701 395–404. [DOI] [PubMed] [Google Scholar]
- Honig, B. and Nicholls, A. 1995. Classical electrostatics in biology and chemistry. Science 268 1144–1149. [DOI] [PubMed] [Google Scholar]
- Ikeuchi, Y., Katerelos, N.A., and Goodenough, P.W. 1998. The enhancing of a cysteine protease activity at acidic pH by protein engineering, the role of glutamic 50 in the enzyme mechanism of caricain. FEBS Lett. 437 91–96. [DOI] [PubMed] [Google Scholar]
- Irving, R.J., Nelander, L., and Wadso, I. 1964. Thermodynamics of the ionization of some thiols in aqueous solution. Acta. Chem. Scand. 18 769–787. [Google Scholar]
- Izatt, R.M. and Christensen, J.J. 1976. Heats of proton ionization, pK, and related thermodynamic quantities. In Handbook of biochemistry and molecular biology: Physical and chemical data (ed. G.D. Fasman), 3rd ed., Vol. I, pp. 151–269. CRC Press, Cleveland, OH.
- Joshi, M.D., Hedberg, H., and McIntosh, L.P. 1997. Complete measurement of the pKa values of the carboxyl and imidazole groups in Bacillus circulans xylanase. Protein Sci. 6 2667–2670. [DOI] [PMC free article] [PubMed] [Google Scholar]
- Jung, H.-I., Cooper, A., and Perham, R.N. 2002. Identification of key amino acid residues in the assembly of enzymes into the pyruvate dehydrogenase complex of Bacillus stearothermophilus: A kinetic and thermodynamic analysis. Biochemistry 41 10446–10453. [DOI] [PubMed] [Google Scholar]
- Klapper, I., Hagstrom, R., Fine, R., Sharp. K., and Honig, B. 1986. Focusing of electric fields in the active site of Cu-Zn superoxide dismutase: Effects of ionic strength and amino-acid modification. Proteins 1 47–59. [DOI] [PubMed] [Google Scholar]
- Koehl, P. and Delarue, M. 1994. Application of a self-consistent mean field theory to predict side-chains conformation and estimate their conformational entropy. J. Mol. Biol. 239 249–275. [DOI] [PubMed] [Google Scholar]
- Koumanov, A., Karshikoff, A., Friis, E.P., and Borchert, T.V. 2001. Conformational averaging in pK calculations: Improvement and limitations in prediction of ionization properties of proteins. J. Phys. Chem. B 105 9339–9344. [Google Scholar]
- Koumanov, A., Ruterjans, H., and Karshikoff, A. 2002. Continuum electrostatic analysis of irregular ionization and proton allocation in proteins. Proteins 46 85–96. [DOI] [PubMed] [Google Scholar]
- Koumanov, A., Benach, J., Atrian, S., Gonzalez-Duarte, R., Karshikoff, A., and Ladenstein, R. 2003. The catalytic mechanism of Drosophila alcohol dehydrogenase: Evidence for a proton relay modulated by the coupled ionization of the active site Lysine/Tyrosine pair and a NAD+ ribose OH switch. Proteins 51 289–298. [DOI] [PubMed] [Google Scholar]
- Kuramitsu, S. and Hamaguchi, K. 1980. Analysis of the acid-base titration curve of hen lysozyme. J. Biochem. 87 1215–1219. [PubMed] [Google Scholar]
- Lehoux, I.E. and Mitra, B. 1999. (S)-Mandelate dehydrogenase from Pseudomonas putida: Mechanistic studies with alternate substrates and pH and kinetic isotope effects. Biochemistry 38 5836–5848. [DOI] [PubMed] [Google Scholar]
- Liu, Y., Thoden, J.B., Kim, J., Berger, E., Gulick, A.M., Ruzicka, F.J., Holden, H.M., and Frey, P.A. 1997. Mechanistic roles of tyrosine 149 and serine 124 in UDP-galactose 4-epimerase from Escherichia coli. Biochemistry 36 10675–10684. [DOI] [PubMed] [Google Scholar]
- Mehler, E.L. and Guarnieri, F. 1999. A self-consistent, microenvironment modulated screened coulomb potential approximation to calculate pH-dependent electrostatic effects in proteins. Biophys. J. 75 3–22. [DOI] [PMC free article] [PubMed] [Google Scholar]
- Morillas, M., Goble, M.L., and Virden, R. 1999. The kinetics of acylation and deacylation of penicillin acylase from Escherichia coli ATCC11105: Evidence for lowered pKa values of groups near the catalytic centre. Biochem. J. 338 235–239. [PMC free article] [PubMed] [Google Scholar]
- Morris, A.J. and Tolan, D.R. 1994. Lysine-146 of rabbit muscle aldolase is essential for cleavage and condensation of the C3–C4 bond of fructose 1,6-bis(phosphate). Biochemistry 33 12291–12297. [DOI] [PubMed] [Google Scholar]
- Nielsen, J.E. and McCammon, J.A. 2003. Calculating pKa values in enzyme active sites. Protein Sci. 12 1894–1901. [DOI] [PMC free article] [PubMed] [Google Scholar]
- Nielsen, J.E., Andersen, K.V., Honig, B., Hooft, R.W.W., Klebe, G., Vriend, G., and Wade, R.C. 1999. Improving macromolecular electrostatics calculations. Protein Eng. 12 657–662. [DOI] [PubMed] [Google Scholar]
- Noble, M.A., Gul, S., Verma, C.S., and Brocklehurst, K. 2000. Ionization characteristics and chemical influences of aspartic acid residue 158 of papain and caricain determined by structure-related kinetic and computational techniques: Multiple electrostatic modulators of active-centre chemistry. Biochem. J. 351723–733. [PMC free article] [PubMed] [Google Scholar]
- Ondrechen, M.J., Clifton, J.G., and Ringe, D. 2001. THEMATICS: A simple computational predictor of enzyme function from structure. Proc. Natl. Acad. Sci. 98 12473–12478. [DOI] [PMC free article] [PubMed] [Google Scholar]
- Schaefer, M., Sommer, M., and Karplus, M. 1997. pH-dependence of protein stability: Absolute electrostatic free energy differences between conformations. J. Phys. Chem. B 101 1663–1683. [Google Scholar]
- Schutz, C.N. and Warshel, A. 2001. What are the dielectric “constants” of proteins and how to validate electrostatic models? Proteins 44 400–417. [DOI] [PubMed] [Google Scholar]
- Simonson, T. 2001. Macromolecular electrostatics: Continuum models and their growing pains. Curr. Opin. Struct. Biol. 11 243–252. [DOI] [PubMed] [Google Scholar]
- Simonson, T. and Perahia, D. 1995. Internal and interfacial dielectric properties of cytochrome c from molecular dynamics in aqueous solution. Proc. Natl. Acad. Sci. 92 1082–1086. [DOI] [PMC free article] [PubMed] [Google Scholar]
- Sundd, M., Iverson, N., Ibarra-Molero, B., Sanchez-Ruiz, J.M., and Robertson, A.D. 2002. Electrostatic interactions in ubiquitin: Stabilization of carboxylates by lysine amino groups. Biochemistry 41 7586–7596. [DOI] [PubMed] [Google Scholar]
- Thoden, J.B., Frey, P.A., and Holden, H.M. 1996. Crystal structures of the oxidized and reduced forms of UDP-galactose 4-epimerase isolated from Escherichia coli. Biochemistry 35 2557–2566. [DOI] [PubMed] [Google Scholar]
- Thunnissen, M.M.G.M., Eiso, A.B., Kalk, K.H., Drenth, J., Dijkstra, B.W., Kuipers, O.P., Dijkman, R., de Haas, G.H., and Verheij, H.M. 1990. X-ray structure of phospholipase A2 complexed with a substrate-derived inhibitor. Nature 347 689–691. [DOI] [PubMed] [Google Scholar]
- Tuffery, P., Etchebest, C., and Hazout, S. 1997. Prediction of protein side chain conformations: A study on the influence of backbone accuracy on conformation stability in the rotamer space. Protein Eng. 10 361–372. [DOI] [PubMed] [Google Scholar]
- van Gunsteren, W.F. and Berendsen, H.J.C. 1987. GROMOS manual. University of Groningen, The Netherlands.
- van Vlijmen, H.W., Schaefer, M., and Karplus, M. 1998. Improving the accuracy of protein pKa calculations: Conformational averaging versus the average structure. Proteins 33 145–158. [DOI] [PubMed] [Google Scholar]
- Verheij, H.M., Volwerk, J.J., Jansen, E.H.J.M., Puyk, W.C., Dijkstra, B.W., Drenth, J., and de Haas, G.H. 1980. Methylation of histidine 48 in pancreatic phospholipase A2. Role of histidine and calcium ion in the catalytic mechanism. Biochemistry 19 743–750. [DOI] [PubMed] [Google Scholar]
- Wada, A. and Nakamura, H. 1981. Nature of the charge distribution in proteins. Nature 293 757–758. [DOI] [PubMed] [Google Scholar]
- Warshel, A. 1981. Calculations of enzymatic reactions: Calculations of pKa, proton transfer reactions, and general acid catalysis reactions in enzymes. Biochemistry 20 3167–3177. [DOI] [PubMed] [Google Scholar]
- ———. 2003. Computer simulations of enzyme catalysis: Methods, progress, and insights. Annu. Rev. Biophys. Biomol. Struct. 32 425–443. [DOI] [PubMed] [Google Scholar]
- Warshel, A. and Papazyan, A. 1998. Electrostatic effects in macromolecules: Fundamental concepts and practical modelling. Curr. Opin. Struct. Biol. 8 211–217. [DOI] [PubMed] [Google Scholar]
- Warwicker, J. 1986. Continuum dielectric modelling of the protein–solvent system, and calculation of the long-range electrostatic field of the enzyme phosphoglycerate mutase. J. Theor. Biol. 121 199–210. [DOI] [PubMed] [Google Scholar]
- ———. 1997. Improving pKa calculations with consideration of hydration entropy. Protein Eng. 10 809–814. [DOI] [PubMed] [Google Scholar]
- ———. 1998. Modeling charge interactions and redox properties in DsbA. J. Biol. Chem. 273 2502–2504. [DOI] [PubMed] [Google Scholar]
- ———. 1999. Simplified methods for pKa and acid pH-dependent stability estimation in proteins: Removing dielectric and counterion boundaries. Protein Sci. 8 418–425. [DOI] [PMC free article] [PubMed] [Google Scholar]
- Warwicker, J. and Watson, H.C. 1982. Calculation of the electric potential in the active site cleft due to α-helix dipoles. J. Mol. Biol. 157 671–679. [DOI] [PubMed] [Google Scholar]
- You, T.J. and Bashford, D. 1995. Conformation and hydrogen ion titration of proteins: A continuum model with conformational flexibility. Biophys. J. 691721–1733. [DOI] [PMC free article] [PubMed] [Google Scholar]
- Zhou, H.X. and Vijayakumar, M. 1997. Modeling of protein conformational fluctuations in pKa predictions. J. Mol. Biol. 267 1002–1011. [DOI] [PubMed] [Google Scholar]