

Abstract
Electrostatic interactions play important roles in diverse biological phenomena controlling the function of many proteins. Polar molecules can be studied with the FDPB method solving the Poisson-Boltzmann equation on a finite difference grid. A method for the prediction of pKas and redox potentials in the thioredoxin superfamily is introduced. The results are compared with experimental pKa data where available, and predictions are made for members lacking such data. Studying CxxC motif variation in the context of different background structures permits analysis of contributions to cysteine ΔpKas. The motif itself and the overall framework regulate pKa variation. The reported method includes generation of multiple side-chain rotamers for the CxxC motif and is an effective predictive tool for functional pKa variation across the superfamily. Redox potential follows the trend in cysteine pKa variation, but some residual discrepancy indicates that a pH-independent factor plays a role in determining redox potentials for at least some members of the superfamily. A possible molecular basis for this feature is discussed.
Keywords: electrostatics calculations, thioredoxin superfamily, ionizable groups, redox potential
Proteins in the thioredoxin superfamily characteristically include a thioredoxin fold, consisting of a mixed β-sheet of five strands surrounded by four α-helices, and a CxxC sequence motif in which x denotes an unspecified amino acid, in their active site (Martin 1995; Åslund and Beckwith 1999). This sequence is CPHC starting at residue C30 in Escherichia coli DsbA, CGPC starting at C32 in human thioredoxin, CGYC starting at C98 in E. coli DsbC, and CVYC starting at C14 in T4 bacteriophage glutaredoxin. Different members of the superfamily can have opposite functions depending on the redox potential and the environment, either reducing disulfide bonds or oxidizing cysteine thiols (Debarbieux and Beckwith 2000). The CxxC motif has been extensively studied in terms of redox potential and function (Grauschopf et al. 1995; Huber-Wunderlich and Glockshuber 1998) and has been characterized as a rheostat in the active site (Chivers et al. 1997). The function of each member of the thioredoxin superfamily is determined by their redox potential and by the direction of the electron transport pathway within which each participates. Thiore-doxin 1 of E. coli, with a redox potential of −270 mV, is a major reductant in the cytoplasm, whereas DsbA, a periplasmic protein with a redox potential of −22 mV, is highly oxidizing and required for the disulfide bond formation in the cell envelope (Åslund and Beckwith 1999). The active sites of members of the thioredoxin superfamily have remarkably similar conformation but exhibit extensive variation in redox equilibria.
Electrostatic energies play a significant role in the control of protein function (Honig and Nicholls 1995), and accurate determination of these energies is therefore required to aid functional prediction. The magnitudes of electrostatic interactions of ionizable groups in proteins are apparent from the extent to which their pKa values are shifted from model compound values (Kortemme et al. 1996). Redox potentials are also dependent on electrostatic interactions in a protein environment. A correlation between redox potential and pKa of the first, more exposed cysteine of the CxxC motif has been observed in the thioredoxin superfamily (Grauschopf et al. 1995). This coupling can, at least in part, be viewed in terms of differential stabilization of negative charge on the cysteine thiolate, enabling a mechanism by which proteins can modulate pKa and redox equilibrium (Holmgren 1985; Gane et al. 1995; Grauschopf et al. 1995).
Macroscopic continuum dielectric models, in which the protein is represented with low dielectric in an aqueous high-dielectric medium to represent the protein–solvent interface (Warwicker and Watson 1982), form the basis for many predictions of pKas (Bashford and Karplus 1990) with finite difference solutions to the Poisson-Boltzmann equation (FDPB). Computational electrostatic analysis of Cys30 and Cys32 of DsbA and thioredoxin, respectively, has given a useful insight into the interactions of the thiolates with the surrounding protein environment and the evolution of these two proteins to different parts of the redox spectrum (Gane et al. 1995). Calculations of pKa values of members of the thioredoxin superfamily are in good agreement with experimental data (Warwicker and Gane 1996; Dillet et al. 1998).
An automated method for the calculation and prediction of pKas in the thioredoxin superfamily is presented. The relative roles of the CxxC motif and other regions in modulating active site properties are studied (Grauschopf et al. 1995; Chivers et al. 1997; Huber-Wunderlich and Glockshuber 1998). We find that both the motif itself and its surroundings make significant contributions to such variation. A multiconformational method, including alternative packings of side-chain rotamers for the xx motif, has been introduced, with a distance matrix to cluster conformers and subsequent statistical averaging to yield predicted pKas and the pH dependence of redox potential. The automated method is in reasonable agreement with experiment across the thioredoxin superfamily and is used to make prediction where measurement is not yet available. It provides scope for guiding experiment, through identification of potential outliers in functional subgroups of the superfamily.
Results
Protein contributions to Δ pKas for human thioredoxin and E. coli DsbA
Calculations for human thioredoxin and E. coli DsbA were made with pKas obtained from single (X-ray experimental) conformers. In addition, for DsbA, calculations were statistically averaged over multiple conformers that derive from mean-field packing solutions for the xx component of the CxxC motif, as described in Materials and Methods and shown as a calculation outline in Figure 1 ▶. Different environments were used to assess the importance of various regions in determining the more exposed cysteine pKas (Fig. 2A ▶; Table 1). Agreement to experimental pKas is reasonable for complete (native) structures. For thioredoxin, 7.1 is calculated for the single conformer of the xx = GP wild type, with 6.3 measured (Forman-Kay et al. 1992). For DsbA, 2.6 for the single PH conformer and 4.3 for multiple PH conformers compare with experimental values of 3.4, 3.28, and <3 (Grauschopf et al. 1995; Huber-Wunderlich and Glockshuber 1998; Charbonnier et al. 1999). Both the single and multiple conformer calculations for DsbA reproduce the key feature of substantial C30 pKa reduction from a model compound value of 8.3.
Figure 1.
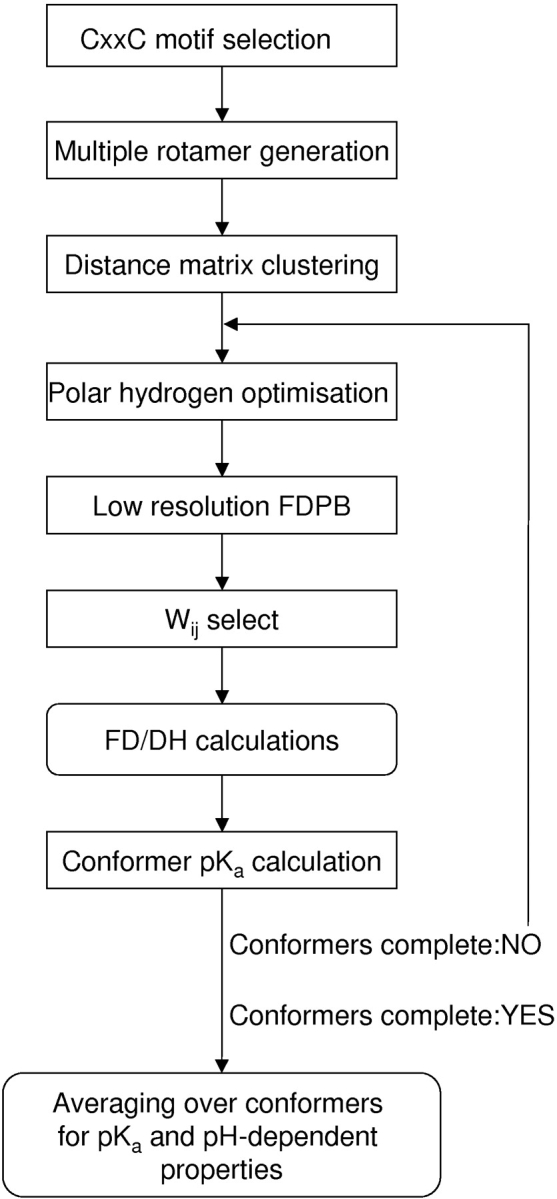
Schematic diagram of the calculation method, described in Materials and Methods.
Figure 2.

Segmentation and conformer analysis. (A) Segments of reduced human thioredoxin (1ert), with color-coding according to distance from the SG atom of C32: green, 5 Å; pink, 10 Å; blue, 15 Å; yellow, 25 Å; and purple, 40 Å. The Cαtrace of the α-β-pro turn segment used for separate calculation is shown in ball-and-stick representation, and side chains are displayed for the CGPC motif. (B) Conformer clustering example shown for CSFC. A library (Tuffery et al. 1997) provides three rotamers for ser and four for phe, giving a total of 12 conformers. These are reduced to six upon removal of significant clashes with surrounding protein, constituting the color-coded SF rotamers (3/ser, 2/phe). The matrix of RMS distance deviations between these conformers is used for clustering, in this case (threshold = 2.0 Å) to just one conformer (with teal-colored rotamers). A threshold giving greater than one cluster requires processing beyond the first row of the RMS distance deviation matrix.
Table 1.
Protein region contributions in cysteine pKacalculations
| Protein (fragment)/conformers | Trx pKa (calculated)(experimental pKa = 6.3) | DsbA pKa (calculated)(experimental pKa = 3.4) |
| Native/single | 7.1 | 2.6 |
| 5 Å sphere/single | 9.2 | 3.9 |
| 10 Å sphere/single | 7.2 | 2.5 |
| 15 Å sphere/single | 7.2 | 2.7 |
| 25 Å sphere/single | 7.1 | 2.5 |
| 40 Å sphere/single | 7.1 | 2.5 |
| CxxC/single | 7.9 | 4.2 |
| α-β-pro turn/single | 7.0 | 3.0 |
| Native/multi | — | 4.3 |
| CxxC/multi | — | 5.5 |
| α-β-pro turn/multi | — | 4.3 |
FDPB calculations were made with ɛp = 4 and ɛs = 78.4, at 0.15 M ionic strength. Native protein refers to a monomer from the lert (thioredoxin) or 1a21 (DsbA) coordinate files. Spheres of given radius were centered on the SG atom of the more exposed thiolate. The α-β-pro turn fragments consisted of residues 21 to 50 and 73 to 76 for thioredoxin, and 21 to 50 and 149 to 152 for DsbA. Single conformer refers to the crystal structure, and multiple conformers for DsbA were derived from variations in packing of the PH intervening sequence (not applicable for the single conformer of residues GP in thioredoxin). Experimental pKas from Forman-Kay et al. (1992; trx) and Grauschopf et al. (1995; DsbA).
Variation of sphere radius, centered on exposed thiolate SG, describes protein fragments, in which any amino acid with an atom within the sphere is included in full. These give small changes relative to full protein for single conformer calculations, except at 5 Å radius (Table 1). The CxxC motif of DsbA gives a pKa shift from full protein of 1.6 units for single and 1.2 units for multiple conformer calculations, so that CxxC alone is responsible for a large part of the reduction from the model compound pKa of 8.3. Adding back the α-β-pro turn element bearing the CxxC motif and the adjacent turn carrying a conserved proline residue (Charbonnier et al. 1999), rather than a spherical segment, largely recovers the full protein result. For thioredoxin, the single conformer calculations give a smaller difference between CxxC and full protein C32 pKas (7.9 vs. 7.1). These results support the observation that the CxxC motif itself contributes significantly to redox/pKa variation in the superfamily, (Grauschopf et al. 1995; Chivers at al. 1997; Huber-Wunderlich and Glockshuber 1998) but also highlights key structural features in the immediate vicinity of the CxxC motif that are important. Such effects can vary between proteins, namely, thioredoxin and DsbA in this case.
Although the multiple conformer calculations are not clearly better or worse in comparison to experiment for the thioredoxin and DsbA calculations reported in Table 1, conformational sampling could play a role for computations with substituted motifs, particularly given the importance of the xx motif in redox and pKa properties. In generating multiple side-chain conformations in the xx motif, the packing tolerance can be adjusted to allow various degrees of steric clash (Cole and Warwicker 2002). A higher tolerance could mimic limitations in the rotamer library (Tuffery et al. 1997) or possibly a degree of main-chain movement that is excluded in the current packing model. Too high a tolerance will simply allow all possible side-chain rotamers with no steric exclusion. The tolerance was set by visual inspection of the allowed xx rotamer combinations. Then a clustering algorithm was used to reduce the number of conformers required in pKa calculations, described in the next section. Computation time is further reduced by limiting variable ionizations to those with significant impact on the cysteine pKas. Ionizable groups with maximal interaction to the active site cysteines of <1 kJ/mole were given a charge according to model compound pKas and neutral pH. This approximation made no significant difference when compared with full pKa calculations.
Clustering conformers with a distance matrix
For each xx motif, a matrix of root mean square (RMS) distance deviations between conformers was generated, with subsequent clustering according to an RMS distance threshold. Figure 2B ▶ illustrates this process of conformer generation and conformer clustering for the CSFC motif. Increasing the threshold from 0.5 Å to 1.0, 1.5, 2.0, and 2.5Å reduced the number of conformers sampled by the pKa calculations and decreased significantly the duration of the calculations (e.g., computation at 2.5 Å is 10 times faster than that with no clustering; Table 2). The reduction in computation time is generally accompanied by only a small change in calculated pKas, as demonstrated by calculations for DsbA wild type and mutants, shown in Table 2. On this basis, an RMS distance threshold of 2.0 Å for clustering was used in multiple conformer calculations.
Table 2.
Calculated wild-type and mutant DsbA C30 pKas with conformer clustering
| Motif | Null/1.0 | 0.5 Å/0.9 | 1.0 Å/0.8 | 1.5 Å/0.5 | 2.0 Å/0.2 | 2.5 Å/0.1 |
| PH | 4.3 | 4.2 | 4.1 | 4.0 | 4.0 | 4.0 |
| SV | 5.7 | 5.7 | 5.7 | 5.5 | 5.5 | 5.5 |
| SF | 5.6 | 5.6 | 5.4 | 5.4 | 5.4 | 5.4 |
| PL | 5.4 | 5.4 | 5.4 | 5.5 | 5.5 | 5.5 |
| ST | 5.6 | 5.6 | 5.6 | 5.3 | 5.3 | 5.6 |
| QL | 5.9 | 5.9 | 5.9 | 6.0 | 6.0 | 6.0 |
| TR | 5.0 | 5.0 | 5.0 | 5.1 | 5.1 | 5.0 |
| LT | 5.8 | 5.8 | 5.8 | 5.8 | 6.0 | 5.5 |
| PP | 6.1 | 6.1 | 6.1 | 6.1 | 6.1 | 6.1 |
Multiple conformer FDPB calculations were made for DsbA wild type and mutants, showing the clustering RMS distance/decrease in computation time relative to the calculation without clustering (Null/1.0).
Comparison with experiment for DsbA mutants
Measured pKas are available for the DsbA mutants used to test conformer clustering (Grauschopf et al. 1995). Differences between wild-type and mutant pKas, rather than the absolute pKas, have also been calculated with a single conformer FDPB method (Warwicker and Gane 1996). The current FDPB method is directed toward accurate calculation of absolute cysteine pKas (Warwicker 1997). Figure 3 ▶ shows experimental and calculated pKas for this series of DsbA mutants, as well as further DsbA mutants (Huber-Wunderlich and Glockshuber 1998) and thioredoxin mutants (Mössner et al. 1998).
Figure 3.

Calculated and experimental C30 pKas for DsbA and thiore-doxin wild type and mutants. A model compound pKa of 8.3 (free cys) was used in pKa calculations. Methods FD and FD/DH are described in the text.
Multiconformer FDPB calculations are compared with an adaptation that we label FD/DH. In general, the FD/DH technique mimics conformational relaxation for ionizable side chains that are relatively flexible, through combination of the FDPB/ɛp = 4 calculation with an additional estimate of interactions in a Debye-Hückel (DH, ɛp = 78.4) scheme for that ionizable side chain. The DH scheme represents electrostatic interactions in a water-dominated environment, so that access to it is controlled by an estimate of maximal solvent accessibility (SA; J. Warwicker, in prep.; see Materials and Methods). In effect, surface ionizable groups have access to the DH regime, whereas more restricted and buried groups do not. In the flow of multiconformation calculations (Fig. 1 ▶), side-chain conformations of ionizable groups within the xx motif are sampled explicitly for FD calculations and are excluded from DH modeling. Figure 3 ▶ shows that the scale of pKa shift from model compound value is predicted well across the DsbA and thioredoxin mutants, with FD/DH performing somewhat better than FDPB alone. In addition, the overall increase of pKa from wild type to mutants is reproduced. We anticipate that the PP mutant may accommodate a small main-chain rearrangement that has not been modeled and that may account for the larger discrepancy to experiment in this case. In general, the results suggest that our multiconformer calculations, with clustering of conformers as well as the FD/DH scheme to model pH-induced relaxation around the CxxC motif, can be used as a predictive tool for pKa values in the thioredoxin superfamily.
The pH dependence of redox potential
Variation of redox potential with pH was calculated for thioredoxin and DsbA, using the pH dependence of free energy (Fig. 4 ▶; Materials and Methods). The difference in pH dependence of redox potential between thioredoxin and DsbA was compared with a plot derived from experimental data (thioredoxin, Takahashi and Creighton 1996; DsbA, Nelson and Creighton 1994). These data were obtained from the pH dependence of the equilibrium constants for the reaction between each of thioredoxin and DsbA with glutathione, and application of the Nernst equation at different pH values. Agreement of the pH dependence is good (Fig. 4 ▶), in support of our model for calculation of pKas and pH-dependent properties in the thioredoxin superfamily. The comparison also clearly indicates that there exists a significant pH-independent contribution to the redox potential difference between thioredoxin and DsbA, in line with previous analysis (Chivers et al. 1997). The molecular basis of this pH-independent term is unknown. In Figure 5 ▶, crystallographic B factors for oxidized and reduced DsbA and human thioredoxin are compared. A larger change of conformational variability upon disulfide making/breaking is evident for E. coli DsbA than for human thioredoxin, in the loops shown to the right of the active sites in this view. This could in principle contribute to the pH-independent term, with enhanced flexibility in the reduced state giving an entropic term that would favor the reduced form (DsbA vs. thioredoxin, as observed).
Figure 4.
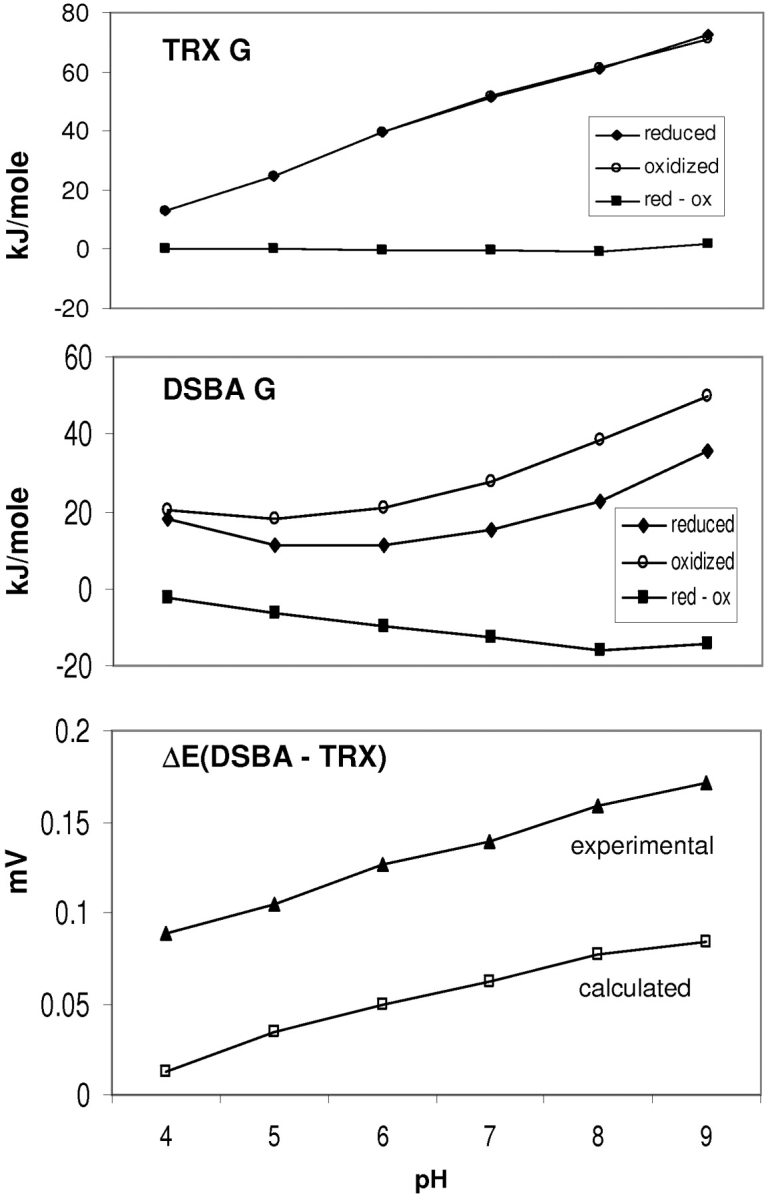
The pH dependence of G and redox potential difference for thioredoxin and DsbA. Energies were calculated for the subsets of ionizable groups with significant interaction to the active site, for each of reduced and oxidized forms, and the difference between them. Calculated pH dependence of redox potential (DsbA - thioredoxin) was obtained from the Nernst equation (Materials and Methods), and the equivalent experimental property from Nelson and Creighton (1994) and Takahashi and Creighton (1996).
Figure 5.

B-factor plots around the active sites for oxidized and reduced human thioredoxin and E. coli DsbA. Coordinates used were 1ert (reduced) and 1eru (oxidized) for thioredoxin and 1a2l (reduced) and 1a2j (oxidized) for DsbA. Active site cysteines are shown in white, with color-coding blue (lower) to green (higher) crystallographic B-factor.
The good agreement for the pH dependence of redox potential reflects, via the Nernst equation, that our calculations are accurately predicting the active site cysteine pKas. A residual pH-independent term for the DsbA/thioredoxin comparison demonstrates that redox potential cannot be quantitatively correlated with pKa (Chivers et al. 1997) across the superfamily, although it is likely that such discrepancies will be smaller within branches of the superfamily. However, the qualitative relationship between active site pKas and redox potential is consistent with the pKa of the more exposed thiolate being indicative of an activity profile for a superfamily member (Grauschopf et al. 1995; Kortemme et al. 1996).
Predictions of pKas across the thioredoxin superfamily
To investigate the relationship between exposed thiolate pKa and activity profiles on the one hand, and xx motif character and framework structures on the other, we have applied the pKa calculation method to a number of framework structures and a set of xx motifs. The pKas and structures represent a range of activities. Calculated/measured pKas for wild-type proteins (references for the experimental values) were as follows: 4.3/3.4 for DsbA (PH, Grauschopf et al. 1995), 4.9/4.1 for DsbC (GY, Sun and Wang 2000), 7.4/6.8 for T4 phage glutaredoxin (Wang et al. 2004), and 7.1/6.3 for human thioredoxin (GP, Forman-Kay et al. 1992). These results show good agreement between the calculation scheme of Figure 1 ▶ and measured values.
Next, motifs were taken from known homologs of these four proteins in the SwissProt database and used to calculate pKas for substitutions both in the relevant family and across these four proteins as representatives of the thioredoxin superfamily (Fig. 6 ▶). The inclusion of both naturally occurring and hypothetical sequences gives a clear picture of background coordinate effects for each motif in the data set. The overall separation between calculations for different background proteins clearly demonstrates that protein environ-within the motif set for each background protein shows that the motif also contributes significantly to pKa modulation. Assuming a qualitative relationship between pKa and redox potential, it can be concluded that both motif and protein environment contribute to determining the spectrum of redox functions across the thioredoxin superfamily.
Figure 6.

Cysteine pKa spectrum for thioredoxin superfamily proteins. Calculated pKas are shown for the more exposed active site thiol groups of DsbA, thioredoxin, DsbA, and T4 glutaredoxin, each with the listed motifs. (Right) Calculated pKa ranges for the subsets of motifs associated with each protein in sequence database analysis, as well as (open squares) measured pKas for wild-type proteins.
Discussion
Accuracy of pKa calculations in the thioredoxin superfamily
Our method gives cysteine pKas in different CxxC motifs, in varying thioredoxin superfamily frameworks, using multiple conformers of the xx residue side chains and subsequent conformational clustering to speed computation (Fig. 1 ▶). It uses FDPB methodology, supplemented with polar hydrogen optimization, modification for hydration entropy changes upon charge burial (Warwicker 1997), and an FD/ DH combination that uses water-dominated interactions for clearly solvent-accessible ionizable groups outside of the active site (Materials and Methods; J. Warwicker, in prep.). Reasonable matches to experimental pKas are obtained for wild-type proteins (Table 1; Fig. 6 ▶), and for series of DsbA and thioredoxin mutants (Grauschopf et al. 1995; Table 2; Fig. 3 ▶).
The calculations also give a graphic illustration of the importance of both the xx motif (vertical extent of each plotted line in the left panel of Fig. 6 ▶) and the surrounding protein (differences between these lines at each motif data-point), in establishing pKa variation. Results from Table 1 indicate that, as far as charge interactions are concerned, the major influence of protein environment is within the neighborhood of the active site. Indeed, CxxC sequences alone, with backbone and cysteine side-chain conformations fixed by the starting structure, can give large pKa deviations from free cysteine. Our approximation (Fig. 6 ▶) of homolog modeling with xx motif changes in each framework structure may therefore be reasonable. Comparative modeling would not reliably predict any large-scale changes in backbone conformation from the framework structures, but it would include ionizable group substitutions around the CxxC segment.
Figure 6 ▶ (right) indicates that there may be a relatively small degree of systematic overestimation of cysteine pKas. The empirical entropy term describing the difference in water structuring between charged and neutral states can be substantial for cysteines (probably due to weak hydrogen-bonding in the neutral state). It is possible that error in parameterization of this term (J. Warwicker, in prep.), contributes to the current overestimation. However, this does not alter the general result of assigning proteins within the broad range of ionizations demonstrated by the thioredoxin superfamily. For example, T4 glutaredoxin might, on the basis of sequence comparison, be assumed to possess the low pKa of the glutaredoxin family, and yet its calculated value (Fig. 6 ▶) is much higher and thioredoxin-like, also evident from experiment (Wang et al. 2004).
The predictive method is also aimed at thioredoxin superfamily members without experimental structures and with sequence changes outside the CxxC motif. This aspect mirrors sequence database analyses of CxxC motifs (Fomenko and Gladyshev 2002, 2003; Kinch et al. 2003), so that cysteine pKa prediction would aid functional investigation for proteins assigned to the thioredoxin superfamily. Comparative models are one route to this objective, but Table 1 suggests an alternative. The α-β-pro turn fragment of the closest homolog within the structural database should provide a reliable subframework on which to make pKa calculations. In more general terms, outside the thioredoxin superfamily, our method for cysteine pKa prediction (with-out the CxxC multiconformer branch) could be of use in functional studies, for example, of S-thiolation.
Comparison of cysteine pKas in the active site
In general, it is found that the more N-terminal cysteine takes the lower pKa of the cysteine pair. This matches experiment for many members of the thioredoxin superfamily and previous electrostatics calculations (Gane et al. 1995; Dillet et al. 1998; Foloppe et al. 2001; Foloppe and Nilsson 2004). Current calculations show clearly that it is differential SA that favors ionization of the more N-terminal cysteine. For human thioredoxin, the ΔpKa components from the Born energy (continuum electrostatic dehydration) part of FDPB calculation are 4.6 for C32 and 12.0 for C35. This is more than compensated by favorable terms for charge–charge interactions and dehydration entropy (Warwicker 1997) to give a net reduction from model compound pKa for C32 (8.3 to calculated value of 7.1). For C35, the favorable terms do not match the Born energy, with the added unfavorable component of interaction with the C32 thiolate, leading to the elevated pKa. Comparison for C30 and C33 of DsbA is analogous, again with relative SA determining pKas. Although computational work establishes a molecular basis for ΔpKas of active site cysteines, it does not exclude a degree of proton sharing between thiol groups (Jeng et al. 1995). In addition, the behavior of the more buried cysteine in reoxidation from the mixed disulfide state (Lappi et al. 2004) can be probed with calculations on the complete reaction cycle.
Variation in pKa calculations for conformers of a single xx motif is generally small. For example, individual conformers for DsbA PH give pKas within a range of 1.3 around the statistical average value of 4.3. For this motif, variation in the ΔpKa components from dehydration is even smaller, with most of the pKa range arising from the potential for charge–charge interactions between C30 and H32 side chains. These calculations are therefore probing general properties of active site structure in the thioredoxin superfamily, rather than particular side-chain conformations.
pH-independent contributions to redox potential differences in the thioredoxin superfamily
Comparative calculations for thioredoxin and DsbA show that the difference in pH dependence of redox potential is predicted well (Fig. 4 ▶), but with a clear discrepancy across the pH-range that matches previous description of a pH-independent term (Chivers et al. 1997). It has been found that DsbA wild type and mutants map reasonably to a quantitative correlation between thiolate pKa and redox potential (Grauschopf et al. 1995; Huber-Wunderlich and Glockshuber 1998). With a smaller number of datapoints, such a correlation appears weaker for thioredoxin (Chivers et al. 1997). If altered flexibility (Fig. 5 ▶) contributes significantly to redox potential differences across the thioredoxin superfamily, then it might be expected that such variation would be greater between structural families than within, because larger differential flexibility is likely to associate with the larger structural differences between families. Comparing redox potentials in the superfamily (Åslund et al. 1997), DsbC (~160 mV) would be grouped with DsbA both structurally and in terms of redox potential/pKa (4.1) correlation. DsbA and DsbC both have helical insert domains relative to thioredoxins and glutaredoxins. Residues highlighted by Figure 5 ▶ (F63 and M64) lie on the loop that leads into the insert domain of DsbA. The closest equivalent residue for DsbC is R125. Glutaredoxin 3 from E. coli has a low pKa similar to DsbA and DsbC but a redox potential of ~−200 mV, grouping it with the thioredoxins and glutaredoxins in terms of redox potential/pKa correlation.
We propose that the pH-independent contribution to redox potential is most significant when moving between the DsbA/C family and the thioredoxin and glutaredoxin families. If this is the case, then it should be possible to make reasonable predictions of redox potentials by referencing electrostatic calculation of the pH-dependent part to a measured value within that family. The hypothesis implies that DsbA reduction should lead to an increased number of low-energy conformations around the active site. In this context, the solution structure of reduced DsbA shows a large number of side-chain rotamer combinations for F63 and M64 that fit the NMR distance constraints in this region (Schirra et al. 1998).
It will also be possible to extend both the pKa and redox potential methodologies to investigate functional variation in other branches of the thioredoxin superfamily, such as differences between DsbE homologs (Goulding et al. 2004).
Materials and methods
Protein structures
Coordinate files from the Protein Data Bank (PDB; Berman et al. 2000) were taken from X-ray crystallography, with reduced structure at the active site where available. The current study is designed to cover maximal ground for the thioredoxin superfamily, rather than to concentrate on the main-chain and side-chain conformational variability that NMR provides for a single protein (Dillet et al. 1998). Coordinates used for calculations, with active site cysteine numbers, were as follows: 1ert, reduced human thioredoxin, C32, and C35 (Weichsel et al. 1996); 1a2l, reduced E. coli DsbA, C30, and C33 (Guddat et al. 1998); 1aaz, oxidized T4 phage glutaredoxin, C14, and C17 (Eklund et al. 1992); 1eej, oxidized E. coli DsbC, C98, and C101 (McCarthy et al. 2000); and 2trx, oxidized E. coli thioredoxin, C32, and C35 (Katti et al. 1990).
Where the asymmetric unit contains more than one polypeptide chain, the first was used for calculation. Water molecules were removed. In cases for which reduced crystal structures were not available, a model of the reduced form was made by breaking the disulfide bond of the oxidized form and torsioning around the Cα-Cβ bond of the more exposed cysteine side chain to give an Sγ-Sγ distance of 3.7 Å. This method was based on graphics analysis of pairs of experimentally derived reduced/oxidized structures and with reference to the NMR structure of reduced E. coli thioredoxin (Jeng et al. 1994). QUANTA (Accelrys), and SwissPdb-Viewer (Guex and Peitsch 1997) software were used for molecular manipulation and plotting.
Overall calculation scheme and CxxC motif selection
Figure 1 ▶ shows the overall flow of calculation, from placement of CxxC motif onto a background set of coordinates, generation and clustering of rotamers, electrostatics and pKa calculations, and averaging over conformers. Some computation was made with wild-type protein or with a restricted set of CxxC motifs (for the DsbA mutants of Grauschopf et al. 1995), but the target is to compute any combination of CxxC motif and framework structure, as shown in Figure 6 ▶. For these last calculations, a set of motifs associated with thioredoxin, DsbA, and DsbC was found through homolog identification in the SwissProt database. Computer programs implementing this scheme are available from the authors.
Multiple rotamer generation and clustering by distance matrix
When swapping xx residues in a framework structure, it is assumed that main-chain conformation remains the same but that side-chain conformation can vary. Library rotamers (Tuffery et al. 1997) for residues xx are tested against the background of fixed protein (including active site cysteine side chains). A packing tolerance was allowed such that sets of xx rotamers produced were consistent with visual inspection for examples containing aromatic residues. To reduce the computation associated with pKa calculations for multiple conformers with each xx motif, a distance clustering method was developed (Fig. 2B ▶). A matrix of RMS distance comparisons (including all nonhydrogen atoms) was constructed for conformers generated by an xx motif. These were clustered according to a distance threshold, with one representative conformer included for each cluster. Performance was compared for variation in the threshold value (Table 2).
Electrostatics calculations
For each conformer included in the distance matrix clustering of xx side-chain rotamer combinations, the pH dependence of electrostatic free energy was calculated. Following the method of Nielsen et al. (1999), we first applied a simple polar hydrogen optimization routine for the hydroxyl hydrogens of serine and threonine, whereby torsions were sampled every 12° in a background of coulombic interaction with other charges (excepting that hydroxyl). This procedure did not significantly impact on results in these systems (data not shown), although, in general, polar hydrogen optimization can be important (Nielsen et al. 1999). We have not modeled partial charge of the neutral cysteine SH group in this study, in keeping with the relatively small dipole moment of this group and with our focus on net charge difference between neutral and charged forms of ionizable groups.
Next, a low resolution (1 Å focus grid step) FDPB calculation (Warwicker and Watson 1982; Warwicker 1998) is made to identify those ionizable groups with interaction to the active site cysteines >1 kJ/mole. These residues are included in the pKa calculations, and the others have charge fixed according to model compound pKas at pH 7.0. This subset selection (Fig. 1 ▶, Wij select) showed no significant difference to pKa calculations without this restriction and makes computation of ionizable group contributions to electrostatic free energy (Ges,ionis) tractable over a large number of such calculations (next section).
Typically eight to 10 groups, including the cysteines, are in the titrating subset for each xx motif (this set stays constant over conformers for a motif). Either FD or FD/DH calculations are carried out for each conformer. FD/DH denotes FDPB coupled to DH computation in a scheme that improves agreement to a large set of measured pKas (J. Warwicker, in prep.), whereas FD denotes FDPB alone. Briefly, with regard to FD/DH, for each ionizable group outside of the CxxC motif, the standard FDPB interaction scheme (protein relative dielectric, ɛp = 4; water, ɛw = 78.4) is implemented for the experimental structure. A DH (ɛp = ɛw = 78.4) scheme is also possible for that group if it is relatively flexible and surface-located, in which case both sets of interactions are included in the sampling over protonated and unprotonated ionization states. Residues within the CxxC motif are either relatively buried (the cysteines) or conformationally sampled explicitly (xx) and are therefore sampled as FD-only in the FD/DH scheme. This technique makes some difference to computed results (see Fig. 3 ▶ for FD comparison to FD/DH) but does not alter qualitative conclusions. The relatively small FD/DH difference to FD may result from common treatment of CxxC residues (FD-only) in the current study. Both FD and FD/DH pKa calculations include an empirical term describing the gain in entropy from water liberation upon ionizable group burial. Parameterization of this term, which is specific for each class of ionizable group, was made separately from the current study (J. Warwicker, in prep.).
Model compound pKas and charge assignment for ionizable group atoms were as follows: Arg 12.0 0.5/NH1 0.5/NH2; Lys 10.4 1.0/NZ; His 6.3 0.5/ND1 0.5/NE2; Asp 4.0 −0.5/OD1 −0.5/ OD2; Glu 4.4 −0.5/OE1 −0.5 OE2; Cys 8.3 −1.0/SG; Tyr 10.2 −1.0/OH, N-t 7.5 1.0/N; and C-t 3.8 −0.5/O −0.5/OXT. An ionic strength of 0.15 Molar was used throughout (FDPB and DH calculations).
Electrostatic energy and averaging over conformers
Energies are required both for statistical averaging of conformer properties (this section) and calculation of differences in redox potential (next section). We take ionizable group contributions to the electrostatic energy (Ges,ionis) as the determinant of differences between conformations, neglecting other factors. Because the calculation scheme defines a subset of groups that have interactions >1 kJ/mole with the active site cysteines, this relatively small number allows us to derive Ges,ionis directly from the ionization states partition function as −RTlnZ. Energy is derived as the difference between the folded (N) state and a model of the unfolded (U) state in which the same ionizable groups lack charge-charge interactions, that is, ΔGNUes,ionis = GNes,ionis − GUes,ionis. It is becoming apparent that such a model for the unfolded state can be poor (Warwicker 1999), but in this case, the entire GUes,ionis component will cancel, applying equally to all reduced state conformers with the same CxxC motif. Then, for pH point i, the mean fractional protonation for cysteine j, over conformers k, is
 |
where the denominator is the partition function, Z(i), for conformer energies at pH i, and f(ijk) is the fractional protonation for conformer k of cysteine j at pH i, evaluated from pKa analysis (Bashford and Karplus 1990) on each conformer. The pKa for the side chain of cysteine j is then given by linear interpolation between pH points to give half protonation.
Redox potential calculation
To obtain redox potential changes, energies for the reduced and oxidized states are required in the multiconformer calculations. Within the individual conformer loop of Figure 1 ▶, electrostatics calculations are made both for the reduced form and the oxidized form. The oxidized form was modeled with torsioning about Cα-Cβ of the more N-terminal cysteine to give an Sγ–Sγ distance of 2.1 Å, in otherwise fixed coordinates from the reduced form. Then free energy was calculated over conformers (k) as ΔGNU = −RTlnZ(i) for each of the reduced and oxidized forms, giving for pH i ΔΔGNU(red-ox) = −RTln[Zred(i)/Zox(i)], where the “es,ionis” subscript is omitted for simplicity. Two aspects of this calculation should be noted. First, we have enforced the same conformers in the oxidized form as the reduced form, so that electrostatic energies are directly compared, with no free energy contribution from alterations in the number of allowed rotamers. Second, we are seeking differences between reduced and oxidized forms in the folded state, using values that are differenced to an unfolded state model (without charge–charge interactions). A thermodynamic cycle linking reduced and oxidized forms in N and U states, gives
 |
The discrepancy between ΔGNred/ox and calculated ΔΔGNUred/ox is therefore ΔGUred/ox, but in the simple isolated amino-acid U model, this term will always consist of two noninteracting cysteines for each protein and will therefore cancel in comparison between thioredoxin superfamily proteins. Calculation of redox potential difference between thioredoxin and DsbA was made by reference to the Nernst equation for 2 electron transfer and differencing ΔΔGNUred/ox between the proteins. The corresponding experimental difference, over the range pH 4.0 to 9.0, was taken from Takahashi and Creighton (1996) for thioredoxin and from Nelson and Creighton (1994) for DsbA.
Acknowledgments
This work was supported by a UMIST Life Sciences Initiative Studentship (E.M.). We thank Dr Christian Cole for discussions.
The publication costs of this article were defrayed in part by payment of page charges. This article must therefore be hereby marked “advertisement” in accordance with 18 USC section 1734 solely to indicate this fact.
Article published online ahead of print. Article and publication date are at http://www.proteinscience.org/cgi/doi/10.1110/ps.04804504.
References
- Åslund, F. and Beckwith, J. 1999. The thioredoxin superfamily: Redundancy, specificity, and gray-area genomics. J. Bacteriol. 181 1375–1379. [DOI] [PMC free article] [PubMed] [Google Scholar]
- Åslund, F., Berndt, K.D., and Holmgren, A. 1997. Redox potentials of glutaredoxins and other thiol-disulfide oxidoreductases of the thioredoxin superfamily determined by direct protein–protein redox equilibria. J. Biol. Chem. 272 30780–30786. [DOI] [PubMed] [Google Scholar]
- Bashford, D. and Karplus, M. 1990. pKa’s of ionizable groups in proteins: Atomic detail from a continuum electrostatic model. Biochemistry 29 10219–10225. [DOI] [PubMed] [Google Scholar]
- Berman, H.M., Westbrook, J., Feng, Z., Gilliland, G., Bhat, T.N., Weissig, H., Shindyalov, I.N., and Bourne, P.E. 2000. The Protein Data Bank. Nucleic Acids Res. 28 235–242. [DOI] [PMC free article] [PubMed] [Google Scholar]
- Charbonnier, J.B., Belin, P., Moutiez, M., Stura, E.A., and Quemeneur, E. 1999. On the role of the cis-proline residue in the active site of DsbA. Protein Sci. 8 96–105. [DOI] [PMC free article] [PubMed] [Google Scholar]
- Chivers, P.T., Prehoda, K.E., and Raines, R.T. 1997. The CXXC motif: A rheostat in the active site. Biochemistry 36 4061–4066. [DOI] [PubMed] [Google Scholar]
- Cole, C. and Warwicker, J. 2002. Side-chain conformational entropy at protein–protein interfaces. Protein Sci. 11 2860–2870. [DOI] [PMC free article] [PubMed] [Google Scholar]
- Debarbieux, L. and Beckwith, J. 2000. On the functional interchangeability, oxidant versus reductant, of members of the thioredoxin superfamily. J. Bacteriol. 182 723–727. [DOI] [PMC free article] [PubMed] [Google Scholar]
- Dillet, V., Dyson, H.J., and Bashford, D. 1998. Calculations of electrostatic interactions and pKas in the active site of Escherichia coli thioredoxin. Biochemistry 37 10298–10306. [DOI] [PubMed] [Google Scholar]
- Eklund, H., Ingelman, M., Söderberg, B.O., Uhlin, T., Nordlund, P., Nikkola, M., Sonnerstam, U., Joelson, T., and Petratos, K. 1992. Structure of oxidized bacteriophage T4 glutaredoxin (thioredoxin): Refinement of native and mutant proteins. J. Mol. Biol. 228 596–618. [DOI] [PubMed] [Google Scholar]
- Foloppe, N. and Nilsson, L. 2004. The glutaredoxin -C-P-Y-C- motif: Influence of peripheral residues. Structure 12 289–300. [DOI] [PubMed] [Google Scholar]
- Foloppe, N., Sagemark, J., Nordstrand, K., Berndt, K.D., and Nilsson, L. 2001. Structure, dynamics and electrostatics of the active site of glutaredoxin 3 from Escherichia coli: Comparison with functionally related proteins. J. Mol. Biol. 310 449–470. [DOI] [PubMed] [Google Scholar]
- Fomenko, D.E. and Gladyshev, V.N. 2002. CxxS: Fold-independent redox motif revealed by genome-wide searches for thiol/disulfide oxidoreductase function. Protein Sci. 11 2285–2296. [DOI] [PMC free article] [PubMed] [Google Scholar]
- ———. 2003. Identity and functions of CxxC-derived motifs. Biochemistry 42 11214–11225. [DOI] [PubMed] [Google Scholar]
- Forman-Kay, J.D., Clore, G.M., and Gronenborn, A.M. 1992. Relationship between electrostatics and redox function in human thioredoxin: Characterization of pH titration shifts using two-dimensional homo- and hetero-nuclear NMR. Biochemistry 31 3442–3452. [DOI] [PubMed] [Google Scholar]
- Gane, P.J., Freedman, R.B., and Warwicker, J. 1995. A molecular model for the redox potential difference between thioredoxin and DsbA, based on electrostatics calculations. J. Mol. Biol. 249 376–387. [DOI] [PubMed] [Google Scholar]
- Goulding, C.W., Apostol, M.I., Gleiter, S., Parseghian, A., Bardwell, J., Gennaro, M., and Eisenberg, D. 2004. Gram-positive DsbE proteins function differently from Gram-negative DsbE homologs. J. Biol. Chem. 279 3516–3524. [DOI] [PubMed] [Google Scholar]
- Grauschopf, U., Winther, J.R., Korber, P., Zander, T., Dallinger, P., and Bardwell, J.C.A. 1995. Why is DsbA such an oxidizing disulfide catalyst? Cell 83 947–955. [DOI] [PubMed] [Google Scholar]
- Guddat, L.W., Bardwell, J.C.A., and Martin, J.L. 1998. Crystal structures of reduced and oxidized DsbA: Investigation of domain motion and thiolate stabilization. Structure 6 757–767. [DOI] [PubMed] [Google Scholar]
- Guex, N. and Peitsch, M.C. 1997. SWISS-MODEL and the Swiss-PdbViewer: An environment for comparative protein modelling. Electrophoresis 18 2714–2723. [DOI] [PubMed] [Google Scholar]
- Holmgren, A. 1985. Thioredoxin. Ann. Rev. Biochem. 54 237–271. [DOI] [PubMed] [Google Scholar]
- Honig, B. and Nicholls, A. 1995. Classical electrostatics in biology and chemistry. Science 268 1144–1149. [DOI] [PubMed] [Google Scholar]
- Huber-Wunderlich, M. and Glockshuber, R. 1998. A single dipeptide sequence modulates the redox properties of a whole enzyme family. Fold. Des. 3 161–171. [DOI] [PubMed] [Google Scholar]
- Jeng, M.F., Campbell, A.P., Begley, T., Holmgren, A., Case, D.A., Wright, P.E., and Dyson, H.J. 1994. High-resolution solution structures of oxidized and reduced Escherichia coli thioredoxin. Structure 2 853–868. [DOI] [PubMed] [Google Scholar]
- Jeng, M.F., Holmgren, A., and Dyson, H.J. 1995. Proton sharing between cysteine thiols in Escherichia coli thioredoxin: Implications for the mechanism of protein disulfide reduction. Biochemistry 34 10101–10105. [DOI] [PubMed] [Google Scholar]
- Katti, S.K., LeMaster, D.M., and Eklund, H. 1990. Crystal structure of thioredoxin from Escherichia coli at 1.68 Å resolution. J. Mol. Biol. 212 167–184. [DOI] [PubMed] [Google Scholar]
- Kinch, L.N., Baker, D., and Grishin, N.V. 2003. Deciphering a novel thioredoxin-like fold family. Proteins 52 323–331. [DOI] [PubMed] [Google Scholar]
- Kortemme, T., Darby, N.J., and Creighton, T.E. 1996. Electrostatic interactions in the active site of the N-terminal thioredoxin-like domain of protein disulfide isomerase. Biochemistry 35 14503–14511. [DOI] [PubMed] [Google Scholar]
- Lappi, A.K., Lensink, M.F., Alanen, H.I., Salo, K.E.H., Lobell, M., Juffer, A.H., and Ruddock, L.W. 2004. A conserved arginine plays a role in the catalytic cycle of the protein disulphide isomerases. J. Mol. Biol. 335 283–295. [DOI] [PubMed] [Google Scholar]
- Martin, J.L. 1995. Thioredoxin: A fold for all reasons. Structure 3 245–250. [DOI] [PubMed] [Google Scholar]
- McCarthy, A.A, Haebel, P.W., Törrönen, A., Rybin, V., Baker, E.N., and Met-calf, P. 2000. Crystal structure of the protein disulfide bond isomerase, DsbC, from Escherischia coli. Nat. Struct. Biol. 7 196–199. [DOI] [PubMed] [Google Scholar]
- Mössner, E., Huber-Wunderlich, M., and Glockshuber, R. 1998. Characterization of Escherichia coli thioredoxin variants mimicking the active-sites of other thiol/disulfide oxidoreductases. Protein Sci. 7 1233–1244. [DOI] [PMC free article] [PubMed] [Google Scholar]
- Nelson, J.W. and Creighton, T.E. 1994. Reactivity and ionization of the active site cysteine residues of DsbA, a protein required for disulfide bond formation in vivo. Biochemistry 33 5974–5983. [DOI] [PubMed] [Google Scholar]
- Nielsen, J.E., Andersen, K.V., Honig, B., Hooft, R.W.W., Klebe, G., Vriend, G., and Wade, R.C. 1999. Improving macromolecular electrostatics calculations. Protein Eng. 12 657–662. [DOI] [PubMed] [Google Scholar]
- Schirra, H.J., Renner, C., Czisch, M., Huber-Wunderlich, M., Holak, T.A., and Glockshuber, R. 1998. Structure of reduced DsbA from Escherichia coli in solution. Biochemistry 37 6263–6276. [DOI] [PubMed] [Google Scholar]
- Sun, X.X. and Wang, C.C. 2000. The N-terminal sequence (residues 1–65) is essential for dimerization, activities, and peptide binding of Escherichia coli DsbC. J. Biol. Chem. 275 22743–22749. [DOI] [PubMed] [Google Scholar]
- Takahashi, N. and Creighton, T.E. 1996. On the reactivity and ionization of the active site cysteine residues of Escherichia coli thioredoxin. Biochemistry 35 8342–8353. [DOI] [PubMed] [Google Scholar]
- Tuffery, P., Etchebest, C., and Hazout, S. 1997. Prediction of protein side chain conformations: A study on the influence of backbone accuracy on conformation stability in the rotamer space. Protein Eng. 10 361–372. [DOI] [PubMed] [Google Scholar]
- Wang, Y., Amegbey, G., and Wishart, D.S. 2004. Solution structures of reduced and oxidized bacteriophage T4 glutaredoxin. J. Biomol. NMR 29 85–90. [DOI] [PubMed] [Google Scholar]
- Warwicker, J. 1997. Improving pKa calculations with consideration of hydration entropy. Protein Eng. 10 809–814. [DOI] [PubMed] [Google Scholar]
- ———. 1998. Modeling charge interactions and redox properties in DsbA. J. Biol. Chem. 273 2502–2504. [DOI] [PubMed] [Google Scholar]
- ———. 1999. Simplified methods for pKa and acid pH-dependent stability estimation in proteins: Removing dielectric and counterion boundaries. Protein Sci. 8 418–425. [DOI] [PMC free article] [PubMed] [Google Scholar]
- Warwicker, J. and Gane, P.J. 1996. Calculation of cys 30 Δ pKa’s and oxidising power for DsbA mutants. FEBS Lett. 385 105–108. [DOI] [PubMed] [Google Scholar]
- Warwicker, J. and Watson, H.C. 1982. Calculation of the electric potential in the active site cleft due to α-helix dipoles. J. Mol. Biol. 157 671–679. [DOI] [PubMed] [Google Scholar]
- Weichsel, A., Gasdaska, J.R., Powis, G., and Montfort, W.R. 1996. Crystal structures of reduced, oxidized, and mutated human thioredoxins: Evidence for a regulatory homodimer. Structure 4 735–751. [DOI] [PubMed] [Google Scholar]