

Abstract
The accuracy of in vivo incorporation of amino acids during protein biosynthesis is controlled to a significant extent by aminoacyl-tRNA synthetases (aaRS). This paper describes the application of the HierDock computational method to study the molecular basis of amino acid binding to the Escherichia coli methionyl tRNA synthetase (MetRS). Starting with the protein structure from the MetRS cocrystal, the HierDock calculations predict the binding site of methionine in MetRS to a root mean square deviation in coordinates (CRMS) of 0.55 Å for all the atoms, compared with the crystal structure. The MetRS conformation in the cocrystal structure shows good discrimination between cognate and the 19 noncognate amino acids. In addition, the calculated binding energies of a set of five methionine analogs show a good correlation (R2 = 0.86) to the relative free energies of binding derived from the measured in vitro kinetic parameters, Km and kcat. Starting with the crystal structure of MetRS without the methionine (apo-MetRS), the putative binding site of methionine was predicted. We demonstrate that even the apo-MetRS structure shows a preference for binding methionine compared with the 19 other natural amino acids. On comparing the calculated binding energies of the 20 natural amino acids for apo-MetRS with those for the cocrystal structure, we observe that the discrimination against the noncognate substrate increases dramatically in the second step of the physical binding process associated with the conformation change in the protein.
Keywords: HierDock, synthetase, methionine, MetRS, selectivity, conformational change
Specificity of recognition of amino acids by their corresponding tRNA and aminoacyl-tRNA synthetase (aaRS) plays a critical role in the faithful translation of the genetic code into protein sequence information. The aaRS catalyzes a two-step reaction in which the cognate amino acid is esterified to the 3′-end of its cognate tRNA (Ibba and Soll 2000). In the first step of this reaction, the amino acid and ATP are activated by the aaRS to form an enzyme-bound aminoacyl–adenylate complex. In the second step, the activated amino acid is transferred to the 3′-ribose of the conserved CCA-3′-end of the cognate tRNA. The fidelity of protein synthesis depends, in part, on the accuracy of this aminoacylation reaction, leading to the formation of the aminoacyl–adenylate complex. The aminoacyl–adenylate formation involves recognition of the cognate amino acid by the corresponding aaRS. The recognition of the cognate amino acid by the aaRS is again a multistep process, which uses both physical binding of the cognate amino acid and chemical proofreading to enhance fidelity (Freist et al. 1998). Thus, the four major steps involved in the transfer of aminoacyl group to the t-RNA are (1) physical binding of amino acid and the ATP to aaRS induces a conformational change in the aaRS and leads to formation of the aminoacyl–adenylate complex—this binding and subsequent activation event is necessary but not sufficient for the incorporation of the analog or the cognate amino acid during protein biosynthesis; (2) elimination of misactivated noncognate aminoacyl–adenylate complex; (3) transfer of the aminoacyl group to the t-RNA, pretransfer proofreading; and (4) elimination of mischarged tRNA by a posttransfer proofreading step. Each of these four steps leads to increased specificity toward the cognate amino acid, while discriminating more efficiently against the noncognate amino acids (Freist et al. 1998). However, the degree to which each aaRS uses the specificity enhancing steps varies considerably among the 20 naturally occurring amino acids and the type of aaRS. For example, tyrosyl t-RNA synthetase has the highest specificity in the first binding step, whereas isoleucyl tRNA synthetase achieves maximum discrimination in the pre-transfer proofreading step (Freist et al. 1982, 1987, 1988; Freist and Sternbach 1988).
Many research groups have used in vivo methods to incorporate nonnatural amino acid analogs into proteins. The wild-type translational apparatus has been demonstrated to use nonnatural amino acids with fluorinated, electroactive, unsaturated, and other side-chain functions (Mendel et al. 1992; Dougherty et al. 1993; Deming et al. 1994, 1996, 1997; Budisa et al. 1995; Kothakota et al. 1995; Duewel et al. 1997; Liu et al. 1997; van Hest et al. 2000; Zhang et al. 2002a,b). Although the number of amino acids shown conclusively to exhibit translational activity in vivo is growing, it is limited to only those analogs that are able to successfully circumvent the multistep filter mechanisms of the wild-type aaRS to get incorporated.
To understand the molecular basis of amino acid incorporation in polypeptide synthesis and to incorporate a wide range of amino acid analogs into proteins in vivo, it is critical to understand the molecular-level mechanism at each step of the incorporation of amino acids in polypeptide synthesis. Understanding the molecular-level mechanism would also be useful in designing aaRS mutants that incorporate specific analogs and for designing analogs that would be efficiently incorporated (Liu et al. 1997; Datta et al. 2002; Zhang et al. 2002).
MetRS is a member of the class I aaRS, which undergoes a large conformational change upon binding substrate (methionine). MetRS is a dimeric protein with the crystal structure available for Escherichia coli MetRS both in its apo form (PDB code: 1QQT) and as a cocrystal with its native ligand, methionine (PDB code: 1F4L). These crystal structures were solved to 1.85 Å and 2.03 Å resolution, respectively (Mechulam et al. 1999; Serre et al. 2001). We refer to the apo form of E. coli MetRS protein structure as apo-MetRS(crystal) and the cocrystal structure of E. coli MetRS with methionine as met/MetRS(crystal) (please refer to Table 1). The protein conformation in apo-MetRS(crystal) differs from the protein conformation in met/MetRS(crystal) by 0.7 Å RMSD in coordinates (CRMS) of the Cα atoms. However, the CRMS for the residues in the binding site is 1.84 Å, which indicates that the binding site undergoes significant conformational change on methionine binding.
Table 1.
Notations used for various structures in this study
| Notation | Structure |
| MetRS | E. coli methionyl-tRNA synthetase |
| apo-MetRS(crystal) | Crystal structure of apo form of MetRS |
| apo-MetRS(FF) | Structure generated by minimizing apo-MetRS(crystal) using MPSim |
| met/apo-MetRS(HierDock) | Predicted structure of methionine in apo-MetRS(FF) |
| met/MetRS(crystal) | Cocrystal structure of E. coli MetRS with methionine |
| met/MetRS(FF) | Structure generated by minimizing met/MetRS(crystal) using MPSim |
| met/MetRS(HierDock) | Predicted structure of methionine in met/MetRS(FF) |
The rate of incorporating methionine analogs into proteins has been studied both in vivo and in vitro, and it has been demonstrated that MetRS is one of the more permissive aaRSs for incorporating a large number of analogs (Floriano et al. 2000; van Hest and Tirrell 2001). In this paper, we use computational methods to predict the binding site of methionine in MetRS and to determine the specificity and fidelity of MetRS for binding both natural noncognate amino acids and for methionine analogs. Such computations provide the potential for analyzing the molecular-level mechanisms not feasible with experiment. In addition, the computational methods are needed for fast virtual screening of amino acid analogs prior to synthesis and experiment.
Starting with the apo-MetRS(crystal) protein structure, we used HierDock to scan the entire protein (except the anticodon recognition region) to locate the preferential binding site for methionine. HierDock uses no prior information about the binding site from the crystal structure. Methionine binds at the same site as in the met/MetRS(crystal) cocrystal, but has a different side-chain conformation from the methionine bound in met/MetRS(crystal). We refer to this preliminary binding site for methionine in the apo-MetRS structure prior to conformational change in the binding site of the protein, as the “recognition site.” The recognition site includes all residues found in the binding pocket of methionine in met/MetRS(crystal).
HierDock was also used to predict the binding site of methionine starting with met/MetRS(crystal) protein conformation. The binding site predicted for methionine using the protein structure agrees very well with the cocrystal structure met/MetRS(crystal), leading to a CRMS difference of 0.55 Å for all atoms. The binding site and binding energies of the 19 other natural amino acids were determined in both the apo-MetRS(crystal) and met/MetRS(crystal) conformations. Whereas methionine binds most strongly to both apo-MetRS and cocrystal structures, cysteine and glutamate are close competitors for binding to apo-MetRS, and leucine and glutamate are close competitors for binding to met-MetRS.
The binding site of five methionine analogs shown in Figure 1 ▶ were predicted and their corresponding binding energies calculated. The calculated binding energies for the five methionine analogs relative to methionine in the cocrystal conformation agree well (correlation factor of 0.86) with the relative free energies of activation obtained from in vitro kinetic (Kiick et al. 2000, 2001) measurements. The relative free energies of activation calculated from kinetic measurements refer to free energy of activation of the methionine analog by MetRS and not just the binding of the analog. Such a correlation suggests a strategy in which the computations could be carried out for selecting potential new ligands that would most likely bind prior to experimental synthesis and characterization. The details of the methods are described in Materials and Methods; the results are reported in Results and Discussion, followed by the Conclusions.
Figure 1.

Structure of methionine and its analogs optimized using quantum mechanics with the Poisson-Boltzman solvation method. These structures have been used as starting structures for HierDock calculations. MET, L-Methionine; HAG, homoallylglycine; HPG, homopropargylglycine; NLEU, norleucine; TCG, trans-crotglycine; and CCG, cis-crotglycine (ccg). (+) Indicates that these analogs of methionine get incorporated into proteins by in vivo experiments (Kiick et al. 2001).
Materials and methods
Preparation and optimization of structures
Ligand structures
Both the neutral and the zwitterion forms were used for all the 20 natural amino acids as well as for the five methionine analogs (Kiick et al. 2002). The ligands were optimized in their extended conformation at the Hartree-Fock level of Quantum Mechanics (QM; 6–31G** basis set), including solvation using the Poisson-Boltzmann method (PBF) incorporated into the Jaguar QM software (Tannor et al. 1994; Schrödinger), which uses the actual molecular surface to calculate the solvation energy. The Mulliken charge densities at atomic centers calculated from the QM were used as point charges for the subsequent molecular mechanics simulations. The conformations optimized in the QM calculations of the five methionine analogs are shown in Figure 1 ▶.
Preparation and optimization of protein structures
The E. coli apo-MetRS(crystal) structure was obtained from the PDB database (PDB code: 1QQT), which included the fully active monomer α-chain of a homodimer, crystal waters, and a zinc (II) ion (Mechulam et al. 1999). Hydrogens were added to each atom of the protein and optimized using PolyGraf software. Counterions (Na+ and Cl−) were added to the charged residues (Asp, Arg, Glu, and Lys), except where salt bridges are formed. We used the same procedure for the cocrystal structure of E. coli MetRS (PDB code: 1F4L; resolution 1.85 Å).
The Dreiding forcefield (FF) has been used to describe the protein and ligand (Mayo et al. 1990), and Charmm22 charges (MacKerrell et al. 1998) were used for the protein with the solvation effects calculated using Surface Generalized Born (SGB) continuum solvation method (Ghosh et al. 1998) with an internal protein dielectric constant of 2.5 and an external dielectric of 78.5. The SGB continuum solvation method predicts the contributions to the forces arising from polarization of the solvent by the charges of the ligand and protein. This allows the ligand structure to optimize in the presence of solvation, leading to more realistic binding energies that take into account the solvation effects on the ligand/protein structure. The potential energy was minimized using conjugate gradients to a RMS in force of 0.1 kcal/mole Å convergence, and the nonbond interactions were calculated using the Cell Multipole Method (Ding 1992).
The minimized structure [denoted as apo-MetRS(FF)] differs from the apo-MetRS(crystal) structure by just 0.68 Å CRMS over all atoms. The same procedure with the MetRS cocrystal led to a minimized structure [denoted as met/MetRS(FF)] differing from the crystal structure (Serre et al. 2001) by 0.57 Å CRMS. The CRMS values are comparable to what we get with any known crystal structure and minimizing with any standard force field. Prior to docking the various ligands, the crystal waters and other bound molecules were removed to maximize the searchable surface of the protein.
HierDock protocol
The HierDock ligand screening protocol follows a hierarchical strategy for examining conformations, binding sites, and binding energies (Vaidehi et al. 2002). HierDock starts with coarse grain docking to generate several conformations for the protein/ligand complex, followed by molecular dynamics (MD) simulations including continuum solvation methods performed on a subset of good conformations generated from the coarse grain docking. These methods of combining docking and MD simulations have been tested (Wang et al. 2002) and found to work well if at least 2000 protein/ligand configurations are kept from the coarse grain docking methods for the subsequent optimization steps. Keeping just one best conformation from the coarse grain docking method can lead to bad results because the coarse grain methods do not use accurate scoring functions including solvation. The HierDock procedure has been applied successfully to predicting the binding of odorants to membrane-bound olfactory receptors (Floriano et al. 2000; Vaidehi et al. 2002), the binding of sugars to Outer Membrane Protein A (Datta et al. 2003), and the binding of phenylalanine and its analogs to PheRS (Datta et al. 2002).
Free energy perturbation methods (Boresch et al. 1994; Archontis et al. 2001; Banavali et al. 2002; Hughes et al. 2003) generally lead to accurate free energies for binding but are computationally intensive and not readily applicable to docking a large number of ligands to a number of potential binding sites (Halperin et al. 2002). Our goal is to develop a fast computational protocol that combines hierarchical conformation search methods with increasingly more accurate levels of scoring functions to optimize the speed of screening of amino acid analogs for aaRSs while retaining reliability in predicting the correct answer.
The first step in a docking protocol is to map the conformational space where the ligands can bind, followed by docking of ligands into these mapped regions.
Mapping of possible binding regions. A probe of 1.1 Å radius was used to trace a 4-dots/Å2 negative image of the protein molecular surface, using the Connolly method (Connolly 1983). The resulting data were used to generate clusters of overlapping spheres with the Sphgen program from the Dock 4.0 software suite (Ewing et al. 2001). These spheres map the void regions in the protein where the ligands can bind.
Definition of docking region. The strategy for defining the docking region depends on whether the binding site of the ligand in known from experiments or not. In either case, the spheres generated from the negative molecular surface in the previous step are enclosed into regions of 12 Å × 12 Å × 12 Å wide overlapping cubes (as shown in Fig. 1 ▶) that cover all the spheres generated from step 1 (the full protein). For apo-MetRS(FF) we scanned the entire molecular surface using 14 overlapping cubes to identify the binding site of methionine. For met/MetRS(FF), where the binding site is known we performed docking only in one cube of 12 × 12 × 12-Å3 volume centered around the binding site.
Subsequent to mapping the potential ligand binding regions, we performed calculations using the HierDock method. The three major steps in HierDock docking procedure used in this paper are as follows:
A coarse grain docking procedure was used to generate a large set of conformations within the 12-Å3 cube suitable for ligand binding. In this paper, we used Dock 4.0 (Ewing et al. 2001) to generate and score 20,000 configurations, of which 10% (2000) were selected based on using the scoring function used on Dock 4.0. This scoring function calculates the Coulombic and van der Waals interactions of the ligand with the protein. It has no contribution from solvation at this stage.
We then rescored these 2000 configurations using the DREIDING forcefield with SGB continuum solvation and selected the 20 best conformations for further optimization. Annealing molecular dynamics (MD) was used to allow the atoms of the ligand to readjust and optimize its interaction in the field of the protein-binding pocket. The binding pocket is defined as the residues within 5.0 Å of the ligand. In this step, the protein/ligand complex was heated and cooled from 50 K to 600 K in steps of 10 K (0.05 psec at each temperature) for 1 cycle. At the end of the annealing MD cycle, the best energy structure is retained for each of the 20 conformations.
For the 20 structures generated by annealing MD simulations for each ligand, the potential energy (conjugate gradients) of the full ligand/protein complex was minimized in aqueous solution using SGB. This step of protein/ligand-complex optimization is critical to obtaining energetically good conformations for the complex (cavity + ligand). The binding energy was calculated as the difference between the free energy of the ligand–protein complex in solvent [ΔG(protein + ligand)] and the sum of the free energies of the protein [ΔG(protein)] and the ligand separately in solvent [ΔG(ligand)]. The energies of the protein and the ligand in solvent were calculated after independent energy minimization of the protein and the ligand separately in water. Solvation energy contributions were calculated with full Poisson-Boltzmann continuum theory (Gilson and Honig 1988; Gilson et al. 1988) using the solvent-accessible surface. The nonbond interaction energies were calculated exactly using all pairwise interactions. Thus the free energy of binding is given by
 |
(1) |
Because the structure optimizations included solvation forces using the SGB continuum solvent approximation with the experimental dielectric constant, the calculated energies can be considered as free energies (Hendsch and Tidor 1999).
Scanning the entire apo-MetRS(FF) for predicting the binding site of methionine
The HierDock procedure was used to scan the entire apo-MetRS(FF) structure to locate the energetically favorable binding site of methionine. The steps involved in the scanning procedure are:
Mapping of possible binding regions. The void regions on the protein surface were mapped using sphgen as described above, and the spheres generated were partitioned into 14 12 Å × 12 Å × 12 Å wide overlapping cubes (as shown in Fig. 1 ▶).
Prediction of binding site. Steps 1 and 2 of the Hier-Dock procedure (described above) were performed with methionine as the ligand in all the 14 possible binding regions in the entire apo-MetRS(FF) structure. The orientations of the ligand in the receptor were generated by Dock 4.0, using flexible docking option, torsional minimization of the ligand, and a distance cutoff of 10 Å for the evaluation of energy.
Selection of the most probable binding site and best configurations. From each of the 14 regions, the conformations that passed a buried surface area cutoff were selected and sorted by binding energies (calculated using equation 1). The buried surface area cutoff is required for filtering good conformations at the coarse grain level. An average of the most buried and the least buried conformer was calculated, and all conformers with buried surface area below the average (66%) were eliminated from further analysis (Rocchia et al. 2002). The region with the strongest binding energy calculated using equation 1 was selected as the preferential binding region. The best energy conformation of methionine in optimized apo-MetRS(FF) structure is the predicted structure of methionine in apo-MetRS(FF). This predicted structure is denoted as met/apo-MetRS(HierDock).
Prediction of binding site for met/MetRS(FF) cocrystal structure
The receptor structure was prepared for docking, by removing the methionine and the crystallographic water molecules from the met/MetRS(FF) forcefield minimized structure. The protein surface was mapped with spheres, using the procedure described above, and the binding region was covered by a 12 Å × 12 Å × 12 Å box centered at the center of mass of methionine ligand. Steps 1 to 3 of HierDock procedure were performed using the same set of control parameters but only in the known binding region. Starting from the protein structure in met/MetRS(FF), the conformation predicted to have the best energy binding energy in this region is denoted as met/MetRS(HierDock) (please refer to Table 1).
Docking of ligands into the binding region and calculating relative binding energies
Steps 1 to 3 of the HierDock procedure were carried out for all ligands (the 20 natural amino acids plus the five methionine analogs) only in the methionine binding region, to predict their binding site and binding energies. The ligands were sorted by their binding energies to determine which ligands have the highest affinity for the binding site.
Docking of ligands into the binding site and calculating relative binding energies in met/MetRS(FF)
We performed steps 1 to 3 of the HierDock procedure for all 20 natural amino acids and the methionine analogs in the 12 Å × 12 Å × 12 Å binding region of the met/MetRS(FF) structure, and the binding energy for the best ligand conformation for each ligand was calculated using equation 1. The ligands were then sorted for determining the best binders.
Binding energy calculation of the 20 natural amino acids and five methionine analogs in the conformation that activates the protein
To activate metRS on ligand binding, we assumed that the orientation of the backbone of the 20 natural amino acids should be the same as that of methionine. This is because we know that the orientation of methionine in the binding site ensures the necessary contacts required for the enzyme activation. We refer to this conformation as the “activation mode.” The best binding energy conformation for each ligand determined by the HierDock procedure leads to slightly different preferred binding conformation for each ligand. However, these conformations may not lead to the activation of MetRS. Hence, to assess the relative binding energies of the 20 natural amino acids and the five methionine analogs in the activation mode, calculations for all the ligands were performed as follows:
The positions of the amino and carboxy terminii of each amino acid and each analog along with its Cα atom were positioned in the same location as that of methionine in the binding pocket. This ensures the conformation to be in the activation mode. Then an amino acid rotamer library (Hendsch and Tidor 1999) was used to generate all the possible side-chain conformations for each amino acid in the binding site, and a similar library was generated for the five methionine analogs.
-
The best rotamer was chosen by matching each rotamer k in the binding site and evaluating the interaction energy of the rotamer with the protein using the following equation from the Dreiding FF:
(2) where i and j sum over all atoms in the ligand and protein residue residues in the binding site; qi and qj are partial charges on atoms i and j, respectively; rij is the distance between atoms i and j; rm and De are the van der Waals distance and well depth of atoms i and j; rHB and DHB are the hydrogen-bond distance and well depth, respectively; and θ is the hydrogen-bond angle between atoms i and j and the bond to the bridging hydrogen atom. The hydrogen-bond term is evaluated only for hydrogen-bond donor and acceptor atoms. To avoid overpenalizing clashes, the van der Waals radii were reduced to 90% of the standard values in the Dreiding FF.
After the best rotamer was chosen for each ligand, the total energy of the ligand was minimized in the presence of protein, and the binding energy was then calculated using equation 1 for each of the 20 natural amino acids in the “activation mode” and compared.
Results and Discussion
Predicted binding site of methionine in met/MetRS(FF) structure
Using the procedure detailed above, methionine was docked in the binding region of the met/MetRS(FF) structure. Comparison of the best binding energy conformation of methionine in the met/MetRS(HierDock) structure to that of methionine in met/MetRS(FF) structure shows a CRMS of 0.55 Å (Fig. 3B ▶, see below) for all atoms. This is in excellent agreement with the crystal structure and validates the HierDock protocol for the MetRS case. The backbone of methionine makes electrostatic interactions with His 301 and Asp 52, the two amino acids that have been shown to play a significant role in methionine binding (Fourmy et al. 1991; Ghosh et al. 1991). The backbone carboxyl group of the methionine zwitterions is at a distance of 4.0 Å from the ɛ-nitrogen of His 301, and the amide group of methionine zwitterions is at 2.9 Å from Asp 52. The His 301 to alanine mutation results in the loss of affinity for methionine, and the Asp 52 to alanine mutation reduces the rate of the adenylation reaction by fourfold, indicating that it has a major role on the catalytic step in the formation of methionyl adenylate (Fourmy et al. 1991; Kim et al. 1993). We observe that the side chain of methionine makes two hydrogen-bond contacts. The Sδ of methionine makes two hydrogen bonds—one with the terminal oxygen of Tyr 260 and the other with the backbone amide of Leu 13 in the docked conformation in met/MetRS(HierDock). Thus, the predicted structure has all the hydrogen-bond contacts found in the crystal structure. The calculated binding energy of methionine in the met/MetRS(HierDock) structure is -38.1 kcal/mole. The major contribution to the binding energy comes from the electrostatic interactions of methionine backbone with Asp 52 and His 301 followed by its van der Waals interactions in this binding region.
Figure 3.
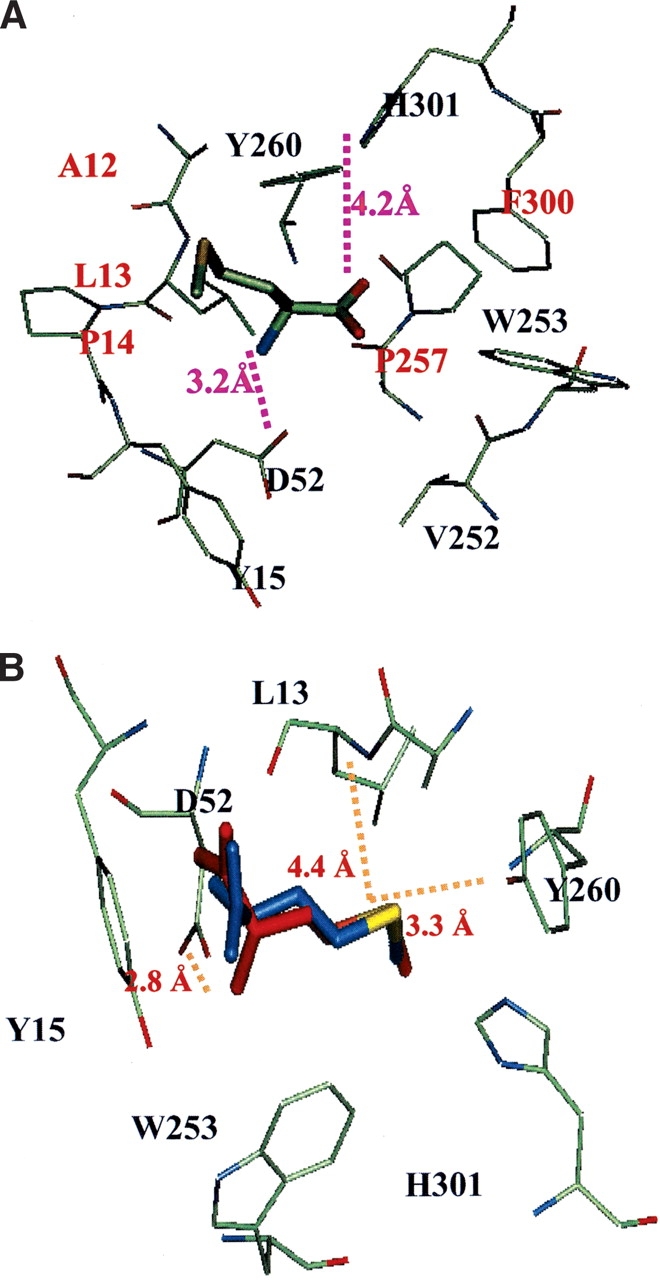

(A) The predicted binding site of methionine in apo-MetRS(FF). In the text this site is called the “recognition site.” The conserved residues within 4 Å of methionine are labeled in gold, and the conserved replacements are labeled in aqua. (B) Comparison of the predicted methionine binding site in the met/MetRS(HierDock) structure (red) to the methionine in the met/MetRS(FF) crystal minimized structure (blue). The Sδ of methionine makes two hydrogen bonds—one with the terminal oxygen of Tyr 260 and the other with the backbone amide of Leu 13 in the docked conformation in met/MetRS(FF). The CRMS between the two conformations is 0.55 Å. The zwittrion part of methionine in the cocrystal conformation makes a hydrogen bond only with Asp 52. (C) Comparison of the predicted binding site of methionine in apo-MetRS(HierDock) (blue) and met/MetRS(HierDock) (red). Amino acids lining the binding pocket are shown in purple for apo-MetRS(FF) and in green for met/MetRS(FF). Residues closest to methionine that undergo the largest conformation changes are labeled. Tyr 15 and Trp 253 move substantially to squeeze the blue side chain into the binding pocket shown in red.
Prediction of the binding site of methionine in apo-MetRS(FF)
Figure 2 ▶ shows the location of the predicted best binding region, apo-MetRS(FF) determined by scanning through 14 regions in apo-MetRS(FF) structure. The best bound conformation of methionine shows electrostatic interactions with His 301 and Asp 52 (see Fig. 3A ▶). The residues within 5 Å of the docked orientation, met/apo-MetRS(HierDock), are identical to those in the binding pocket of methionine in the met/MetRS(FF) minimized cocrystal structure (Fig. 3B ▶). However, the orientation of methionine and the residues lining the binding pocket including parts of the protein backbone are very different in the two structures. Although methionine bound to apo-MetRS makes electrostatic contact with the anchoring residue Asp 52, the side chain of methionine is not buried in the 7-Å pocket. Apo-MetRS(FF) structure does not have space for the methionine side chain within the pocket, and it undergoes significant conformation change on binding to methionine. Comparison of the met/MetRS(crystal) and apo-MetRS(crystal) structures shows that the large solvent-exposed cavity in apo-MetRS(crystal) reduces in volume as it gets partially filled with methionine and the residues lining the pocket (Y15, W253, F300, W229, F304, and Y251) move significantly from their apo-enzyme positions. For example, Tyr 15 moves ~3.4 Å, whereas Trp 253 moves the most, by 4.4 Å. These residues are significantly displaced from their apo-enzyme orientation as they reorient to form a hydrophobic pocket for me-thionine, as shown in Figure 3C ▶. In the predicted binding structure of methionine in the apo-enzyme, met/apo-MetRS(HierDock), all these residues are within 5 Å of the methionine ligand. This initial binding orientation of methionine is predicted to be the “recognition site,” which is plausible because methionine has the best binding energy of all 20 natural amino acids in this region. Thus, we speculate that methionine binds initially in the recognition site, followed by a conformational rearrangement of the binding site in apo-MetRS, leading to the final conformation observed in met/MetRS(FF). According to calculations, this change in conformation considerably increases the binding energy for methionine but reduces it for most other amino acids relative to methionine.
Figure 2.

Sphere-filled volume of apo-MetRS(FF) structure representing the possible binding sites in the enzyme. The search volume was divided into 14 regions as indicated by the cubic boxes. The predicted binding site is the region contained by the red colored box. The tRNA binding region has been omitted for the docking studies.
Thus, a binding-site search protocol (like HierDock) for unliganded protein structures in conjunction with sequence alignment analysis for the predicted binding region could provide more evidence on the accuracy of the predicted binding site and should help in recognizing key amino acids in the binding pocket. The sequence alignment using CLUSTALW among 59 prokaryotes indicates that all the amino acids within 4 Å of methionine in the predicted binding region are either strictly conserved or have conserved replacements. Of the 12 residues within 4 Å of methionine, seven (Y15, D52, V252, W253, A256, Y260, H301) are strictly conserved and five (A12, L13, P14, P257, F300) are conserved replacements (Fig. 3A ▶). Thus, of 21 positions in the entire alignment that are strictly conserved, we find a third of them in the predicted binding region. These results further validate the HierDock procedure for locating the correct binding region after scanning the entire protein surface. The HierDock procedure has been further tested and validated for predicting the binding site of phenylalanine in the Thermus thermophilus phenylalanyl-tRNA synthetase (P.M. Kekenes-Huskey, N. Vaidehi, and W.A. Goddard, unpubl.).
Specificity of met/apo-MetRS(HierDock) and met/MetRS(HierDock) structures for binding methionine versus the other 19 noncognate amino acids (Table 2)
Table 2.
Binding energies of the 20 natural amino acids in the apo and the cocrystal structures of MetRS calculated using HierDock and Activation mode calculations
| apo-MetRS(FF)–HierDock | met/MetRS(FF)–HierDock | met/MetRS(FF)–Activation mode | |
| Met | −26.38 | −38.10 | −68.70 |
| Cys | −25.74 | −7.98 | −18.84 |
| Glu | −24.84 | −4.09 | −32.11 |
| Ser | −22.24 | −31.12 | −16.51 |
| Asn | −22.04 | −21.29 | −12.43 |
| His | −21.84 | −14.4 | −27.66 |
| Thr | −21.54 | −16.06 | 77.27 |
| Gly | −19.86 | −25.95 | −20.74 |
| Ala | −17.44 | −20.29 | −17.79 |
| Val | −17.32 | −12.2 | −28.83 |
| Asp | −15.99 | −11.94 | −28.47 |
| Pro | −15.04 | −1.83 | −6.70 |
| Trp | −13.94 | 4.83 | −12.04 |
| Gln | −12.67 | −37.45 | −29.99 |
| Leu | −12.44 | −13.27 | −35.03 |
| Arg | −11.2 | 0.94 | 107.77 |
| Tyr | −6.54 | −26.29 | −9.60 |
| Ile | −6.36 | −10.65 | −27.36 |
| Phe | 6.45 | −10.36 | −15.42 |
| Lys | 28.83 | 4.65 | 110.13 |
The 20 natural amino acids were built and docked using the HierDock protocol in both the apo-MetRS(FF) and met/MetRS(FF) structures, as described above. The docking was done in the recognition site in the apo-MetRS(FF) structure, and in the binding site in the met/MetRS(FF) structure to recognize possible competitors to methionine binding. It is possible that a noncognate amino acid may bind in the binding pocket of methionine but may not make the critical interactions required for activation of the enzyme. In such a case, the ligand amino acid may not be able to react with ATP and form the adenylate complex. We also calculated the binding energies of the 20 natural amino acids in the “active conformation” (as detailed above) in the met/MetRS(HierDock) structure. These binding energies are also shown in Figure 4 ▶ as white bars. These calculations were done to analyze the binding energies of the noncognate amino acids if they were oriented in the active form as methionine.
Figure 4.

Binding energies of all 20 amino acids in the methionine binding site in met/MetRS(FF) and apo-MetRS(FF). Binding energies of the 20 amino acids docked in the predicted methionine binding site in apo-MetRS(FF) are shown in black bars and in the met/MetRS(FF) structure are shown in gray. Binding energies of 20 amino acids in the “activation mode” generated from perturbation analysis in the methionine binding site are shown as white bars.
The calculated binding energies of amino acids docked in the binding site of met/MetRS(FF) structure show that (Fig. 4 ▶, gray bars) methionine has the best binding energy -38.1 kcal/mole, with Gln the closest competitor at -37.45 kcal/mole, followed by Ser at -31.12 kcal/mole. In its preferred binding site in the met/MetRS(FF) structure, Gln has its amino and carboxyl terminii and the χ1 side-chain torsional angle in the same orientation as methionine, and yet its χ 2 and χ 3 side-chain torsional angles are significantly different from that of methionine. The Sδ of methionine makes two hydrogen bonds—one with the terminal oxygen of Tyr 260 and the other with the backbone amide of Leu 13. However, because of the difference in its binding mode, Gln is unable to make a hydrogen bond with Tyr 260 and makes only a weak hydrogen bond with the backbone amide of Leu 13 (O—H—N distance of 3.9 Å). It should be noted that we have not considered the large conformational changes that might occur on binding the noncognate amino acids. The binding site to which all the amino acids have been docked is biased toward binding methionine. However, this is not the case for the apo-MetRS(FF).
For apo-MetRS(FF), methionine has the best binding energy of -26.38 kcal/mole, with Leu, Glu, and Gln as close competitors (Fig. 4 ▶, black bars). Thus, our results show that the binding energy of methionine increases substantially when going from the apo-MetRS(FF) structure to the met/MetRS(FF) structure. The substantial conformational change in the binding site suggests that this structural change may be associated with a proofreading step in the selective recognition of methionine with respect to the other 19 noncognate amino acids. For most aaRSs, there is no absolute specificity for the cognate substrate in the sense of a “lock and key” model. For example, yeast isoleucyl-tRNA synthetase is not able to distinguish between Trp and Ile in the first step of binding because of the higher hydrophobic interactions gained by the noncognate substrate. However, as the initial binding process is completed, the enzyme is able to discriminate against the noncognate amino acids more easily (Freist et al. 1982, 1998).
The calculated binding energies of 20 amino acids in the active conformation using the met/MetRS(HierDock) structure, show that methionine has the best binding energy, and it has an energy difference of >20 kcal/mole with its close competitors among the natural amino acids. This indicates that although some of the noncognate amino acids may bind competitively to the “recognition site,” most of them would not induce the conformational change that fits only methionine, and, hence, none of them would activate MetRS except methionine.
Binding energies of methionine analogs to both the apo and cocrystal structures of MetRS
A stringent test for the HierDock protocol for applicability to perform virtual analog screening for MetRS, is to correlate the calculated binding energies to the in vitro measurements of the differential free energy of binding. Measurements of relative free energy of binding are performed by determining the kinetics of the ATP-PPi exchange assay (van Hest et al. 2000; Kiick et al. 2001). The experimental kinetics of pyrophosphate exchange are then analyzed to yield the differential free energy of binding via equation 3:
 |
(3) |
where a refers to the cognate amino acid and b refers to the amino acid analog. The quantity Δ ΔG is the difference in the free energies of binding of the analog (ΔGb) and the cognate amino acid (ΔGa), that is, Δ ΔG Δ ΔGb - ΔGa (Fersht 1999). Fersht has pointed out that use of the ratio of Michaelis constants to calculate relative binding energies neglects the contribution of binding to catalysis and recommends, instead, use of the ratio of specificity constants, (kcat/Km)a/(kcat/Km)b. We calculated the free energies of binding of five analogs of methionine (shown in Fig. 1 ▶), four of which are shown as “+” in Figure 1 ▶, that get efficiently incorporated into proteins in vivo. The calculated binding energies of methionine and its analogs are in the range of -79.1 to -63.4 kcal/mole in the cocrystal structure. In vitro measurements of the differential free energy of binding determined from the kinetics of ATP-PPi exchange assay are also available for these four analogs (Kiick et al. 2001). cis-Crotglycine (ccg), which is a cis-form of trans-crotglycine (tcg), has the lowest incorporation efficiency, and, hence, it was used as a negative control for the calculations. Binding energy calculations of the methionine analogs were carried out in the structure met/MetRS(Hier-Dock), placing the methionine analogs in the active mode as detailed above. Comparison of the calculated binding energies to the measured relative free energy of binding show a good correlation, with a correlation factor of 0.86.
The order of binding energies shows a big difference between the analogs that get incorporated in vivo and those that do not (Fig. 5A ▶). For example, the calculations correctly predict that trans-crotglycine binds better to MetRS than its isomer, cis-crotglycine. Thus, an amino acid analog predicted not to bind to the aaRS using the HierDock protocol, prior to synthesis, will not get incorporated either in vivo or in vitro. But, on the contrary, an analog predicted to bind well to the aaRS may or may not get incorporated depending on the role of subsequent steps in activation not examined in this study. cis-Crotglycine (ccg) has the worst predicted binding energy and gets incorporated with the lowest efficiency, whereas homopropargylglycine (hpg) has the best predicted binding free energy and is found experimentally to be the most efficient methionine analog (Kiick et al. 2001). The free energy of activation from kinetic measurements also shows that hpg has a relative free energy of binding close to methionine. Thus, for computational screening of analogs prior to synthesis, we could use the binding energy of cis-crotglycine (ccg) in met/MetRS(Hier-Dock) as a cutoff value for designing new analogs, testing experimentally only the ones ranking above the cutoff for binding and activation.
Figure 5.

Correlation between the calculated binding energies in kilocalories per mole, and the experimentally measured Δ ΔG, relative free energy of activation (also in kilocalories per mole) with respect to methionine.
Although the calculated relative binding free energies are in the same order as experimental energies, there is a large difference in the magnitude of the experimental relative free energies compared with the corresponding calculated values. There are three major factors responsible. First, the entropic effects are not included explicitly in the calculated free energies of binding. In addition, the binding energies are calculated for minimized structures at 0 K, whereas the experimental results are at room temperature. Molecular dynamics studies at 300 K would lead to substantially smaller binding energies because of thermal fluctuations, which forces the ligand to sample regions other than the best. Also, the energies obtained from the HierDock method refer only to the binding event and do not take into account changes in the activation energy of the catalytic step.
To understand what features of the cis-form of crotglycine (ccg) renders it to be unfavorable, we analyzed the bound conformations of cis- and trans-crotglycine (tcg). Defining the binding site as all residues within 5 Å of any atom of the ligand, we evaluated the energy contributions from each residue, which was further partitioned in terms of the components of the nonbond energy, namely, Coulombic interaction energy, van der Waals interaction energy, and hydrogen-bond energy. The results in Table 3 show that Asp 52, the main chain of Leu 13, and the side chain of Tyr 15 are the main contributors to Coulombic and hydrogen-bond interaction energies to both cis- and trans-crotglycine. We see that cis-crotglycine has less favorable van der Waals interaction with His 301, Ile 293, Pro 257, and Tyr 260 compared with trans-crotglycine. The total difference in van der Waals interaction from the residues in the binding site is 6.36 kcal/mole. The unfavorable van der Waals interaction of cis-crotglycine with His 301, Ala 12, and Tyr 260 is shown in Figure 6 ▶. The trans-crotglycine shown in pink in Figure 6 ▶ fills up the void space near Ala 256 and Pro 257 favorably compared with clashing with His 301 and Ala 12. Because Tyr 260 and His 301 have an important role in the binding process as indicated by experiments, mutating them to smaller residues may be deleterious. On the other hand, it would be interesting to explore the effect of Ala to Gly mutation at position 12 on the incorporation of cis forms of various analogs.
Table 3.
Non-bond interaction energy for cis and trans-crotglycine in met/MetRS(FF) structure
| CCG | TCG | |||||
| Residue | VDW | Coulomb | H-bond | VDW | Coulomb | H-bond |
| Asp 52 | 0.438 | −21.47 | — | 0.364 | −21.427 | −9.839 |
| Leu 13 | −1.255 | −6.045 | 10.246 | −1.762 | −6.142 | −10.19 |
| Tyr 15 | −2.173 | −7.773 | −9.898 | −3.282 | −6.162 | −0.122 |
| Trp 253 | −3.779 | −1.934 | −0.677 | −3.779 | −1.879 | 0.000 |
| Ile 297 | −2.097 | −0.454 | 0.000 | −0.967 | −1.585 | 0.000 |
| Pro 14 | −0.973 | −1.467 | 0.000 | −1.931 | −0.526 | 0.000 |
| His 301 | −0.102 | −1.189 | 0.000 | −1.216 | −1.074 | 0.000 |
| Pro 257 | −0.670 | −0.122 | 0.000 | −1.486 | −0.080 | 0.000 |
| Ile 293 | −0.273 | −0.145 | 0.000 | −1.110 | −0.232 | 0.000 |
| Tyr 260 | −0.227 | −0.116 | 0.000 | −1.780 | 0.706 | 0.000 |
| Ala 256 | −0.941 | 0.616 | 0.000 | −1.414 | 0.601 | 0.000 |
| Val 252 | −0.233 | −0.025 | 0.000 | −0.227 | −0.047 | 0.000 |
| Ala 12 | −0.084 | 0.673 | 0.000 | −0.144 | 0.081 | 0.000 |
The energy values are in kilocalorie-per mole.
Figure 6.

The binding sites of trans-crotglycine (tcg) and cis-crotglycine (ccg) in met/MetRS(FF), predicted in the “activation mode” as described in Materials and Methods. ccg (orange) has van der Waals clashes with Ala 12, His 301, and Tyr 260 and at the same time, the cis orientation of the terminal methyl group created a void near Ala 256 and Pro 257. tcg (pink), the trans form of the methyl group, fills the void near Ala 256 and Pro 257. tcg does not have unfavorable van der Waals interactions.
On comparing the binding energies calculated for the methionine analogs to those of the natural amino acids in the apo-MetRS(HierDock) structure, we see that the methionine analogs are interspersed with the noncognate natural amino acids This indicates that this conformation of apo-MetRS(FF) has an inefficient discrimination capability (Fig. 7A ▶), whereas met/MetRS(FF) has a excellent discrimination capability between the analogs and the noncognate amino acids (Fig. 7B ▶).
Figure 7.

Binding energies of methionine analogs along with the natural amino acids in the binding site of (A) apo-MetRS (FF) and in the binding site of (B) met/MetRS(FF). Energies of methionine and its analogs are shown in gray bars.
MetRS has been observed to be extremely promiscuous and is able to incorporate substrates that are up to 340,000-fold poorer in activation rates than methionine. This might be attributed to the conformational flexibility of the active site of MetRS that is not modeled in our present simulation. The ligand-induced conformational change in the active site of apo-MetRS could be different for different analogs. However, we have performed our studies on the cocrystal structure of met/MetRS(FF) bound to the natural substrate. The calculated binding energies of all the analogs are better than noncognate amino acids for met/MetRS(FF) structure. In addition, there is a good correlation with the experimental binding energies.
HierDock procedure can also be used to predict noncognate competitors among the natural amino acids that would be useful in (1) understanding the mistakes in protein biosynthesis and (2) predicting possible competitors among natural amino acids while redesigning aaRS to incorporate a desired amino acid analog (Datta et al. 2002; Zhang et al. 2002a).
Conclusions
We studied the specificity of MetRS for discriminating methionine from other noncognate amino acids. The results suggest a two-step process for the binding of methionine: an initial “recognition site” step in which the apo-MetRS protein conformation discriminates methionine from the other noncognate amino acids, followed by a significant conformational change in the binding site accompanying binding of methionine that significantly increases the specificity of MetRS binding to methionine. We speculate that as the methionine first anchors to residues Asp 52 and His 301, substrate binding (either the amino acid, ATP, or both) induces the conformation change in which the cavity opens up, allowing the methionine side chain to flip into the cavity. Such a multistep binding mechanism in which the ligand–protein complex displays “induced-fit” has been illustrated in other proteins. This has been attributed to the presence of energy gradients, or funnels, near the binding sites—the binding process initiates from a higher energy conformer and terminates in lower energy conformation (Zhang et al. 1999).
Using the protein conformation from the met/MetRS(FF) cocrystal structure, and starting with an arbitrary starting conformation for methionine, the predicted binding site and the bound conformation of methionine exhibits 0.55 Å CRMS from the corresponding crystal minimized structure, met/MetRS(FF).
Starting with the “free,” “unbound” state of the enzyme (apo-MetRS), it is difficult to determine the final bound conformation because the protein must restructure after binding. However, this is the typical problem one needs to solve prior to experiments. Calculations using apo-MetRS show that the HierDock method can be used to find the recognition region for binding the ligand, a key step in the multistep binding process, because even at this stage of binding MetRS shows a level of discrimination among the 20 natural amino acids. In a system for which the binding site is not known, such predictions could be used to indicate the important residues in the binding regions that can be tested using mutation studies. Therefore, for the systems in which there are no structures for substrates bound in cocrystals, HierDock may be useful in recognizing the binding region, even for cases in which the protein is flexible.
Considering the conformational flexibility in the MetRS, as indicated by the substantial structural change in the cocrystal, it is not surprising that it is one of the more permissive aminoacyl tRNA synthetases. But even for such a flexible enzyme system such as MetRS, the calculated binding energies of five methionine analogs agree well with the experimental binding energies, with a correlation factor of 0.86. This indicates that HierDock can be used as a computational screening method to predetermine which analogs will be taken up by aaRS. We were able to predict correctly that homopropargylglycine would get incorporated most efficiently, and cis-crotglycine would be the worst analog. Our procedure and scoring functions were also sensitive enough to discriminate between the two isomers of cis- and trans-crotoglycine.
Acknowledgments
We thank David Tirrell for his active involvement in this work and for stimulating discussions. We would also like to thank Kristi Kiick at the University of Delaware for her participation in scientific discussions. This research was supported by NIH/BioEngineering Research Group Grant GM62523. The computing facilities for this project were provided by an IBM Shared University Research grant. The facilities of the Materials and Process Simulation Center used in this project are supported also by the Department of Energy/Accelerated Strategic Computing Initiative/Academic Strategic Alliances Program, NSF grants (CHE9985574 and MRI99-77872), the NIH, the Army Research Office–Multidisciplinary University Research Initiative, Chevron Corp., the Defense Advanced Research Planning Agency, 3M, Seiko-Epson, Avery-Dennison Corp., Kellogg’s, General Motors, the Beckman Institute, Asahi Chemical, and the Office of Naval Research.
The publication costs of this article were defrayed in part by payment of page charges. This article must therefore be hereby marked “advertisement” in accordance with 18 USC section 1734 solely to indicate this fact.
Article and publication are at http://www.proteinscience.org/cgi/doi/10.1110/ps.04792204.
References
- Archontis, G., Simonson, T., and Karplus, M. 2001. Binding free energies and free energy components from molecular dynamics and Poisson-Boltzmann calculations. Application to amino acid recognition by aspartyl-tRNA synthetase. J. Mol. Biol. 306 307–327. [DOI] [PubMed] [Google Scholar]
- Boresch, S., Archontis, G., and Karplus, M. 1994. Free energy simulations: The meaning of the individual contributions from a component analysis. Proteins 20 25–33. [DOI] [PubMed] [Google Scholar]
- Budisa, N., Steipe, B., Demange, P., Eckerskorn, C., Kellermann, J., and Huber, R. 1995. High-level biosynthetic substitution of methionine in proteins by its analogs 2-aminohexanoic acid, selenomethionine, telluromethionine and ethionine in Escherichia coli. Eur. J. Biochem. 230 788–796. [DOI] [PubMed] [Google Scholar]
- Connolly, M.L. 1983. Solvent-accessible surfaces of proteins and nucleic acids. Science 221 709–713. [DOI] [PubMed] [Google Scholar]
- Datta, D., Wang, P., Carrico, I.S., Mayo, S.L., and Tirrell, D.A. 2002. A designed phenylalanyl-tRNA synthetase variant allows efficient in vivo incorporation of aryl ketone functionality into proteins. J. Am. Chem. Soc. 124 5652–5653. [DOI] [PubMed] [Google Scholar]
- Datta, D., Vaidehi, N., Floriano, W.B., Kim, K.S., Prasadarao, N.V., and God-dard III, W.A. 2003. Interaction of E. coli outer-membrane protein A with sugars on the receptors of the brain microvascular endothelial cells. Proteins 50 213–221. [DOI] [PubMed] [Google Scholar]
- Deming, T.J., Fournier, M.J., Mason, T.L., and Tirrell, D.A. 1994. In-vivo incorporation of proline analogs into artificial proteins. Abstr. Pap. Am Chem. S 208 365-Pmse. [Google Scholar]
- ———. 1996. Structural modification of a periodic polypeptide through bio-synthetic replacement of proline with azetidine-2-carboxylic acid. Macromolecules 29 1442–1444. [Google Scholar]
- ———. 1997. Biosynthetic incorporation and chemical modification of alkene functionality in genetically engineered polymers. J. Macromol. Sci. Pure A34 2143–2150. [Google Scholar]
- Ding, H.Q., Karasawa, N., and Goddard, W.A. 1992. Atomic level simulations on a million particles—the cell multipole method for coulomb and London nonbond interactions. J. Chem. Phys. 6 4309–4315. [Google Scholar]
- Dougherty, M.J., Kothakota, S., Mason, T.L., Tirrell, D.A., and Fournier, M.J. 1993. Synthesis of a genetically engineered repetitive polypeptide containing periodic selenomethionine residues. Macromolecules 26 1779–1781. [Google Scholar]
- Duewel, H., Daub, E., Robinson, V., and Honek, J.F. 1997. Incorporation of trifluoromethionine into a phage lysozyme: Implications and a new marker for use in protein F-19 NMR. Biochemistry 36 3404–3416. [DOI] [PubMed] [Google Scholar]
- Ewing, T.J., Makino, S., Skillman, A.G., and Kuntz, I.D. 2001. DOCK 4.0: Search strategies for automated molecular docking of flexible molecule databases. J. Comput. Aided Mol. Des. 15 411–428. [DOI] [PubMed] [Google Scholar]
- Fersht, A.R. 1999. Structure and mechanism in protein science. W.H. Freeman, New York.
- Fourmy, D., Mechulam, Y., Brunie, S., Blanquet, S., and Fayat, G. 1991. Identification of residues involved in the binding of methionine by Escherichia coli methionyl-tRNA synthetase. FEBS Lett. 292 259–263. [DOI] [PubMed] [Google Scholar]
- Freist, W. and Sternbach, H. 1988. Tyrosyl-tRNA synthetase from baker’s yeast. Order of substrate addition, discrimination of 20 amino acids in aminoacylation of tRNATyr-C-C-A and tRNATyr-C-C-A(3′NH2). Eur. J. Biochem. 177 425–433. [DOI] [PubMed] [Google Scholar]
- Freist, W., Sternbach, H., and Cramer, F. 1982. Isoleucyl-tRNA synthetase from Escherichia coli MRE 600. Different pathways of the aminoacylation reaction depending on presence of pyrophosphatase, order of substrate addition in the pyrophosphate exchange, and substrate specificity with regard to ATP analogs. Eur. J. Biochem. 128 315–329. [PubMed] [Google Scholar]
- ———. 1987. Isoleucyl-tRNA synthetase from baker’s yeast and from Escherichia coli MRE 600. Discrimination of 20 amino acids in aminoacylation of tRNA(Ile)-C-C-A(3′NH2). Eur. J. Biochem. 169 33–39. [DOI] [PubMed] [Google Scholar]
- ———. 1988. Isoleucyl-tRNA synthetase from baker’s yeast and from Escherichia coli MRE 600. Discrimination of 20 amino acids in aminoacylation of tRNA(Ile)-C-C-A. Eur. J. Biochem. 173 27–34. [DOI] [PubMed] [Google Scholar]
- Freist, W., Sternbach, H., Pardowitz, I., and Cramer, F. 1998. Accuracy of protein biosynthesis: Quasi-species nature of proteins and possibility of error catastrophes. J. Theor. Biol. 193 19–38. [DOI] [PubMed] [Google Scholar]
- Ghosh, G., Brunie, S., and Schulman, L.H. 1991. Transition state stabilization by a phylogenetically conserved tyrosine residue in methionyl-tRNA synthetase. J. Biol. Chem. 266 17136–17141. [PubMed] [Google Scholar]
- Ghosh, A., Rapp, C.S., and Friesner, R.A. 1998. Generalized born model based on a surface integral formulation. J. Phys. Chem. B 102 10983–10990. [Google Scholar]
- Gilson, M.K. and Honig, B. 1988. Calculation of the total electrostatic energy of a macromolecular system—Solvation energies, binding-energies, and conformational-analysis. Proteins 4 7–18. [DOI] [PubMed] [Google Scholar]
- Gilson, M.K., Sharp, K.A., and Honig, B.H. 1988. Calculating the electrostatic potential of molecules in solution—Method and error assessment. J. Comput. Chem. 9 327–335. [Google Scholar]
- Halperin, I., Ma, B.Y., Wolfson, H., and Nussinov, R. 2002. Principles of docking: An overview of search algorithms and a guide to scoring functions. Proteins 47 409–443. [DOI] [PubMed] [Google Scholar]
- Hendsch, Z.S. and Tidor, B. 1999. Electrostatic interactions in the GCN4 leucine zipper: Substantial contributions arise from intramolecular interactions enhanced on binding. Protein Sci. 8 1381–1392. [DOI] [PMC free article] [PubMed] [Google Scholar]
- Hughes, S.J., Tanner, J.A., Hindley, A.D., Miller, A.D., and Gould, I.R. 2003. Functional asymmetry in the lysyl-tRNA synthetase explored by molecular dynamics, free energy calculations and experiment. BMC Struct. Biol. 3 5. [DOI] [PMC free article] [PubMed] [Google Scholar]
- Ibba, M. and Soll, D. 2000. Aminoacyl-tRNA synthesis. Annu. Rev. Biochem. 69 617–650. [DOI] [PubMed] [Google Scholar]
- Kiick, K.L., van Hest, J.C., and Tirrell, D.A. 2000. Expanding the scope of protein biosynthesis by altering the methionyl-tRNA synthetase activity of a bacterial expression host. Angew. Chem. Int. Ed. Engl. 39 2148–2152. [PubMed] [Google Scholar]
- Kiick, K.L., Weberskirch, R., and Tirrell, D.A. 2001. Identification of an expanded set of translationally active methionine analogues in Escherichia coli. FEBS Lett. 502 25–30. [DOI] [PubMed] [Google Scholar]
- Kiick, K.L., Saxon, E., Tirrell, D.A., and Bertozzi, C.R. 2002. Incorporation of azides into recombinant proteins for chemoselective modification by the Staudinger ligation. Proc. Natl. Acad. Sci. 99 19–24. [DOI] [PMC free article] [PubMed] [Google Scholar]
- Kim, H.Y., Ghosh, G., Schulman, L.H., Brunie, S., and Jakubowski, H. 1993. The relationship between synthetic and editing functions of the active site of an aminoacyl-tRNA synthetase. Proc. Natl. Acad. Sci. 90 11553–11557. [DOI] [PMC free article] [PubMed] [Google Scholar]
- Kothakota, S., Mason, T.L., Tirrell, D.A., and Fournier, M.J. 1995. Biosynthesis of a periodic protein containing 3-thienylalanine—A step toward genetically-engineered conducting polymers. J. Am. Chem. Soc. 117 536–537. [Google Scholar]
- Liu, D.R., Magliery, T.J., Pastrnak, M., and Schultz, P.G. 1997. Engineering a tRNA and aminoacyl-tRNA synthetase for the site-specific incorporation of unnatural amino acids into proteins in vivo. Proc. Natl. Acad. Sci. 94 10092–10097. [DOI] [PMC free article] [PubMed] [Google Scholar]
- MacKerrell, A.D., Bashford, D., Bellott, M., Dunbrack, R.L., Evanseck, J.D., Field, M.J., Fischer, S., Gao, J., Guo, H., Ha, S., et al. 1998. All-atom empirical potential for molecular modeling and dynamics studies of proteins. J. Phys. Chem. B. 102 3586–3616. [DOI] [PubMed] [Google Scholar]
- Mayo, S.L., Olafson, B.D., and Goddard, W.A. 1990. Dreiding—A generic force-field for molecular simulations. J. Phys. Chem. 94 8897–8909. [Google Scholar]
- Mechulam, Y., Schmitt, E., Maveyraud, L., Zelwer, C., Nureki, O., Yokoyama, S., Konno, M., and Blanquet, S. 1999. Crystal structure of Escherichia coli methionyl-tRNA synthetase highlights species-specific features. J. Mol. Biol. 294 1287–1297. [DOI] [PubMed] [Google Scholar]
- Mendel, D., Ellman, J.A., Chang, Z., Veenstra, D.L., Kollman, P.A., and Schultz, P.G. 1992. Probing protein stability with unnatural amino acids. Science 256 1798–1802. [DOI] [PubMed] [Google Scholar]
- Rocchia, W., Sridharan, S., Nicholls, A., Alexov, E., Chiabrera, A., and Honig, B. 2002. Rapid grid-based construction of the molecular surface and the use of induced surface charge to calculate reaction field energies: Applications to the molecular systems and geometric objects. J. Comput. Chem. 23 128–137. [DOI] [PubMed] [Google Scholar]
- Serre, L., Verdon, G., Choinowski, T., Hervouet, N., Risler, J.L., and Zelwer, C. 2001. How methionyl-tRNA synthetase creates its amino acid recognition pocket upon L-methionine binding. J. Mol. Biol. 306 863–876. [DOI] [PubMed] [Google Scholar]
- Tannor, D.J., Marten, B., Murphy, R., Friesner, R.A., Sitkoff, D., Nicholls, A., Ringnalda, M., Goddard, W.A., and Honig, B. 1994. Accurate first principles calculation of molecular charge-distributions and solvation energies from abinitio quantum-mechanics and continuum dielectric theory. J. Am. Chem. Soc. 116 11875–11882. [Google Scholar]
- Vaidehi, N., Floriano, W.B., Trabanino, R., Hall, S.E., Freddolino, P., Choi, E.J., Zamanakos, G., and Goddard III, W.A. 2002. Prediction of structure and function of G protein-coupled receptors. Proc. Natl. Acad. Sci. 99 12622–12627. [DOI] [PMC free article] [PubMed] [Google Scholar]
- van Hest, J.C. and Tirrell, D.A. 2001. Protein-based materials, toward a new level of structural control. Chem. Commun. (Camb.) 19 1897–1904. [DOI] [PubMed] [Google Scholar]
- van Hest, J.C.M., Kiick, K.L., and Tirrell, D.A. 2000. Efficient incorporation of unsaturated methionine analogues into proteins in vivo. J. Am. Chem. Soc. 122 1282–1288. [Google Scholar]
- Wang, P., Vaidehi, N., Tirrell, D.A., and Goddard III, W.A. 2002. Virtual screening for binding of phenylalanine analogues to phenylalanyl-tRNA synthetase. J. Am. Chem. Soc. 124 14442–14449. [DOI] [PubMed] [Google Scholar]
- Zhang, C., Chen, J., and DeLisi, C. 1999. Protein–protein recognition: Exploring the energy funnels near the binding sites. Proteins 34 255–267. [PubMed] [Google Scholar]
- Zhang, D., Vaidehi, N., Goddard III, W.A., Danzer, J.F., and Debe, D. 2002a. Structure-based design of mutant Methanococcus jannaschii tyrosyl-tRNA synthetase for incorporation of O-methyl-L-tyrosine. Proc. Natl. Acad. Sci. 99 6579–6584. [DOI] [PMC free article] [PubMed] [Google Scholar]
- Zhang, Z., Wang, L., Brock, A., and Schultz, P.G. 2002b. The selective incorporation of alkenes into proteins in Escherichia coli. Angew. Chem. Int. Ed. Engl. 41 2840–2842. [DOI] [PubMed] [Google Scholar]