

Abstract
Glutamate synthase (GltS) is a complex iron–sulfur flavoprotein that catalyzes the reductive transfer of L-glutamine amide group to the C2 carbon of 2-oxoglutarate yielding two molecules of L-glutamate. Molecular dynamics calculations in explicit solvent were carried out to gain insight into the conformational flexibility of GltS and into the role played by the enzyme substrates in regulating the catalytic cycle. We have modelled the free (unliganded) form of Azospirillum brasilense GltS α subunit and the structure of the reduced enzyme in complex with the L-glutamine and 2-oxoglutarate substrates starting from the crystallographically determined coordinates of the GltS α subunit in complex with L-methionine sulphone and 2-oxoglutarate. The present 4-ns molecular dynamics calculations reveal that the GltS glutaminase site may exist in a catalytically inactive conformation unable to bind glutamine, and in a catalytically competent conformation, which is stabilized by the glutamine substrate. Substrates binding also induce (1) closure of the loop formed by residues 263–271 with partial shielding of the glutaminase site from solvent, and (2) widening of the ammonia tunnel entrance at the glutaminase end to allow for ammonia diffusion toward the synthase site. The Q-loop of glutamate synthase, which acts as an active site lid in other amidotransferases, seems to maintain an open conformation. Finally, binding of L-methionine sulfone, a glutamine analog that mimics the tetrahedral transient species occurring during its hydrolysis, causes a coordinated rigid-body motion of segments of the glutaminase domain that results in the inactive conformation observed in the crystal structure of GltS α subunit.
Keywords: glutamate synthase, molecular dynamics, amidotransferase, ammonia channeling, flavoprotein, iron–sulfur clusters
Glutamate synthases (GltS) are complex iron–sulfur flavoproteins that catalyze the reductive transfer of L-glutamine amide group to the C2 carbon of 2-oxoglutarate (2-OG), yielding two molecules of L-glutamate (Figs. 1 ▶, 2 ▶).
Figure 1.

Scheme of α-GltS partial reactions.
Figure 2.

Proposed mechanism of the glutaminase segment of GltS reaction.
GltS are found in bacteria, yeast and plants where they form with glutamine synthetase an essential pathway for ammonia assimilation (for recent reviews, see Vanoni and Curti 1999; van den Heuvel et al. 2004; Vanoni et al. 2004).
Azospirillum brasilense GltS is the prototype of the bacterial NADPH-dependent enzyme form (NADPH-GltS). The stable and catalytically active αβ protomer (α subunit, 164.2 kDa; β subunit, 52.3 kDa), contains one FAD (on the β subunit) and one FMN (on the α subunit) cofactors and three different iron–sulfur centers (one [3Fe-4S]0,1+ center and two low potential [4Fe-4S]1+,2+ clusters). The β subunit contains the site where NADPH binds and is oxidized with reduction of FAD (Vanoni et al. 1996). The α subunit harbors the GltS glutaminase site for glutamine binding and hydrolysis to yield the first molecule of the L-glutamate product and ammonia (Figs. 1 ▶, 2 ▶). At the synthase site on the α subunit, 2-iminoglutarate (2-IG) resulting from ammonia addition to 2-OG, is reduced by FMN to yield the second molecule of L-glutamate (Fig. 1 ▶). Electron transfer from FAD, at the NADPH oxidizing site, to FMN, at the synthase site, occurs with the involvement of at least two of the three iron–sulfur clusters of the enzyme: the [3Fe-4S]0,+1 center (on the α subunit) and one of the [4Fe-4S] +1,+2clusters, presumably within the β subunit.
The ferredoxin-dependent GltS form (Fd-GltS) of cyano-bacteria and plants is similar in size, cofactor content, and catalytic activity to the NADPH-GltS α subunit (α-GltS) (Vanoni et al. 1998; Ravasio et al. 2002; van den Heuvel et al. 2004). The NADH-dependent GltS form (NADH-GltS), is found in nonphotosynthetic eukaryotic cells and it is poorly characterized biochemically. However, it appears to derive from the fusion of bacterial α and β subunits to yield a single long polypeptide chain of approximately 200,000.
A key feature of NADPH- and Fd-GltS is the tight control exerted by the enzyme over its partial catalytic activities. At variance with other amidotransferases, in GltS holoenzymes hydrolysis of L-Gln is always tightly coupled to ammonia addition to 2-OG and reduction of the 2-IG intermediate to yield L-glutamate (Vanoni et al. 1991, 1998). Such control is lost in the isolated α subunit of NADPH-GltS suggesting that association of the α and β subunits in the holoenzyme induces a conformational change within the α subunit, which is needed to couple the catalytic activities of the enzyme subunit (Vanoni et al. 1998). That both the redox state of cofactors and protein–protein interaction are important in establishing the observed coupling is also supported by the finding that binding of reduced ferredoxin to reduced Fd-GltS is essential in order to activate the physiological L-glutamine-dependent glutamate synthase activity of the enzyme (Ravasio et al. 2002). The three-dimensional structure of the NADPH-GltS αβ protomer has not been determined yet, nor that of the enzyme β subunit. However, the structure of the NADPH-GltS α subunit in complex with the L-glutamine analog L-methionine sulfone (MetS) and with the 2-OG substrate (Binda et al. 2000), and those of Synechocystis Fd-GltS in the free state or in complex with substrates and their analogs (van den Heuvel et al. 2002, 2003) have been solved.
α-GltS and Fd-GltS are similar to each other. They are formed by four domains of roughly similar sizes (Fig. 3 ▶). The N-terminal PurF (Type II or Ntn-type) (Zalkin and Smith 1998) L-glutamine amidotransferase domain (residues 1–422 for α-GltS) harbors the enzyme glutaminase site. It is connected to the FMN binding domain (residues 780–1203), which contains the synthase site and both the FMN cofactor and the [3Fe-4S] cluster of GltS, by the so-called central domain (residues 423–779). The FMN domain is followed by a C-terminal β-helical domain (residues 1204–1472) whose function in catalysis is unlikely. In both α-GltS and Fd-GltS the glutaminase and the synthase sites are connected by an approximately 30 Å-long intramolecular tunnel for ammonia transfer between the catalytic sub-sites (Fig. 3 ▶).
Figure 3.

Crystallographically-determined structure of NADPH-GltS α subunit. (A) Ribbon representation of α-GltS crystal structure in complex with MetS and 2-OG (PDB code 1EA0). Color code: amidotransferase domain, blue; FMN-binding domain, green; central domain, red; β-helix domain, magenta. The FMN cofactor and the two substrates L-Gln and 2-OG are displayed as sticks. The [3Fe-4S] cluster is shown as ball-and-sticks. The tunnel connecting the glutaminase and synthase sites is highlighted by yellow spheres. (B) Detail of the glutaminase active site showing the reciprocal orientation of Cys 1, Arg 31, Glu 978, and MetS inhibitor. (C) Detail of the synthase active site with Met 479 interacting with the [3Fe-4S] cluster and the isoalloxazine ring of FMN, and bound 2-OG. All figures were made with RASMOL v2.7.7 (Sayle and Milner-White 1995; Bernstein 2000).
The three-dimensional structures of GltS also revealed the presence of protein segments most likely involved in coupling the catalytic activities of the synthase and glutaminase sites. Loop 470–520 of the central domain, and loops 933–978 (loop 4) and 1025–1047 (loop 6) of the FMN domain contact the redox centers and 2-OG in the synthase domain, run along the tunnel forming most of its wall, and interact with residues important for glutamine binding and hydrolysis (Binda et al. 2000). These polypeptide stretches may sense the state of occupancy of the catalytic sub-sites and the redox state of the enzyme cofactors. Thus, by undergoing limited, but significant, conformational changes they may promote glutamine binding and hydrolysis at the glutaminase site and ammonia transfer to the synthase site where the remaining steps of the reaction must take place.
Although ammonia tunnels are found in all amidotransferases whose structures are known, they appear to be a case of convergent evolution in that they are formed by the unrelated synthase domains of the enzymes rather than, as one might expect, by the conserved amidotransferase domains (Raushel et al. 2003; van den Heuvel et al. 2004). How these tunnels are gated in order to allow ammonia transfer from the glutaminase to the synthase sites is still unknown.
In the crystallographically determined structures of GltS, the tunnel is separated in two contiguous cavities by residues 507–508 and 976–977 (numbering for α-GltS), which obstruct the tunnel by interacting with each other through main chain atoms. Thus, a first question on GltS mode of action deals with the removal of such tunnel obstruction during catalysis. In particular, it is of interest to determine whether protein breathing is sufficient to widen the tunnel entrance sufficiently for ammonia to diffuse through the tunnel, or if a specific event (e.g., binding of L-Gln and/or 2-OG and/or cofactors reduction at the synthase site) is required to trigger channel opening. It has been calculated that a 2 Å–3 Å widening of the obstruction would be required to allow ammonia to enter the main part of the tunnel (Binda et al. 2000).
A second question concerns the conformation of loop 210–225 of the glutaminase domain. In all GltS structures such loop is in a conformation that makes the site of glutamine binding and hydrolysis solvent-accessible. On the contrary, in the catalytically active conformations of other well-characterized amidotransferases (Isupov et al. 1996; Krahn et al. 1997; Massiére and Badet-Denisot 1998; Larsen et al. 1999; Teplyakov et al. 2001) the corresponding active site loop (commonly referred to as the glutamine loop or the Q-loop) is closed onto the active center and shields it from solvent. Based on evidence gathered on other amidotransferases and on the observation that in NADPH-GltS ammonia derived from L-glutamine hydrolysis is never released into the solvent nor that it exchanges with ammonia from the medium (Vanoni et al. 1991), it has been postulated that also in GltS the Q-loop must undergo changes during catalysis from an open to a closed conformation (Binda et al. 2000) to allow for glutamine binding and L-glutamate release. As a result of loop closure, ammonia release from L-Gln would be activated, released ammonia would be prevented from equilibrating with solvent and its transfer to the synthase site, through the tunnel, would be promoted.
Finally, comparison of the three-dimensional structures of α-GltS in complex with MetS and 2-OG (Binda et al. 2000) with those of Fd-GltS (van den Heuvel et al. 2002, 2003) showed that in α-GltS the glutaminase site is in an inactive conformation. MetS is a GltS inhibitor, competitive with L-Gln, that mimicks the transient tetrahedral species leading to its formation or hydrolysis (Fig. 2 ▶). Binding of MetS seems to have caused a shift in the position of Cys 1 to yield the observed unproductive conformation. Such Cys 1 movement also causes α-helix 15–28 and loop 29–34 to rearrange. On the contrary, the geometry of the corresponding protein regions of Fd-GltS in the free state or of the adduct obtained upon reaction with 6-diazo-5-oxo-L-nor-leucine reflect those of the catalytically competent conformations of other Ntnamidotransferases (van den Heuvel et al. 2003, 2004). Thus, Fd-GltS glutaminase site is in a state capable to bind and hydrolyze L-Gln, although the Q-loop is in an open conformation.
A molecular dynamics (MD) approach has been now applied to gain information on the intrinsic conformational flexibility of GltS α subunit (α-GltS) and on conformational changes triggered by substrates binding and cofactor(s) reduction, which may lead to (1) ammonia tunnel opening, (2) Q-loop opening/closure, and (3) switches of the glutaminase site from the inactive conformation (observed in the α-GltS-MetS complex) to the active conformation (of all Fd-GltS forms).
We report here two 4-ns MD simulations in explicit solvent of α-GltS in the substrate-free oxidized state (α-GltSfree) and of α-GltS in complex with its substrates, L-Gln and 2-OG, with the FMN cofactor in the reduced state (α -GltSbound). The two states were chosen in order to simulate the free enzyme (α-GltSfree) and the Michaelis complex (α-GltSbound). In the latter case not only L-Gln and 2-OG must be bound to the enzyme, but also at least FMN must be reduced to the hydroquinone state (Fig. 1 ▶). The results showed that: (1) Removal of MetS from the glutaminase site causes a narrowing of the active site, which becomes unable to bind the L-glutamine substrate; (2) replacement of MetS with L-Gln induces a cooperative domain closure motion within the glutaminase domain that leads to a geometry similar to that observed for Fd-GltS and all other amidotransferases in their catalytically competent conformation; (3) the Q-loop maintains the open conformation, but in α-GltSbound the glutaminase site becomes partially shielded from solvent by loop 263–271; (4) the presence of bound substrates is sufficient to cause removal of the ammonia tunnel obstruction brought about by residues 507–508 and 976–977. As a result the tunnel opening reaches a radius of about 4 Å, sufficient to allow for ammonia diffusion toward the synthase site. Finally, the present MD calculations demonstrate that this approach can be effectively applied to a protein system as large as α-GltS (14,439 atoms) and that it can complement structural and biochemical studies.
Results
Overall structure
Two 4-ns simulations were performed on ligand-free oxidized and ligand-bound reduced α-GltS, starting from the crystallographic coordinates of chain A of NADPH-GltS α subunit, which had been modified in order to (1) include regions 305–307, 1172–1179 and 1194–1202, whose disorder prevented their detection by X-ray crystallography, for both α-GltSfree and α-GltSbound; (2) remove MetS and 2-OG from the crystallographic structure to obtain the α-GltSfree model; and (3) substitute L-Gln for MetS and the FMN hydroquinone form for the oxidized species to obtain the α-GltSbound starting model (Table 1). In order to ensure that the simulations did not contain any obvious artifacts, standard analyses were performed. Throughout the trajectory, the structures of α-GltSfree and α-GltSbound remain similar to each other and to the crystallographically determined structure of α-GltS in complex with MetS and 2-OG (Table 2). Figure 4 ▶ shows the root-mean-square deviation (RMSD) of Cαatoms of the average α-GltSfree (Fig. 4A ▶) and α-GltSbound (Fig. 4B ▶) structures from their crystal position, as a function of residue number. In both simulations residues with the largest RMSD occur in loops in peripheral regions of the protein models, exposed to solvent. Such residues belong to regions 156–170 (α-GltSfree simulation), 893–906 and 1100–1300 (both simulations).
Table 1.
Summary of system composition
| α-GltSfree | α-GltSbound | |||
| Molecules | Atoms | Molecules | Atoms | |
| Protein | 1 | 14,372 | 1 | 14,372 |
| FMN | 1 | 35 | 1 | 37 |
| [3Fe-4S] | 1 | 7 | 1 | 7 |
| L-Gln | 1 | 15 | ||
| 2-OG | 1 | 10 | ||
| Water | 35,206 | 105,618 | 43,857 | 131,571 |
| Counterions | 14 | 14 | 16 | 16 |
| Total | 120,046 | 146,028 | ||
Table 2.
Summary of MD simulations
| Percentd | |||||||
| System | Radius of gyrationa | Cα RMSDb | Cα RMSFc | Helices | Strand | Loop | Coil |
| α-GltSfree | 3.17 ± 0.01 | 0.31 ± 0.03 | 0.11 ± 0.05 | 33.0 | 17.4 | 25.6 | 24.0 |
| α-GltSbound | 3.22 ± 0.01 | 0.29 ± 0.05 | 0.12 ± 0.07 | 34.1 | 17.9 | 24.1 | 23.8 |
| α-GluScrystal | 3.24 | 36.3 | 17.2 | 23.7 | 22.8 | ||
a Average radius of gyration of nonhydrogen atoms (nm).
b RMSD of Cα atoms from their crystal positions (nm).
c RMSF of Cα atoms (nm).
d Percent of secondary structure elements.
Figure 4.

Root-mean-square deviations (RMSD) and fluctuations (RMSF) of Cα atoms during α-GltSfree and α-GltSbound simulations. RMSD of Cα with respect to the corresponding Cα atoms of the crystallographically determined structure of α-GltS in complex with MetS and 2-OG for α-GltSfree (A) and α-GltSbound. (B) RMSF of Cα about their mean position during the simulation of α-GltSfree (C) and α-GltSbound (D). Color scheme as in Figure 1 ▶.
Figure 4 ▶ also shows the root-mean-square fluctuation (RMSF) of Cα as a function of residue number for α-GltSfree (Fig. 4C ▶) and α-GltSbound (Fig. 4D ▶) simulations. For both simulations the RMSF data indicate large fluctuations of segments belonging to loops that connect secondary structure elements. Again, such loops belong to surface regions, and correspond to the protein regions that show large RMSD. Major differences between the trajectories calculated with α-GltSfree and α-GltSbound were observed for segments 267–317, 894–902 and, in particular, 1112–1128 and 1168–1300 (Fig. 4C, D ▶). The latter fragment includes residues that were disordered in the crystal structure and were added to the initial α-GltS models. Overall, the FMN-binding domain exhibits the largest deviations and fluctuations and the C-terminal β-helix deviates the least for both α-GltSfree and α-GltSbound.
Essential dynamics
The analysis of the eigenvalues obtained from the essential dynamics (ED) (Amadei et al. 1993) of both trajectories shows that at least 80% of the overall motion is confined to the first 16 and 9 eigenvectors (over 10,812) for the free and the bound enzyme simulations, respectively. However, amplitudes of the fluctuations along the eigenvectors (eigenvalues) are slightly larger for the bound with respect to the free enzyme. The effect of ligands on the redistribution and confinement of the backbone fluctuations has been observed for other protein systems of smaller size (Aschi et al. 2002). However, it is surprising to find that also for such a large system, small size ligands can strongly affect the main collective motions.
The projections of both trajectories along the corresponding first 10 eigenvectors (data not shown), evidence the typical cosine-shaped trend due to the random diffusive regime of the motion along these eigenvectors (Hess 2000). This effect indicates, as expected for the size of the system and the length of the simulation, not fully equilibrated systems (Hess 2000). Much longer (and exceedingly computationally demanding) simulations would be necessary to obtain equilibrium conditions. Nevertheless, these nonequilibrium eigenvectors provide information on the earliest effects induced by the presence of the substrates on the structural and dynamical behavior of the enzyme.
The comparison, using the root-mean-square inner product (RMSIP) overlap criteria (Amadei et al. 1999), of the essential subspace described by the first 3 and 10 eigenvectors, provides values of 0.04 and 0.32, respectively, indicating a very low similarity on the essential motion directions (Amadei et al. 1999) of the two simulations.
DynDom analysis
Table 3 summarizes the results of DynDom analysis of the most relevant rigid body motions along the first three eigenvectors for α-GltSfree and α-GltSbound. Indeed, the first three eigenvectors of both simulations contain more than 60% of the overall fluctuations. The free enzyme shows a reduced number of dynamical domains with respect to the bound one. In α-GltSfree the main motions are localized in the FMN and central domains. On the contrary, in α-GltSbound the main motions are localized in the amidotransferase domain. In particular, three rigid-body motions for fragments 6–31 and 77–99 are present along the first three eigenvectors, which will be described in detail in the next section.
Table 3.
Relevant rigid body motions along the first three eigenvectors of α-GltSfreeand α-GltSboundsimulations
| Eigenvectors | ||||||
| Enzyme model | 1 | 1 | 1 | 3 | 3 | 2 |
| α-GltSfree | ||||||
| Domain A | 507–514, 975–986 | 507–514, 975–986 | 576–597 | 504–507, 976–991 | 830–893, 915–944 | 749–772 |
| Domain B | 823–857 | 1006–1027 | 786–821 | 751–770 | 751–770 | 837–857 |
| Connecting regions | 856–875 | 986–1006 | 593–786 | 507–751 | 767–830 | 769–837 |
| Angle of rotation | 12.6 | 11.1 | 21.2 | 16.0 | 17.5 | 23.3 |
| Angle ||a | 56.9 | 74.1 | 87.0 | 82.6 | 80.0 | 58.3 |
| Percent closure motion | 70.2 | 92.5 | 99.7 | 98.4 | 97.0 | 72.4 |
| Eigenvectors | |||||||||
| 1 | 2 | 2 | 3 | 3 | 1 | 1 | 2 | 3 | |
| a Angle between the effective hinge axis and the line connecting the two centers of mass of the two domains. Angles are in degree. | |||||||||
| α-GltSbound | |||||||||
| Domain A | 73–93 | 73–93 | 73–93 | 235–250, 714–722 | 77–99 | 300–320 | 300–320 | 434–504 | 396–422 |
| Domain B | 7–32 | 12–31 | 402–423 | 77–99 | 6–28 | 278–290 | 439–473 | 402–423 | 423–442 |
| Connecting regions | 32–74 | 29–73 | 92–402 | 99–235 | 28–78 | 298–300 | 320–441 | 421–434 | 422–423 |
| Angle of rotation | 12.3 | 7.7 | 21.4 | 10.5 | 10.6 | 33.7 | 38.0 | 26.2 | 12.2 |
| Angle ||a | 87.7 | 88.5 | 63.5 | 81.9 | 66.9 | 65.1 | 51.6 | 55.4 | 47.1 |
| Percent closure motion | 99.8 | 99.9 | 80.2 | 98.0 | 84.6 | 82.3 | 61.5 | 67.8 | 53.7 |
Comparison of α-GltSfree and α-GltSbound simulations with GltS crystal structures
Amidotransferase domain
In α-GltS and Fd-GltS crystallographic structures the movements of Cys 1, residues 15–28 and loop 29–34 appear to be correlated and to be responsible for the switch from the inactive conformation of the glutaminase domain observed in the α-GltS-MetS complex to the active conformation of Fd-GltS structures (van den Heuvel et al. 2004, and references therein; Fig. 3 ▶).
In our MD calculations, removing the MetS ligand from the α-GltS crystal structure causes a quick narrowing of the substrate binding pocket (Figs. 5A ▶, 6A ▶). As a result the glutaminase site adopts a conformation not suited to harbor the L-glutamine substrate. Cys 1 side chain rotates away from the binding cavity toward loop 29–34, bringing Sγ at hydrogen bond distance from the main chain oxygen atom of Arg 31 (average value of last 2 ns: 0.31 nm). In this process Cys 1 N-terminal N atom remains within hydrogen bond distance from the main chain carbonyl oxygen atom of Arg 31 (average value of last 2 ns: 0.31 nm) (Fig. 5A ▶).
Figure 5.

Details of the glutaminase site during α-GltSfree and α-GltSbound simulations. Snapshots from MD simulations highlighting the reorientation of Cys 1 in the glutaminase site in α-GltSfree (A) and α-GltSbound (B). In B, the water molecule (W) approaching Cys 1 and forming hydrogen bonds with Cys 1 α-amino N and Sγ side chain is shown as spacefill. Cys 1, Arg 31, Glu 978, and the L-Gln substrate are depicted in stick representation. (C) Plot of the distance between Cys 1 Sγ and L-Gln Cδ atom as a function of simulation time for α-GltSbound.
Figure 6.

Comparison of ammonia channel and water distribution in α-GltS-MetS (C) and -GltSfree (A) and α-GltSbound (B) simulations with α Fd-Glts-ONL (D) crystal structures. The surface of ammonia channels leading from the glutamine binding site (top) to the synthase site (bottom) was generated by SURFNET (Laskowski 1995) and is indicated by dots. Water molecules filling the tunnels are in spacefill representation. The FMN cofactor, the [3Fe-4S] cluster, MetS, L-Gln, ONL, and 2-OG are displayed as sticks. (A,B) Representative frame structures from the last 2 ns of the trajectory of α-GltSfree and α-GltSbound, respectively. (C,D) Crystal structures of α-GltS-MetS and Fd-GltS-ONL complexes, respectively.
In the α-GltSbound simulation, the L-Gln molecule is involved in electrostatic interactions with residues of the substrate binding cavity similar to those observed in the crystal structures of α-GltS in complex with MetS and of the Fd-GltS-ONL adduct (Binda et al. 2000; van den Heuvel 2002, 2003). In particular, L-Gln is held in position through hydrogen bonds with Arg 210 side chain (O1,O2 of L-Gln and Nɛ of Arg 210), Asn 231 side chain (Oɛ of L-Gln and Nδ of Asn 231) and Gly 232 main chain (α-amino group N of L-Gln and O of Gly 232; L-Gln Nɛ and N of Gly 232). Overall, the oxyanion hole formed by Asn 231 side chain and Gly 232 backbone is maintained in this protein form. L-Gln is also kept in place by hydrogen-bonding interactions with Ser 272 (average value was 0.27 nm for the distance between L-Gln O2 and the Oγ atom of Ser during the last 2 ns of the simulation) and Ser 274 (average value of the distance between L-Gln α-amino N and Ser 274 Oγ: 0.34 nm calculated during the last 2 ns of the simulation).
Furthermore, in α-GltSbound simulation Cys 1 reorients in the glutaminase site (Fig. 5B,C ▶). In this case, the average structure calculated from the last 2 ns of the trajectory shows that Cys 1 free amino group is in hydrogen bond distance from Arg 31 main-chain carbonyl oxygen and Glu 978 side-chain carboxylate. Interestingly, Sγ approaches L-Gln Cδ reaching a position suitable for the nucleophilic attack that should initiate glutaminase reaction (Figs. 1 ▶, 2 ▶). Overall, the geometry of the glutaminase site in α-GltSbound simulation leads to a conformation similar to the catalytically active conformation found in free Fd-GltS and in the adduct with ONL (van den Heuvel et al. 2003).
DynDom analysis (Table 3) clearly revealed for α-GltSbound simulation that the conformational change of the glutaminase site from the (starting) inactive to the (final) active conformation takes place through three sets of rigid-body motions involving two protein segments (residues 6–32 and 73–99) (Fig. 7 ▶). The first rigid-body movement involves a rotation of protein regions 7–32 and 73–93 around a hinge axis, located near residues 45–47 (Fig. 7A ▶). The second rigid-body movement involves a rotation of protein regions 12–31 and 73–93 around a hinge axis near residues 46–49 (Fig. 7B ▶). The third rigid-body movement involves a rotation of protein regions 6–28 and 77–99 around a hinge axis near residues 72–75 (Fig. 7C ▶). All the three hinge axes were identified as closure axes by DynDom analysis (Hayward and Berendsen 1998). Such rigid-body movements of one domain relative to the other are responsible for the reorientation of Cys 1 in the glutaminase site described above (Fig. 5B,C ▶).
Figure 7.
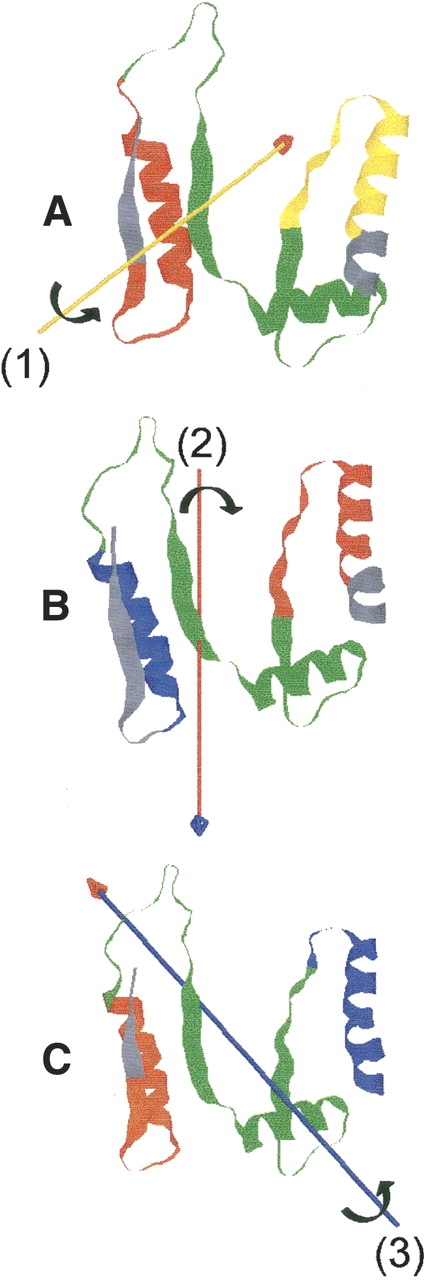
Rigid-body domain motions in α-GltSbound. N-terminal region (residues 1–100) of α-GltSbound (average structure of last 2 ns of the simulation) with domains and hinge axes as determined by program Dyn-Dom. (A) Rotation of the red domain (residues 7–32) with respect to the yellow domain (residues 73–93) about hinge-axis 1. (B) Rotation of the blue domain (residues 12–31) with respect to the red domain (residues 73–93) about hinge axis 2. (C) Rotation of the orange domain (residues 6–28) with respect to the blue domain (residues 77–99) about hinge axis 3. Hinge regions are in green.
During the simulation of α-GltSbound, a water molecule approaches Cys 1 bridging the free α-amino N and the side-chain Sγ atoms (mean value distance of last 2 ns: 0.29 and 0.35 nm, respectively) (Fig. 5B ▶). Such a water molecule may be mechanistically relevant. As shown in Figure 2 ▶, one water molecule is required in the glutaminase reaction of GltS. Overall, the above analyses demonstrate that the GltS glutaminase site may exist in at least two conformations, namely (1) the inactive conformation shown by MD calculations of α-GltSfree and (2) an active conformation stabilized by bound L-glutamine, in which the arrangement of active site residues is consistent with the proposed mechanism for L-glutamine hydrolysis (Fig. 2 ▶). The latter conformation resembles that observed in the crystal structure of free Fd-GltS and of the Fd-GltS-ONL adduct, as well as in the active conformation of well-characterized Ntn-type amidotransferases (van den Heuvel et al. 2003, 2004). These observations lead to the conclusion that the geometry of glutaminase active site in α-GltS in complex with MetS corresponds to a second inactive conformation induced by binding of the MetS ligand.
The Q-loop and solvent accessibility of the amidotransferase site
Unlike other Ntn-amidotrasferases (Isupov et al. 1996; Krahn et al. 1997; Larsen et al. 1999; Teplyakov et al. 2001), in which loops corresponding to loop 210–225 of α-GltS cover the glutaminase active site shielding it from the solvent, in α-GltS and Fd-GltS crystal structures such Q-loop is in an open conformation so that MetS or ONL are partially solvent-exposed.
In both α-GltSfree and α-GltSbound simulations the Q-loop keeps essentially the same “open” geometry as that observed in all crystal structures. However, during the α-GltSbound simulation (but not in that of α-GltSfree) a conformational change of loop 263–271 takes place so that the glutaminase active center becomes partially protected from bulk solvent (Fig. 8 ▶), while allowing water molecules to access the active site. Thus, loop 263–271 of GltS may functionally replace the Q-loop of other amidotransferases of the same class.
Figure 8.

Conformational changes of loop 263–271 of the glutaminase domain upon substrate binding to α-GltS. Details of α-GltS crystal structure (A) and of the average structure of the last 2 ns of α-GltSbound trajectory (B). The Q loop (residues 210–225) is shown in orange, loop 263–271 in green and MetS (A) or L-glutamine (B) in CPK colors.
FMN binding domain
The FMN domain of GltS spans from residues 780 to 1202 of the αsubunit. It binds the FMN cofactor of the enzyme and contributes to the formation of the [3Fe-4S] cluster with Cys residues 1102, 1108, and 1113. Furthermore, it harbors the synthase site of GltS (Figs. 1 ▶, 3 ▶).
As already pointed out, during both α-GltSfree and α-GltSbound simulations the largest RMSD from the crystal position and RMSF are observed in this domain, namely in regions 1112–1128, 1172–1179 (for α-GltSfree), and 894–902 and 1112–1128 (for α-GltSbound) (Fig. 4 ▶). Loop 1172–1179 was not identified in electron density maps regardless of the presence of 2-OG bound to the crystalline enzyme forms. MD calculations suggest that 2-OG binding brings along structuring of this protein region. The conformational flexibility of region 1112–1128 is particularly interesting because in the crystal structure of GltS this loop shields the [3Fe-4S] cluster from solvent. On the contrary, in both α-GltSfree and α-GltSbound simulations this loop is flexible and in α-GltSbound it adopts a conformation in which the [3Fe-4S] cluster becomes partially exposed to solvent. This would be consistent with the fact that the [3Fe-4S] cluster is the entry point of at least one electron from reduced ferredoxin in Fd-GltS or from the redox centers of the β subunit in NADPH-GltS αβ holoenzyme (Ravasio et al. 2001, 2002; van den Heuvel et al. 2002; Petoukov et al. 2003).
Met 479
The analysis of Met 479 behavior during the present simulations is also of particular interest. In GltS crystal structures this residue is in van der Waals contact with both the FMN cofactor and the [3Fe-4S] cluster and it adopts an unfavorable conformation, falling in a disallowed region of the Ramachandran plot (Figs. 3C ▶, 9 ▶). Met 479 belongs to a loop (470–520) of the central domain involved in the obstruction of the ammonia tunnel at the glutaminase end, through backbone atoms of residues 507–508. On these grounds, Met 479 has been proposed to play a role in the cross-talk between the glutaminase and the synthase catalytic centers of GltS by acting as the sensor of the enzyme redox state (Binda et al. 2000). At the end of both α-GltSfree and α-GltSbound simulations, Met 479 still interacts with its side chain with both the FMN cofactor and the [3Fe-4S] cluster, but its conformation has changed (Fig. 9 ▶). In the very first phase of the trajectory of α-GltSfree (approximately 200 ps) Met 479 undergoes a sudden conformational change (Fig. 9 ▶).ϕ,ψ -dihedrals assume values (average values of last 2 ns of simulation for ϕ and ψ: 58° and −109°, respectively), which differ from those of the crystallographically determined structure (68° and 154° for ϕ and ψ, respectively), but still fall in a forbidden region of the Ramachandran plot (Fig. 9A,C ▶). On the contrary, with α-GltSbound, Met 479 first adopts a conformation similar to that reached in the α-GltSfree simulation. However, it rapidly falls in an allowed region of the Ramachandran plot (average values of last 2 ns of simulation for ϕ and ψ: −80° and 63°, respectively) (Fig. 9B,D ▶). This finding supports the hypothesis of the participation of Met 479 in the mechanisms that control and coordinate catalysis in GltS and that it may act as a sensor of the enzyme ligation and/or redox state.
Figure 9.

Analysis of the molecular dynamics of the synthase site of α-GltSfree and α-GltSbound. (A,B) Ramachandran plots for Met 479 during simulations of α-GltSfree and α-GltSbound, respectively. In each plot, the star indicates the position of Met 479 in α-GltS crystal structure; the squares indicate the ϕ and ψ values assumed by Met 479 during the simulations; the white square indicates the average position of Met 479 during the last 2 ns of simulation; the arrows indicate the direction of conformational changes during the early and late stages of the simulations (see text for details). This image was made with VMD software support. (VMD is developed with NIH support by the Theoretical and Computational Biophysics group at the Beckman Institute, University of Illinois at Urbana-Champaign.) (C,D) Details of the synthase site from the average structures of α-GltSfree and α-GltSbound, respectively, during the last 2 ns of the simulations. 2-OG is shown in ball-and-stick; the water molecule, as a sphere.
2-Oxoglutarate positioning
By combining structural and biochemical evidence available, it has been proposed that, during catalysis, ammonia produced by hydrolysis of L-glutamine at the amidotransferase site, after transfer through the tunnel, is added to C2 of 2-OG forming a 2-IG intermediate (Fig. 1 ▶). Next, the C2 atom of 2-IG undergoes reduction, which is postulated to occur by hydride transfer from the N5 position of the reduced FMN cofactor. In all GltS crystallographic structures 2-OG binds in front of the flavin, protected from solvent by loops 4 (residues 933–978) and 6 (residues 1025–1047). C2 of 2-OG is about 0.4 nm far from the N5 position of the flavin ring and C1 is the carbon atom closest to the flavin N5 atom (Fig. 3C ▶).
In α-GltSfree simulation, residues of the synthase site come close to the flavin ring, obstructing the 2-OG binding pocket (Fig. 9C ▶).
During the α-GltSbound simulation, 2-OG adopts a conformation (Fig. 9D ▶) different from those observed in GltS crystal structures (Fig. 3C ▶). Rotations, mainly around C2-C3 and C3-C4 bonds, lead to a bent conformation and bring C2 carbonyl oxygen in the direction of the tunnel. As a result, the C2 atom of 2-OG shifts farther away from the flavin N5 position as compared to the crystal structures (average value of the last 2 ns of the simulation: 0.55 nm) and C3 becomes the 2-OG atom closest to the flavin N5 position. Throughout the simulation, C1 and C5 carboxylate groups maintain the same interactions as those observed in the starting α-GltS crystal structure (Binda et al. 2000). 2-OG carbonyl oxygen, which now points in the direction of the tunnel, establishes interactions with Lys 931 side chain, and approaches Gln 934 side-chain oxygen and Gly 941. One water molecule is also found to interact with both 2-OG carboxylate groups (Fig. 9D ▶). No interaction is observed between 2-OG C2 carbonyl oxygen and either Lys 937 or Glu 886. These two residues correspond to Lys 972 and Glu 903 of Fd-GltS, where they have been suggested to play a role in promoting ammonia addition to C2 and reduction of the 2-IG intermediate, respectively (van den Heuvel et al. 2003).
As discussed previously (van den Heuvel et al. 2003), ammonia addition to 2-OG C2 carbon would be favored by the interaction between 2-OG carbonyl oxygen and Lys 937. In order to allow reductive glutamate synthesis, it has been postulated that the 2-IG intermediate reorients in the synthase site to lay parallel to the flavin ring with C2 at a distance from N5 atom compatible with hydride transfer. Modelling studies (van den Heuvel et al. 2003) indicated that such repositioning is possible and would bring the imine nitrogen in hydrogen bonding distance from Glu 886 side-chain carboxylate, which may assist 2-IG reduction. The α-GltSbound simulation presented here would suggest that Lys 931 rather than Lys 937 is important to favor ammonia addition to 2-OG. While the specific role of such Glu or Lys residues will be addressed by site-directed mutagenesis experiments, further studies are required to specifically address the question of 2-OG/2-IG positioning in the GltS synthase site.
Ammonia tunnel
As previously discussed, the ammonia molecule produced at the glutaminase site of GltS must reach the enzyme synthase site by diffusing through the approximately 30 Å-long intramolecular channel.
In the crystal structure of α-GltS the tunnel connecting the two catalytic sites is obstructed by backbone atoms of residues 507–508 of the central domain and 976–977 of the FMN binding domain. The distance between the centers of mass of Cα of the two segments is 0.54 nm in the crystal structure of α-GltS in complex with MetS and 2-OG. Therefore, a shift of 2 Å–3 Å of one or both protein segments is required to allow ammonia to enter the tunnel. The α-GltSfree simulation shows that removal of the MetS and 2-OG ligands causes a quick narrowing of the passageway that remains obstructed throughout the simulation with a distance between the centers of mass of Cα of residues 507–508 and 976–978 that varies between 0.43 and 0.56 nm (mean value: 0.48 nm) (Fig. 10 ▶). On the contrary, MD simulation of α-GltSbound shows that in this enzyme form the tunnel constriction widens enough to allow ammonia access to the main part of the tunnel. In α-GltSbound simulation the distance between the centers of mass of Cα of residues 507–508 and 976–978 is in the 0.67–0.87 nm range (mean value: 0.75 nm) (Fig. 10 ▶).
Figure 10.

Size of the ammonia tunnel entrance in α-GltSfree and α-GltSbound. The distance between the centers of mass of Cα of Thr 507-Asn 508 and Ser 976-Ile 977 is shown as a function of simulation time. The dashed line represents the corresponding value observed in α-GltS crystal structure.
The opening of the tunnel in α-GltSbound allows entrance of water molecules varying in number from 10 at the beginning of the simulation to 16 at the end (Fig. 6B ▶). They form a hydrogen bond network with residues lining the channel, which resembles that observed in Fd-GltS crystal structures (van den Heuvel et al. 2002, 2003; Fig. 6D ▶). On the contrary, only 3–4 water molecules were observed throughout the α-GltSfree simulation (Fig. 6A ▶).
Discussion
Models of GltS α subunit in the oxidized free (unliganded) state and of the enzyme with the L-glutamine and 2-OG substrates bound and the FMN cofactor in the reduced state were generated starting from the crystallographically determined structure of the oxidized GltS α subunit in complex with the L-glutamine analog MetS and 2-OG. For each model system 4-ns molecular dynamics calculations were carried out at 300 K to determine conformational flexibility of the enzyme molecule and the conformational changes brought about by binding of the substrates to the enzyme catalytic subsites harbored within the α subunit of glutamate synthase (namely, the glutaminase and the synthase sites). The results of MD simulations confirm the proposal that multiple conformations are possible for the glutaminase site of GltS. This is another property in common with other amidotransferases of this family, as shown, for example, for phoshoribosyl pyrophosphate amidotransferase (Bera et al. 2000 and references therein). Substitution of L-Gln for the MetS inhibitor in the crystallographic structure of α-GltS converts the inactive conformation observed in α-GltS-MetS crystal structure (Binda et al. 2000) into the catalytically active conformation detected in all Fd-GltS crystal structures (van den Heuvel et al. 2002, 2003; Fig. 5 ▶). We here show that such interconversion takes place through quasi-rigid body motions of well-defined segments of α-GltS glutaminase domain (Fig. 7 ▶).
MD also revealed a second inactive conformation of the glutaminase site. In the absence of ligands the glutaminase site of GltS shrinks with a reorientation of Cys 1 leading to a conformation both unable to bind L-Gln and to catalyse its hydrolysis (Fig. 5 ▶).
The Q-loop, which is conserved in all amidotransferases and shields the glutaminase active site from solvent in the active conformation of other enzymes of this class, remains in an open conformation in the present MD simulations as found for the crystal structures of α-GltS and Fd-GltS forms (van den Heuvel et al. 2004). However, MD calculations reveal that loop 263–271 may functionally replace the Q-loop so that only in the α-GltSbound enzyme model it (partially) shields the bound glutamine molecule from bulk solvent (Fig. 8 ▶).
The simulations presented here also demonstrate that the enzyme ligation and redox states have a significant effect on the properties of the intramolecular ammonia tunnel. In the bound form, the tunnel entrance at the glutaminase end widens to reach a size large enough for ammonia to enter it (Fig. 10 ▶). Accordingly, in α-GltSbound, but not in α-GltSfree, several water molecules are found in the ammonia tunnel at positions similar to those observed in the crystal structure of the Fd-GltS-ONL adduct in complex with 2-OG (van den Heuvel et al. 2003; Fig. 6 ▶). At the synthase site, it was confirmed that 2-OG binds to the enzyme in a position that prevents the direct reduction of its C2 carbon by reduced FMN and that major reorientation must take place after addition of ammonia to the 2-OG substrate to allow for FMN-dependent reduction of the 2-IG intermediate.
Overall, the MD calculations presented here are in excellent agreement with the concept that binding of substrates to GltS and the cofactors redox state play a key role in controlling and coordinating the catalytic activities associated with the catalytic sub-sites. The nature of such changes, which are of limited amplitude, may have gone undetected by X-ray crystallography studies on α-GltS and Fd-GltS forms or, more likely, crystallization has selected just one of the possible conformations of each enzyme form.
The fact that conformational changes have been detected by molecular dynamics in spite of the size and complexity of the enzyme, indicates an unexpected sensitivity of the system to binding of small ligands. Thus, it will be feasible to dissect in greater detail the influence of the presence of each one of the substrates and of the redox state of each one of the cofactors on the observed conformational changes by extending the molecular dynamics calculations presented here. Finally, the computational results nicely complement structural information on the enzyme and will serve as a guide to design site-directed mutant GltS forms in order to test the precise role of specific amino acyl residues in catalysis and regulation of this complex enzyme.
Materials and methods
All simulations were performed using the GROMACS software package (Berendsen et al. 1995; Lindahl et al. 2001). MD simulations were done starting from the crystallographic coordinates of the A-chain of α-GltS crystal structure in complex with MetS and 2-OG (PDB code 1EA0; Binda et al. 2000).
In order to perform calculations on the free enzyme (α-GltSfree) the MetS and 2-OG ligands were removed from the starting model. The model included FMN in its oxidized form and the [3Fe-4S]+1 cluster. To model α-GltS in complex with its substrates (α-GltSbound), the crystallographic coordinates of α-GltS in complex with MetS and 2-OG were directly used except for the fact that an L-glutamine molecule was substituted for MetS. Furthermore, reduced FMN was included in this model (see below) to yield the enzyme species in a catalytically competent state. In both cases, the model was completed by adding residues 305–307, 1172–1179, and 1194–1202, which were not detected in the crystallographic structure, due to conformational disorder. Such protein segments were generated using INSIGHT II 97.0 (Accelrys Inc.), inserted at the appropriate place in the α-GltS crystal coordinates and refined with a series of cycles of steepest-descent-energy-minimization algorithm.
For both simulations the protein-free terminal amino group and Cys(1) side chain were modelled in the protonated state after preliminary 2-ns MD calculations showed no detectable effect of the protonation state of these groups on the enzyme conformation. Similarly, the redox state of the FMN cofactor did not seem to affect the results of calculations done starting from the α-GltS-free model.
Modeling of the α-GltS [3Fe-4S]+1 cluster
The atomic charges on the [3Fe-4S]+1 cluster were evaluated on the [(CH3S)3Fe3S4]2− system selected as the model structure. A standard Mulliken population analysis was performed on the minimized structure using Density Functional Theory level by adopting the hybrid B3LYP functional (Becke 1993) in the unrestricted formalism as implemented in GAUSSIAN 98 package (Gaussian Inc.). B3LYP calculations are known to ensure a rather poor contamination of the spin states (Montoya et al. 2000), yielding an S2 value very close to the theoretical one. Among the allowed spin states we selected the experimental one, which is known to correspond to a state where the three Fe3+ are antiferromagnetically coupled (Bertini et al. 1998) (i.e., S 31/2). The calculations were performed using differently sized atomic basis sets: double-ζ quality basis set plus polarization and diffusion [i.e. 6–31+g(d)], was adopted for sulfur, carbon, and hydrogen atoms; double-ζ 3–21g and the effective core potential LanL2DZ were used for the valence and the core iron electrons, respectively.
Modeling of ligands
The force field parameters for 2-OG, L-Gln and FMN in the oxidized and hydroquinone state were taken from GROMOS96 library (van Gunsteren et al. 1996). L-Gln was positioned by fitting N, C, Cα, Cβ, Cγ skeleton atoms onto the corresponding atoms of MetS.
Calculation methods and conditions
For both α-GltSfree and α-GltSbound starting enzyme models, the system was solvated with water in a periodic truncated octahedron box, large enough to contain the system and 1 nm of solvent on all sides. Na+ counterions were added to provide a neutral simulation cell. The composition of the resulting systems is reported in Table 1. During the productive phase of the simulation, the temperature was kept constant at 300 K using the Gaussian iso-kinetic coupling algorithm (Berendsen et al. 1984) while the pressure was kept constant by the weak coupling constant of 1 bar (Berendsen et al. 1984). The GROMOS96 force field library (van Gunsteren et al. 1996) was used. For water molecules, the SPC water model was used (Berendsen et al. 1981). The LINCS algorithm (Hess et al. 1997) was used to constrain all the bond lengths. For the water molecules, the SETTLE algorithm was used to constrain bond lengths and bond angles (Miyamoto et al. 1992). The dielectric constant was set to a value of 1.0. By using dummy hydrogen atoms (Feenstra et al. 1999) a time-step of 4 fs could be chosen. A twin-range cutoff method was used for nonbonded interactions. Nonbonded interactions within 0.8 nm were calculated every step, whereas interactions at a distance of between 0.8 nm and 1.4 nm were updated every five steps. The potential energy of each system was first minimized using the steepest descent algorithm.
Water molecules were allowed to adjust by performing 200 ps of molecular dynamics with position restraints on the protein. Atoms were given initial velocities from the Maxwell distribution at 300 K. Each system was equilibrated for 100 ps before trajectory data were produced for analysis. Four-nanosecond production runs were performed on free and bound systems.
Essential dynamics analysis of the trajectories
The ED analysis (Amadei et al. 1993) of the enzyme positional fluctuations along the MD trajectories was carried out to detect correlated domain motions of large amplitude. This method allows the characterization of relevant collective motions (essential motions) occurring during the MD simulation and to distinguish them from thermal noise motions (Amadei et al. 1993). The analysis was performed by building the covariance matrix of the positional fluctuations of the backbone atoms (Cα, N, C) obtained from MD simulations. To reduce the calculation required to diagonalize the covariance matrix, we took into account only the first 1202 residues of α-GltS, excluding its C-terminal β-helix. Upon diagonalization of the covariance matrix, a set of eigenvalues and eigenvectors is generated defining a new set of generalized coordinates. The eigenvectors correspond to directions in a 3N dimensional space (where N 33606 is the number of atoms used for the analysis corresponding to N, Cα, and carbonyl C atoms of the 1202 residues included in the calculation) along which collective fluctuations of atoms occur. The eigenvalues represent the total mean square fluctuation of the system along the corresponding eigenvector.
DynDom analysis of the trajectories
To analyze the conformational changes occurring in the protein along the simulations in terms of intra- or inter-domain motion, the program DynDom (Hayward et al. 1998; Hayward 1999) was used. This analysis determines the regions that act as “mechanical hinges” between dynamic domain regions. The combined use of MD simulations and DynDom has been successfully employed to explore the dynamics of protein domains (de Groot et al. 1998; Roccatano et al. 2001). Herein, we used the same approach by analyzing the structures having the opposite largest displacement along the first three eigenvectors obtained by the ED analysis of both simulations.
Acknowledgments
Acknowledgments
We thank MIUR, project “Struttura e dinamica di proteine redox,” and BEMM for financial support. Prof. A. Mattevi (Pavia) is thanked for helpful discussions.
Abbreviations
GltS, glutamate synthase
NADPH, nicotinamide adenine dinucleotide phosphate
NADH, nicotinamide adenine dinucleotide
FAD, flavin adenine dinucleotide
FMN, flavin mononucleotide
NAD(P)H-GltS, reduced nicotinamide adenine dinucleotide (phosphate)-dependent glutamate synthase
Fd, ferredoxin
Fd-GltS, Fd-dependent glutamate synthase
α-GltS, α subunit of NADPH-dependent glutamate synthase
α-GltSfree, α-GltS in the substrate-free state with the FMN cofactor in the oxidized state
α-GltSbound, α-GltS in complex with its substrates L-glutamine and 2-oxoglutarate with the FMN cofactor in the reduced state
MetS, L-methionine sulphone
ONL, 5-oxo-L-norleucine
2-OG, 2-oxoglutarate
2-IG, 2-iminoglutarate
MD, molecular dynamics
ED, essential dynamics
RMSD, root-mean-square deviation
RMSF, root-mean-square fluctuation
Article and publication are at http://www.proteinsci.org/cgi/doi/10.1110/ps.04863104.
References
- Amadei, A., Linssen, A.B.M., and Berendsen, H.J.C. 1993. Essential dynamics of proteins. Proteins 17 412–425. [DOI] [PubMed] [Google Scholar]
- Amadei, A., Ceruso, M.-A., and Di Nola, A. 1999. On the convergence of the conformational coordinates basis set obtained by essential dynamics analysis of proteins molecular dynamics simulations. Proteins 36 419–424. [PubMed] [Google Scholar]
- Aschi, M., Roccatano, D., Di Nola, A., Gallina, C., Gavuzzo, E., Pochetti, G., Pieper, M., Tschesche, H., and Mazza, F. 2002. Computational study of the catalytic domain of human neutrofil collagenase. Specific role of the S3 and S’3 subsites in the interaction with a phosphonate inhibitor. J. Comput. Aided Mol. Des. 16 213–225. [DOI] [PubMed] [Google Scholar]
- Becke, A.D. 1993. Density functional thermochemistry III: The role of exact exchange. J. Chem. Phys. 98 5648–5652. [Google Scholar]
- Bera, A.K., Smith, J.L., and Zalkin, H. 2000. Dual role for the glutamine phosphoribosylpyrophosphate amidotransferase ammonia channel. J. Biol. Chem. 275 7975–7979. [DOI] [PubMed] [Google Scholar]
- Berendsen, H.J.C., Postma, J.P.M., van Gunsteren, W.F., and Hermans, H.J. 1981. Interaction models for water in relation to protein hydration. In Intermolecular forces (ed. B. Pullman), pp. 331–342. Reidel, Dordrecht, The Netherlands.
- Berendsen, H.J.C., Postma, J.P.M., van Gunsteren, W.F., and Di Nola, A. 1984. Molecular dynamics with coupling to an external bath. J. Chem. Phys. 81 3684–3690. [Google Scholar]
- Berendsen, H.J.C., van der Spoel, D., and van Drunen, R. 1995. GROMACS: A message-passing parallel molecular dynamics implementation. Comp. Phys. Comm. 91 43–56. [Google Scholar]
- Bernstein, H.J. 2000. Recent changes to RasMol, recombining the variants. Trends Biochem. Sci. 25 453–455. [DOI] [PubMed] [Google Scholar]
- Bertini, I., Luchinat, C., Mincione, G., and Soriano, A. 1998. 2H-NMR investigation of [Fe3S4]0 cluster in 7Fe8S ferredoxin from Bacillus schlegelii. Inorg. Chem. 37 969–972. [Google Scholar]
- Binda, C., Bossi, R.T., Wakatsuki, S., Arzt, S., Coda, A., Curti, B., Vanoni, M.A., and Mattevi, A. 2000. Cross-talk and ammonia channeling between active centers in the unexpected domain arrangement of glutamate synthase. Structure 8 1299–1308. [DOI] [PubMed] [Google Scholar]
- de Groot, B.L., Hayward, S., van Aalten, D.M.F., Amadei, A., and Berendsen, H.J.C. 1998. Domain motions in bacteriophage T4 lysozyme: A comparison between molecular dynamics and crystallographic data. Proteins 31 116–127. [DOI] [PubMed] [Google Scholar]
- Feenstra, K.A., Hess, B., and Berendsen, H.J.C. 1999. Improving efficiency of large time-scale molecular dynamics simulations of hydrogen rich systems. J. Comput. Chem. 20 786–798. [DOI] [PubMed] [Google Scholar]
- Hayward, S. 1999. Structural principles governing domain motions in proteins. Proteins 36 425–435. [PubMed] [Google Scholar]
- Hayward, S. and Berendsen, H.J.C. 1998. Systematic analysis of domain motions in proteins from conformational change: New results on citrate synthase and T4 lysozyme. Proteins 30 144–154. [PubMed] [Google Scholar]
- Hess, B. 2000. Convergence of sampling in protein simulations. Phys. Rev. E 62 8438–8448. [DOI] [PubMed] [Google Scholar]
- Hess, B., Bekker, H., Berendsen, H.J.C., and Fraije, J.G.E.M. 1997. LINCS: A linear constraint solver for molecular simulations. J. Comput. Chem. 18 1463–1472. [Google Scholar]
- Isupov, M.N., Obmolova, G., Butterworth, S., Badet-Denisot, M.A., Badet, B., Polikarpov, I., Littlechild, J.A., and Teplyakov, A. 1996. Substrate binding is required for assembly of the active conformation of the catalytic site in Ntn amidotransferases: Evidence from the 1.8 Å crystal structure of the glutaminase domain of glucosamine 6-phosphate synthase. Structure 4 801–810. [DOI] [PubMed] [Google Scholar]
- Krahn, J.M., Kim, J.H., Burns, M.R., Parry, R.J., Zalkin, H., and Smith, J.L. 1997. Coupled formation of an amidotransferase interdomain ammonia channel and a phosphoribosyltransferase active site. Biochemistry 37 11061–11068. [DOI] [PubMed] [Google Scholar]
- Larsen, T.M., Boehlein, S.K., Schuster, S.M., Richards, M.D., Thoden, J.B., Holden, H.M., and Rayment, I. 1999. Three-dimensional structure of Escherichia coli asparagine synthetase B: A short journey from substrate to product. Biochemistry 38 16146–16157. [DOI] [PubMed] [Google Scholar]
- Laskowski, R.A. 1995. SURFNET: A program for visualizing molecular surfaces, cavities and intermolecular interactions. J. Mol. Graph. 13 323–330. [DOI] [PubMed] [Google Scholar]
- Lindahl, E., Hess, B., and van der Spoel, D. 2001. GROMACS 3.0: A package for molecular simulation and trajectory analysis. J. Mol. Model 7 306–317. [Google Scholar]
- Massiére, F. and Badet-Denisot, M.A. 1998. The mechanism of glutamine-dependent amidotransferases. Cell. Mol. Life Sci. 54 205–222. [DOI] [PMC free article] [PubMed] [Google Scholar]
- Miyamoto, S. and Kollman, P.A. 1992. SETTLE: An analytical version of the SHAKE and RATTLE algorithms for rigid water models. J. Comput. Chem. 13 952–962. [Google Scholar]
- Montoya, A., Truong, T.N., and Sarofim, A.F. 2000. Spin contamination in Hartree-Fock and density functional theory wavefunctions in modeling of adsorption on graphite. J. Phys. Chem. A 104 6108–6110. [Google Scholar]
- Petoukhov, M.V., Svergun, D.I., Konarev, P.V., Ravasio, S., van den Heuvel, R.H., Curti, B., and Vanoni, M.A. 2003. Quaternary structure of Azospirillum brasilense NADPH-dependent glutamate synthase in solution as revealed by synchrotron radiation x-ray scattering. J. Biol. Chem. 278 29933–29939. [DOI] [PubMed] [Google Scholar]
- Raushel, F.M., Thoden, J.B., and Holden, H. 2003. Enzymes with molecular tunnels. Acc. Chem. Res. 36 539–548. [DOI] [PubMed] [Google Scholar]
- Ravasio, S., Curti, B., and Vanoni, M.A. 2001. Determination of the midpoint potential of the FAD and FMN flavin cofactors and of the 3Fe-4S cluster of glutamate synthase. Biochemistry 40 5533–5541. [DOI] [PubMed] [Google Scholar]
- Ravasio, S., Dossena, L., Martin-Figueroa, E., Florencio, F.J., Mattevi, A., Morandi, P., Curti, B., and Vanoni, M.A. 2002. Properties of the recombinant ferredoxin-dependent glutamate synthase of Synechocystis PCC6803. Comparison with the Azospirillum brasilense NADPH-dependent enzyme and its isolated α subunit. Biochemistry 41 8120–8133. [DOI] [PubMed] [Google Scholar]
- Roccatano, D., Mark, A.E., and Hayward, S. 2001. Investigation of the domain closure in citrate synthase by molecular dynamics simulations. J. Mol. Biol. 310 1039–1053. [DOI] [PubMed] [Google Scholar]
- Sayle, R.A., and Milner-White, E.J. 1995. RASMOL: Biomolecular graphics for all. Trends Biochem. Sci. 20 374–376. [DOI] [PubMed] [Google Scholar]
- Teplyakov, A., Obmolova, G., Badet, B., and Badet-Denisot, M.A. 2001. Channeling of ammonia in glucosamine-6-phosphate synthase. J. Mol. Biol. 313 1093–1102. [DOI] [PubMed] [Google Scholar]
- van den Heuvel, R.H., Ferrari, D., Bossi, R.T., Ravasio, S., Curti, B., Vanoni, M.A., Florencio, F.J., and Mattevi, A. 2002. Structural studies on the synchronization of catalytic centers in glutamate synthase. J. Biol. Chem. 277 24579–24583. [DOI] [PubMed] [Google Scholar]
- van den Heuvel, R.H., Svergun, D.I., Petoukhov, M.V., Coda, A., Curti, B., Ravasio, S., Vanoni, M.A., and Mattevi, A. 2003. The active conformation of glutamate synthase and its binding to ferredoxin. J. Mol. Biol. 330 113–128. [DOI] [PubMed] [Google Scholar]
- van den Heuvel, R.H., Curti, B., Vanoni, M.A., and Mattevi, A. 2004. Glutamate synthase: A fascinating pathway from L-glutamine to L-glutamate. Cell. Mol. Life Sci. 61 669–681. [DOI] [PMC free article] [PubMed] [Google Scholar]
- van Gunsteren, W.F., Billeter, S.R., Eising, A.A., Hunenberger, P.H., Kruger, P., Mark, A.E., Scott, V.R.P., and Tironi, I.G. 1996. Biomolecular simulation: The GROMOS96 manual and user guide. vdf Hochschlverlag AG an der ETH Zurich, Zurich.
- Vanoni, M.A. and Curti, B. 1999. Glutamate synthase: A complex iron-sulfur flavoprotein. Cell. Mol. Life Sci. 55 617–638. [DOI] [PMC free article] [PubMed] [Google Scholar]
- Vanoni, M.A., Edmondson, D.E., Rescigno, M., Zanetti, G., and Curti, B. 1991. Mechanistic studies on Azospirillum brasilense glutamate synthase. Biochemistry 30 11478–11484. [DOI] [PubMed] [Google Scholar]
- Vanoni, M.A., Verzotti, E., Zanetti, G., and Curti, B. 1996. Glutamate synthase: Properties of the recombinant β subunit. Eur. J. Biochem. 236 937–946. [DOI] [PubMed] [Google Scholar]
- Vanoni, M.A., Fischer, F., Ravasio, S., Verzotti, E., Edmondson, D.E., Hagen, W.R., Zanetti, G., and Curti, B. 1998. The recombinant α subunit of glutamate synthase: Spectroscopic and catalytic properties. Biochemistry 37 1828–1838. [DOI] [PubMed] [Google Scholar]
- Vanoni, M.A., Dossena, L., van den Heuvel, R.H.H., and Curti, B. 2004. Structure-function studies on the complex iron-sulfur flavoprotein glutamate synthase: The key enzyme of ammonia assimilation. Photosyn. Res. (in press) [DOI] [PubMed]
- Zalkin, H. and Smith, J.L. 1998. Enzymes utilising glutamine as an amide donor. Adv. Enzymol. Relat. Areas Mol. Biol. 72 87–144. [DOI] [PubMed] [Google Scholar]