Abstract
The conformations of loops are determined by the water-mediated interactions between amino acid residues. Energy functions that describe the interactions can be derived either from physical principles (physical-based energy function) or statistical analysis of known protein structures (knowledge-based statistical potentials). It is commonly believed that statistical potentials are appropriate for coarse-grained representation of proteins but are not as accurate as physical-based potentials when atomic resolution is required. Several recent applications of physical-based energy functions to loop selections appear to support this view. In this article, we apply a recently developed DFIRE-based statistical potential to three different loop decoy sets (RAPPER, Jacobson, and Forrest-Woolf sets). Together with a rotamer library for side-chain optimization, the performance of DFIRE-based potential in the RAPPER decoy set (385 loop targets) is comparable to that of AMBER/GBSA for short loops (two to eight residues). The DFIRE is more accurate for longer loops (9 to 12 residues). Similar trend is observed when comparing DFIRE with another physical-based OPLS/SGB-NP energy function in the large Jacobson decoy set (788 loop targets). In the Forrest-Woolf decoy set for the loops of membrane proteins, the DFIRE potential performs substantially better than the combination of the CHARMM force field with several solvation models. The results suggest that a single-term DFIRE-statistical energy function can provide an accurate loop prediction at a fraction of computing cost required for more complicate physical-based energy functions. A Web server for academic users is established for loop selection at the softwares/services section of the Web site http://theory.med.buffalo.edu/.
Keywords: Knowledge-based potential, loop decoy sets, ideal-gas reference state, loop prediction
The regions of protein structures that do not belong to regular secondary structural units are all grossed under the term “loop.” Unlike secondary structure units, the conformations of loops are more like coils (Swindells et al. 1995), and the same loop sequence may have totally different conformations in different proteins (Kabsch and Sander 1985; Cohen et al. 1993; Mezei 1998). Loops often are the most flexible part of proteins, and their flexibility sometimes plays a functional role such as in molecular switches, molecular recognition, induced fit, ion selectivity, and domain swapping (Brooks III et al. 1988). The short lengths, conformational diversity, and weak dependence of structure on sequence all make the prediction of loop conformations an ideal and challenging testing ground for the accuracy of an energy function. Moreover, loop prediction itself is an essential part of homology modeling because the loop regions are most likely the structurally unconserved regions (Fiser et al. 2000).
Loop-structure prediction is a nontrivial miniprotein folding problem, especially if the loop length is longer than eight residues (Mart-Renom et al. 2000; Schonbrun et al. 2002). There are two main approaches for loop prediction. The ab initio methods involve energy-biased (or score-biased) conformational search (Fine et al. 1986; Moult and James 1986a,b; Bruccoleri and Karplus 1987; Rapp and Friesner 1999; Galaktionov et al. 2001; Xiang et al. 2002), whereas the database methods attempt to locate the loop fragment from a database that fits most to the loop region (Greer 1980; Donate et al. 1996; Oliva et al. 1997; Rufino et al. 1997; Burke et al. 2000; Burke and Deane 2001). The combination of the two approaches has also been proposed (Chothia et al. 1986; van Vlijmen and Karplus 1997; Deane and Blundell 2001).
The key for the success of ab initio prediction is an accurate conformational sampling (or search) of near-native conformations and an accurate energy function that selects the near-native conformations as the lowest (free) energy conformation. The energy function that would yield a complete understanding of loop folding should be derived from the laws of physics. However, the use of such physical-based potentials (Brooks et al. 1983; Weiner et al. 1986; Jorgensen et al. 1996; Scott et al. 1999) for ab initio loop prediction is limited by available computing power. Their large-scale application to loop prediction (de Bakker et al. 2003; Jacobson et al. 2003) often requires an implicit-solvent model to approximate solvent contribution to the stability of a loop conformation.
An alternative approach to obtain energy function is the knowledge-based statistical potential that extracts interaction energies directly from known protein structures (Tanaka and Scheraga 1976). Knowledge-based statistical potentials are attractive because they are simple and computationally efficient. For example, de Bakker et al. (2003) found that loop prediction using the knowledge-based all-atom potential RAPDF (Samudrala and Moult 1998) is about two orders of magnitude faster than using the physical-based energy-function AMBER (Weiner et al. 1986) with generalized Born solvation and accessible surface-continuum solvation (GBSA) model (Qiu et al. 1997). Unfortunately, RAPDF is found to be significantly less accurate in loop prediction than AMBER/GBSA.
The accuracy of knowledge-based potentials has been limited because these potentials often violate or ignore basic physical principles. For example, the higher population of hydrophobic residues than that of hydrophilic residues at the core of proteins leads to unphysical long-range repulsion between hydrophobic residues (Thomas and Dill 1996) for the distance-dependent pair potential based on the commonly used Sippl approximation (Sippl 1990). The significantly different compositions at the surface, core, and interface of proteins (Glaser et al. 2001; Lu et al. 2003; Ofran and Rost 2003) yield quantitatively different distance-dependent pair potentials for folding and binding studies (Moont et al. 1999; Lu et al. 2003), despite the fact that folding and binding involve the same physical interaction—water-mediated interaction between amino acid residues.
Recently, a residue-specific all-atom, distance-dependent potential of mean force was extracted from the structures of single-chain proteins by using a physical state of uniformly distributed points in finite spheres (distance-scaled, finite, ideal-gas reference [DFIRE] state) as the zero-interaction reference state (Zhou and Zhou 2002). Remarkably, the physical reference state yields a potential of mean force that no longer possesses some unphysical characteristics associated with other statistical potentials. It was shown that the accuracy of DFIRE-based potential is insensitive to the partitioning of hydrophobic and hydrophilic residues within a protein (Zhou and Zhou 2002). More importantly, the new structure-derived potential can quantitatively reproduce the likelihood of a residue to be buried (i.e., the composition difference of amino acid residues between core and surface; Zhou and Zhou 2003). The potential also yields a stability scale of amino acid residues in quantitative agreement with that independently extracted from mutation experimental data (Zhou and Zhou 2003). Moreover, the “monomer” potential (derived from single-chain proteins) is found to be equally successful in discriminating against docking decoys, distinguishing true dimeric interfaces from crystal interfaces, and predicting binding free energy of protein–protein and protein–peptide complexes (Liu et al. 2004). The results suggest that the DFIRE-based potential captures the essence of the common physical interaction masked under different compositions of amino acid residues on surface, at core and interface of proteins.
In this article, we compare the performance of this physically more accurate statistical potential to that of physical-based energy functions in loop prediction. Three loop decoy sets were employed. The first set (called the RAPPER set), built by de Bakker et al. (2003), contains 385 target loops of length between 2 and 12 residues. Each loop has 1000 decoys. The second set (called the Jacobson set; Jacobson et al. 2003) contains 788 target loops of lengths between 4 and 12 residues. Each loop contains 200–1400 decoys. The third set, called the Forrest-Woolf set, is for two membrane proteins (Rhodopsin and Ca2+-ATPase). Each protein has about 910 decoys, which are made from denaturations of several designated loop regions. The performance of DFIRE potential is compared to that of the physical-based AMBER force field (Weiner et al. 1986) with Generalized Born/Solvent-accessible (GB/SA) surface potential for solvation (Qiu et al. 1997) in the first set, the physical-based OPLS force field (Jorgensen et al. 1996; Kaminski et al. 2001) with surface generalized Born and a nonpolar solvation model (SGB-NP; Gallicchio et al. 2002) in the second set, and the combination of CHARMM (Brooks et al. 1983) with several implicit solvation models (effective energy function or EEF1; Lazaridis and Karplus 1999; generalized Born/Analytical Continuum Solvent method or ACS; Schaefer et al. 1998; linearized finite difference Poisson-Boltzmann equation for solvation or FDPB in CHARMM; Brooks et al. 1983) in the third set. Results indicate that DFIRE is comparable in accuracy in loop selections of short loops and more accurate for the selections of long loops (more than nine residues). Because the computing time required by the DFIRE potential is only a tiny fraction of what is needed for physical-based energy functions (about two orders of magnitude less, according to one estimate; de Bakker et al. 2003), DFIRE potential is expected to be useful in a genomic-scale homology modeling.
Results
RAPPER decoy set
The backbone structures in the RAPPER loop decoy set were built by RAPPER (DePristo et al. 2003), a conformational sampling method in dihedral space. The side chains of the decoys were built by SCWRL, a rotamer library search method to minimize the energy of steric clash (Bower et al. 1997). The 385 loop targets (lengths from 2 to 12) were collected by Fiser et al. (2000). The number of loops at each loop length in the RAPPER decoy set is listed in Table S1 (Supplemental Material). Each loop has 1000 decoys.
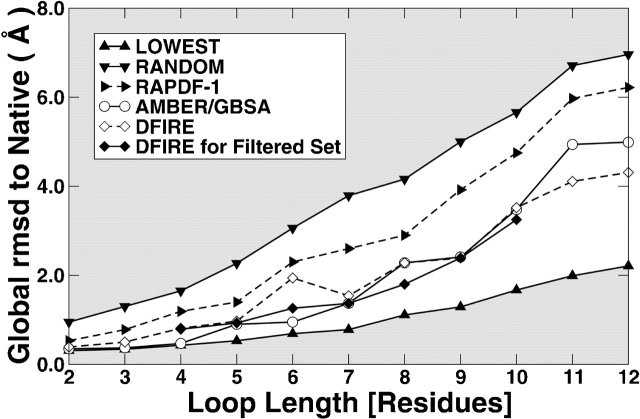
Figure 1 ▶ compares the average global RMSD values of those decoys that have the lowest energy score for their respective target loops. The global RMSD values are the RMSD of the target-loop region while structurally aligning the rest of proteins. The energy scores are determined by the all-atom knowledge-based energy-function RAPDF (Samudrala and Moult 1998), the physical-based energy-function AMBER/GBSA with and without minimization, and DFIRE with and without sequentially optimized side-chain conformations. The results for the first two methods (RAPDF and AMBER/GBSA) were reported by de Bakker et al. (2003). Only the results based on minimized energies are displayed in Figure 1 ▶. (All results can be found in Table S2 of the Supplemental Material.) It is clear that the DFIRE with or without minimization is substantially more accurate than RAPDF in selecting near-native decoys. The comparison between AMBER/GBSA and DFIRE is less clear cut. The average global RMSD values for minimized structures given by DFIRE are smaller than those given by AMBER/GBSA for those loops of lengths between 9 and 12, the same at a loop length of 8, but greater for the loops of lengths between 2 and 7. It seems that DFIRE is more accurate than AMBER/GBSA for longer loops but less so for shorter ones. For the longest 11- and 12-residue loops, DFIRE is substantially more accurate (i.e., is able to select loops with significantly lower RMSD values [>0.5 Å]; 0.5 Å cutoff is an arbitrary cutoff number for the sake of discussion.)
Figure 1.
The average global rmsd (Å) to native structures of lowest-energy RAPPER decoys using different scoring functions (as labeled) as a function of loop length. (Up triangles) The best-possible selection (the average of the smallest RMSD decoys sampled by RAPPER), (down triangles) random selection (the average RMSD of all conformers sampled by RAPPER), (left triangles) RAPDF, (circles) AMBER/GBSA minimized. DFIRE with rotamer minimization for full and filtered sets are shown by open diamonds and filled diamonds, respectively.
Even though DFIRE is less accurate than AMBER/GBSA for short loops, its results are mostly comparable with those given by AMBER/GBSA. The difference between the two methods for the average global RMSD values of lowest energy decoys for target loops is less than 0.5 Å except for the six-residue loops (Fig. 1 ▶). The average global RMSD value is 1.94 Å for DFIRE and 0.95 Å for AMBER/GBSA. One of the reasons we found is that the decoy loop with the lowest DFIRE energy (e.g., a six-residue loop [350–355] in protein 1PHF [metyrapone- and phenylimidazole-inhibited complexes of cytochrome P450cam]) occupied the position intended for ligands (e.g., the heme group in 1PHF). In our calculations, the positions of ligands (or other nonamino acid atoms/molecules) are not included.
To remove errors not caused by energy functions (but caused by, e.g., high flexibility, pH, and the presence of ligands and ions), Jacobson et al. (2003) provided a filtered loop set for the loop lengths between 4 and 10. (Jacobson et al. did not include the short loops of lengths of 2 and 3 because they were only interested in loops longer than 3. They did not study the loops of lengths of 11 and 12 in the RAPPER set collected by Fiser et al. [2000] because those loops often contain a high percentage of secondary structures.) Indeed, for this filtered loop decoy set, DFIRE results are now comparable (less than 0.5 Å difference) to those of AMBER/GBSA, as shown in Figure 1 ▶.
The trend that DFIRE is more accurate for long loops is not only true for the average but is also true for the standard deviation. For clarity, standard deviation is not shown in Figure 1 ▶ but listed in Table S2. The standard deviations of RMSD values given by DFIRE are comparable to those given by AMBER/GBSA for short loops of length between 2 and 4 but are smaller for long loops of lengths between 5 and 12.
Table S2 also shows the effect of energy minimization on the accuracy of loop sections. In most cases, minimization for the DFIRE energy function with a rotamer library improves the global RMSD values somewhat. Minimization also improves the correlation coefficients between the global RMSD values and energy scores (Table S3). The improvement in selection accuracy and correlation, however, is small. This perhaps is related to the fact that only side-chain conformation is allowed to change. In contrast, both backbone and side-chain structures are permitted to change during minimization with the AMBER/GBSA force field. We defer the use of the DFIRE potential for optimizing the backbone structures for future studies because the main purpose of this study is to compare the performance of a statistical potential with those of physical-based potentials.
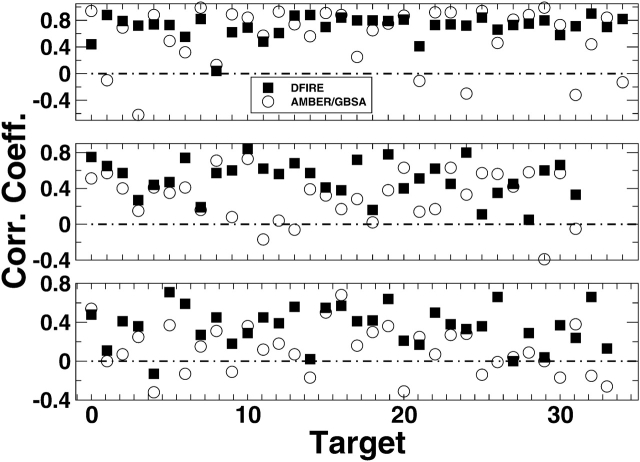
Figure 2 ▶ compares the correlation coefficients between RMSD values and energy scores given by AMBER/GBSA with minimization and by DFIRE with side-chain minimization. The average correlation coefficients for loop lengths at 4, 8, and 12 given by DFIRE are all higher than those given by AMBER/GBSA. This occurs despite the fact that the average RMSD value of the lowest energy decoys given by DFIRE for four-residue loops (0.81 Å) is higher than that given by AMBER/GBSA (0.47 Å). More importantly, the correlations are more stable for DFIRE than for AMBER/GBSA. It is rare for DFIRE to have a negative correlation but is common for AMBER/GBSA. The standard deviation of the correlation coefficients is 0.17 (4-mer), 0.21 (8-mer), and 0.21 (12-mer) for DFIRE but 0.44 (4-mer), 0.27 (8-mer), and 0.25 (12-mer) for AMBER/GBSA. This suggests that DFIRE could perform even better if used directly in conformational search.
Figure 2.
Correlation coefficients between the global RMSD (Å) of all RAPPER loop decoy sets and their energy scores are plotted for individual four-residue (top), eight-residue (middle), and 12-residue (bottom) loop targets. The x-axis is the index number for loop target. The energy scores are calculated by DFIRE potential plus sequential rotamer minimization (filled squares) and minimization using the AMBER/GBSA force field (open circles), respectively. The average correlation coefficients and standard error of 4-, 8-, and 12-mers for DFIRE is 0.7 ± 0.17, 0.5 ± 0.21, and 0.3 ± 0.21, while the corresponding value for AMBER/GBSA is 0.6 ± 0.44, 0.3 ± 0.27, and 0.1 ± 0.25.
Jacobson decoy set
The Jacobson decoy set (2003) is substantially larger than the RAPPER decoy set because it includes not only the loop targets collected by Fiser et al. (2000) but also those by Xiang et al. (2002). (Loop lengths of 2, 3, 11, and 12 collected by Fiser et al. are not included for the reasons described above.) The number of the loop targets for loop lengths between 4 and 12 are listed in Table S1. Each loop target has 200–1400 decoys. The quality of decoys is also better than the RAPPER set. The lowest RMSD values of the decoys in the Jacobson decoy set are lower than those in the RAPPER set for the same loop targets. As mentioned above, Jacobson et al. (2003) also provided a filtered loop set to remove errors not caused by energy functions but by, for example, high flexibility, pH, and the presence of ligands and ions. In this decoy set, all native structures and their minimized conformations are not included in loop selection as in the RAPPER set.
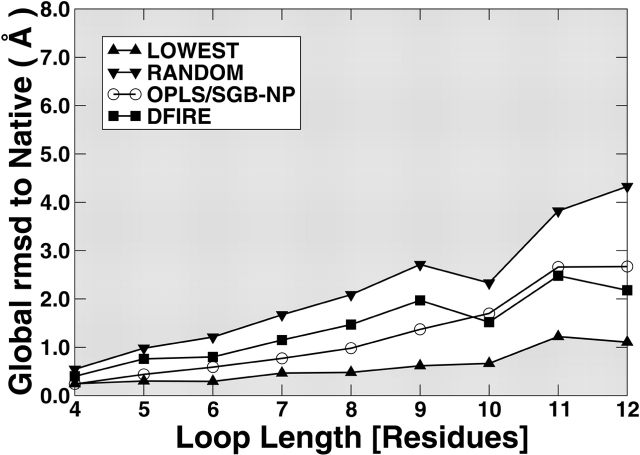
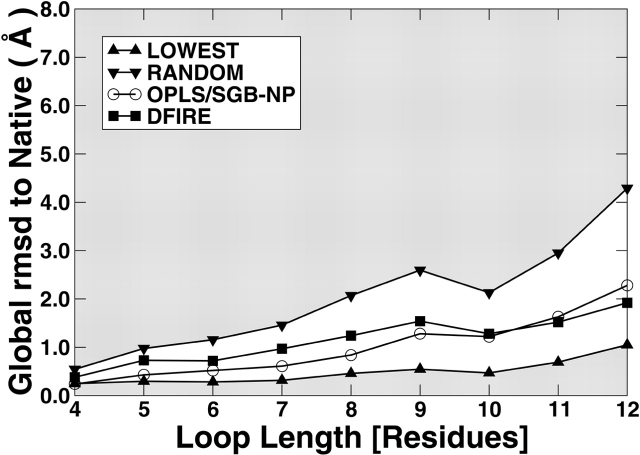
Figure 3 ▶ compares the performance of OPLS/SGB-NP with that of DFIRE on the Jacobson decoy set. The results are also shown in Table S4. For both full and filtered sets, the differences between the two results are mostly less than 0.5 Å. The trend is the same as that observed in the RAPPER decoy set where DFIRE is compared with another physical-based energy function AMBER/GBSA. That is, the performance of DFIRE is worse for short loops (4–10) and better for longer loops (11 and 12). This is not only true for averages but also true for standard deviation (not shown in Fig. 3 ▶ for clarity but is listed in Table S4).
Figure 3.
The average global RMSD (Å) to native structures in selecting near-native loops from the Jacobson decoy set using different scoring functions (as labeled) as a function of loop length. (Up triangles) The best-possible selection (the average of the best RMSD conformers sampled), (down triangles) random selection (average RMSD of all conformers samples), (squares) DFIRE with rotamer minimization, and (circles) OPLS/SGB-NP. The figures in the left and the right are for the full and the filtered decoy sets, respectively.
Dependence on sampling
Because both Jacobson and RAPPER decoy sets contain the loop targets collected by Fiser et al. (2000), it is possible to compare the dependence of performance on the quality of the decoy set for the same target loop. Table 1 compares the lowest RMSD values, the performance of DFIRE energy functions of filtered decoy sets for the loop targets collected by Fiser et al. (2000). It is clear that the quality of Jacobson decoy set is significantly better than that of RAPPER decoy set because the former has much better near-native decoys (in term of decoys with the lowest RMSD values). Table 1 further indicates that as the quality of decoys improves, the performance of DFIRE potential also improves. The improvement is reflected from the RMSD values of lowest energy decoys and the correlation coefficients between RMSD values and energy scores. For example, the prediction accuracy improves from 2.39 Å to 1.33 Å as the quality of the best decoys improves from 1.28 Å to 0.62 Å for the nine-residue loop targets.
Table 1.
Comparison of the performance of DFIRE for the filtered loop targets by Fiser et al. (2000) contained in RAPPER and Jacobson decoy sets
| Lowest rmsd (Å)a | rmsd (Å)b | Corr. coeff.c | ||||
| Loop length | RAPPER | Jacobson | RAPPER | Jacobson | RAPPER | Jacobson |
| 4 | 0.43 ± 0.24 | 0.25 ± 0.11 | 0.79 ± 0.45 | 0.38 ± 0.24 | 0.70 ± 0.17 | 0.52 ± 0.46 |
| 5 | 0.50 ± 0.29 | 0.24 ± 0.08 | 0.93 ± 0.44 | 0.44 ± 0.36 | 0.62 ± 0.24 | 0.63 ± 0.43 |
| 6 | 0.68 ± 0.29 | 0.29 ± 0.23 | 1.26 ± 0.75 | 0.70 ± 0.77 | 0.50 ± 0.22 | 0.65 ± 0.25 |
| 7 | 0.73 ± 0.25 | 0.28 ± 0.11 | 1.37 ± 0.83 | 0.79 ± 0.71 | 0.56 ± 0.22 | 0.58 ± 0.37 |
| 8 | 1.05 ± 0.47 | 0.43 ± 0.30 | 1.80 ± 0.96 | 1.03 ± 0.98 | 0.57 ± 0.17 | 0.64 ± 0.32 |
| 9 | 1.28 ± 0.56 | 0.62 ± 0.74 | 2.39 ± 1.10 | 1.33 ± 1.59 | 0.40 ± 0.22 | 0.59 ± 0.40 |
| 10 | 1.59 ± 0.59 | 0.33 ± 0.19d | 3.25 ± 1.59 | 0.77 ± 0.59d | 0.30 ± 0.25 | 0.61 ± 0.24d |
a The lowest rmsd values and standard deviations of decoys are collected for each target loop and averaged for a given loop length.
b The rmsd values of the lowest energy decoys are collected for each target loop and averaged for a given loop length. The standard deviations are also shown.
c The correlation coefficients between rmsd and energy scores are collected for each target loop and averaged for a given loop length. The standard deviations are also shown.
d Results for the incomplete online decoy set.
Forrest-Woolf decoy set
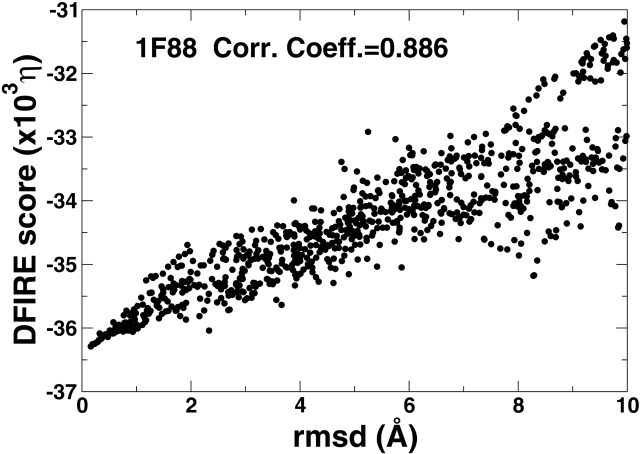
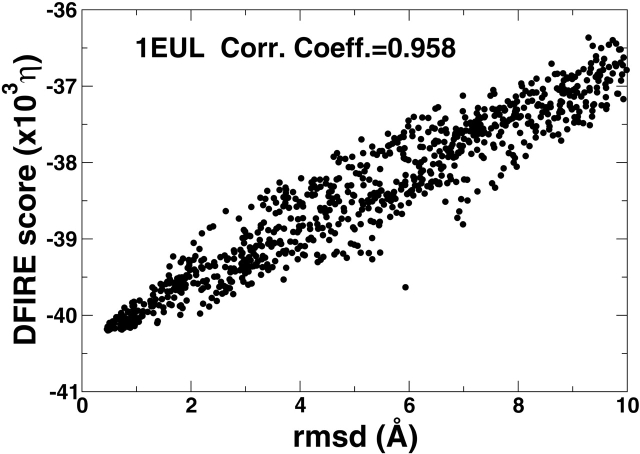
The Forrest-Woolf decoy set (2003) is more like a decoy set for monomeric proteins because its decoys are not limited to the conformational change of a single loop. Rather, all designated loops are subjected to conformational changes. (The lengths of the designated loops range from 5 to 38). The conformations of the decoys were generated evenly from RMSD values of 0 to 10 Å by denaturing the designated loop regions with various techniques. The decoy set was built for two membrane proteins (1F88, Rhodopsin, and 1EUL, Ca2+-ATPase). The rhodopsin set contains 911 decoys and the Ca2+-ATPase set has 909 decoys. Because this decoy set has conformational change in multiple loops, no rotamer side-chain minimization is performed when using the DFIRE energy function.
Figure 4 ▶ compares the RMSD value of decoys with the DFIRE energy scores for the two proteins. The significant correlations between RMSD values and the energy scores exist for both proteins(r = 0.89 for 1F88 and 0.96 for 1EUL). This indicates that the Forrest-Woolf decoy set is an easy set for the DFIRE energy function. For comparison, the correlation coefficients from various CHARMM-based force fields range from −0.27 to 0.64 for 1F88 and from 0.37 to 0.81 for 1EUL. More detail can be found in Table S5.
Figure 4.
The energy score of a decoy as a function of its RMSD value for rhodopsin (1F88, left) and Ca2+-ATPse (1EUL, right).
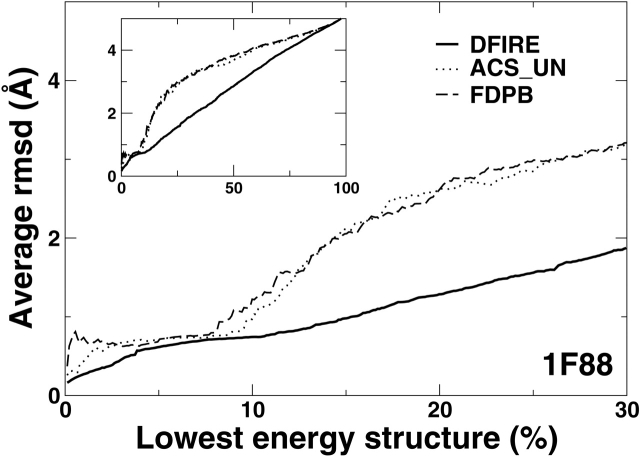
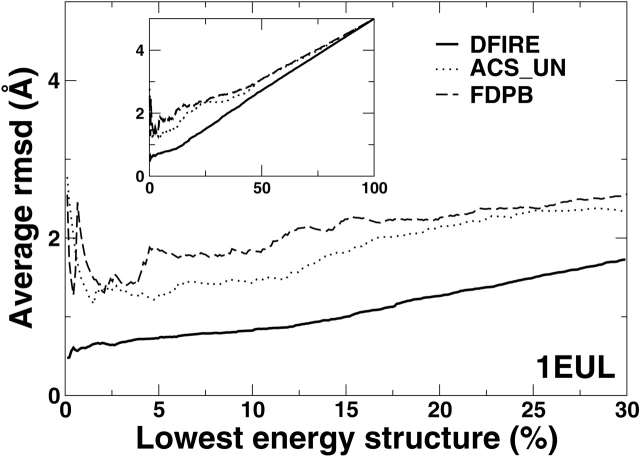
Another way to analyze the performance of energy function, developed by Forrest and Woolf is to obtain the average RMSD values as a function of the percent of lowest energy structures (Fig. 5 ▶). This is done by ranking structures according to energy scores and by averaging the RMSD values of the structures as numbers of the low-energy structures are added. An ideal energy function should produce a curve with the lowest average RMSD value at close to 0% of lowest energy structures. The curve should monotonically increase as the percent of lowest energy structures increases (i.e., no high RMSD structures with low energies).
Figure 5.
Average RMSD values of decoys as a function of the percent of lowest energy structures (see text) for the rhodopsin (left) and Ca2+-ATPse (right). Decoys are first sorted by energy scores. The average RMSD starts from the lowest energy structure (near 0% of the lowest energy structures) and the RMSD value of the next lowest energy structure is put in average as the percent of lowest energy structures increases. The insets show the plots over the whole range up to 100%. The results for the DFIRE potential is shown in the solid lines. Other energy functions as labeled. See text for details.
Figure 5 ▶ shows that the average RMSD curves of DFIRE energy functions are well behaved for both proteins. That is, both curves are a near monotonic increasing function of the percent of lowest energy structures with the lowest RMSD value at near 0%. The results of DFIRE are compared with the results of several physical-based energy functions obtained by Forrest and Woolf. These physical-based energy functions are the combination of CHARMM with various solvation models denoted by FDPB (Brooks et al. 1983), ACS UN (Schaefer et al. 1998), DDD + EEF1_UN (Lazaridis and Karplus 1999), DDD + ASP_UN (Forrest and Woolf 2003), DDD_UN (Brooks et al. 1983), and VAC_UN (Brooks et al. 1983). (Here, FDPB denotes finite-difference Poisson Boltzmann, ACS, Analytical continuum solvent model, UN, uncharged neutral ionic residues, DDD, the distance-dependent dielectric constant, ASP, the atomic solvation parameters, EEF, effective energy function, VAC, CHARMM vacuum energy function). For clarity, only the results of FDPB and ACS_UN are shown. For rhodopsin, only FDPB and ACS_UN are successful in selecting near-native conformation with smallest RMSD at start and a monotonic increase as percent of lowest energy structures increases. For Ca2+-ATPase, no CHARMM-based methods were successful. The RMSD values of the lowest energy decoy given by the CHARMM based methods are more than 2 Å.
Discussion
The DFIRE-based statistical potential is a more physically accurate potential than other all-atom statistical potentials because the potential satisfies the physical requirement that the same water-mediated interaction between amino acid residues is responsible for folding and binding (Liu et al. 2004). This semiphysical DFIRE potential is tested for selecting near-native structures among three loop decoy sets (two soluble and one membrane protein sets). The DFIRE results are compared to earlier results given by several physical-based energy functions equipped with sophisticated implicit solvation models. The comparison indicates that the accuracy of the loop conformations selected by this statistical potential is slightly worse than those of physical-based energy functions for short loops. The difference, however, is smaller than 0.5 Å RMSD difference. More importantly, the DFIRE potential is more accurate for long loops (more than nine residues). This result is understandable because physical-based potentials were built on quantum calculations and parameter optimizations of short peptides, whereas the DFIRE-potential was extracted from the structures of full-sized proteins. This work suggests that a statistical potential with an appropriate reference state can be as accurate as (or more accurate than) physical-based potentials at the atomic level of details. This is true despite the fact that there is no explicit treatment of electrostatic and hydrogen-bonding interactions and solvation effects.
The performance of the DFIRE energy function is strongly dependent on the quality of decoy sets. Although the quality of RAPPER decoy set is very good particularly for short loops (the average lowest RMSD values of the decoys for four- to nine-residue loops range 0.42–1.28 Å), the DFIRE energy function performs significantly better with a higher quality Jacobson decoy set (the average lowest RMSD values of the decoys for four- to nine-residue loops range 0.25–0.62 Å). This suggests that the sampling should be done as accurate as possible, in particular, near the native structure. Thus, an accurate conformational sampling continues to be a challenging task, particularly for long loops. On the other hand, this may suggest the limitation of applying DFIRE potential to the decoy sets made by other force fields because a low-RMSD structure sampled by other methods may not be an optimal structure for the DFIRE potential. We are currently employing DFIRE in direct sampling of loop conformations. This will allow us to produce a self-contained, fast, and accurate prediction of loop conformations. The remarkable performance of the DFIRE potential for loop selections is important because the computational cost of a statistical potential is only a fraction of what is needed for physical-based energy functions with implicit solvation models.
Materials and methods
DFIRE-based potential
The derivation of equations, the method for extracting the DFIRE-based potential using a structure database as well as the resulting potential have been described or obtained previously (Zhou and Zhou 2002). Here, we give a brief summary for completeness.
The atom–atom potential of mean force ū(i,j,r) between atom types i and j that are distance r apart is given by Zhou and Zhou (2002)
 |
(1) |
where η = 0.0157, R is the gas constant, T = 300 K, α = 1.61, Nobs(i, j, r) is the number of (i,j) pairs within the distance shell r observed in a given structure database, rcut = 14.5 Å, and Δr(Δrcut) is the bin width at r(rcut). (Δr = 2 Å, for r < 2 Å; Δr = 0.5 Å for 2 Å < r < 8 Å; Δr = 1 Å for 8 Å < r < 15 Å.) The η prefactor was determined so that the regression slope between the predicted and experimentally measured changes of stability due to mutation (895 data points) is equal to 1.0. The exponent α for the distance dependence was obtained from the distance dependence of the number of pairs of ideal gas points in finite spheres (finite ideal-gas reference state). Residue specific atomic types were used (167 atomic types) (Samudrala and Moult 1998; Lu and Skolnick 2001). The number of observed atomic (i, j) pairs with the distance shell r [Nobs(i, j, r)] was obtained from a structural database of 1011 nonhomologous (less than 30% homology) proteins with resolution <2 Å, which was collected by Hobohm et al. (1992) (http://chaos.fccc.edu/research/labs/dunbrack/culledpdb.html). This database provides sufficient statistics for most distance bins (except near the hard repulsive van der Waals regions between atoms). The average number of observed atomic pairs per bin is 655. The sufficiency of statistics is also reflected from the fact that the results for structural discrimination are insensitive to the size of structural database used to generate the potential (Zhou and Zhou 2002).
Side-chain reoptimization
In addition to directly apply the DFIRE-based energy function to decoys, we also minimize the energy by optimizing side-chain conformations with side-chain rotamer library. Only the side chains of the loop regions are subjected to conformational optimization. The optimization method we used is similar to the simple sampling method described by Xiang and Honig (2001; Xiang et al. 2002). Briefly, starting from the initial conformation (the original loop decoy conformation), we minimized the total energy by changing the side-chain conformation one loop residue at a time, with DFIRE potential plus side-chain rotamer library. The side-chain dihedral angle-based rotamer library is obtained from Dunbrack Jr. and Cohen (1997) (http://dunbrack.fccc.edu/bbdep). We choose a rotamer as the side-chain conformation of the residue if the total energy of the whole protein with this rotamer is at a minimum. In each step, the optimal side-chain conformation for each residue is located sequentially from the first to the last residue in each loop. The total energy at each step is then evaluated. The iteration continues if the total energy is equal to or less than that of the previous step. The total energies are considered as the same if their difference is smaller than 0.1%. This method is simple and computationally efficient.
Structure selections from decoys
For a given conformation of a loop, the total residue–residue potential of mean force, G, is
 |
(2) |
In structure selections from decoy sets, the total free energy G is calculated for each structure with DFIRE potential. The global RMSD value (see below) of the decoy that has the lowest energy is recorded. The performance of an energy function is analyzed by the average RMSD values of the lowest energy decoys for different target loops at a given loop length.
Local RMSD versus global RMSD
The backbone heavy atoms (N, Cα, C, O) are used to calculate the RMSD of loops. The local RMSD is the RMSD value by aligning the loop region only. The global RMSD is calculated from the loop region but by aligning the proteins except the loop region. In general, the local RMSD is smaller than the global RMSD. In this manuscript, we use global RMSD only because a global RMSD value contains the information of the orientation of the target loop relative to the rest of the protein.
Acknowledgments
We gratefully thank Prof. Tom L. Blundell, Dr. Paul I. W. de Bakker, and Dr. Mark A. DePristo for the RAPPER loop decoys sets and their published data, Prof. Matthew P. Jacobson for providing us with his comprehensive loop decoy sets and his paper prior to its publication, and Prof. Thomas B. Woolf and Dr. Lucy R. Forrest for the membrane protein loop decoy set and the data for their Figure 10. We are also indebted to Dr. Paul I. W. de Bakker, Prof. Matthew P. Jacobson, Dr. Lucy R. Forrest and Prof. Thomas B. Woolf for many useful discussions. This work was supported by NIH (R01 GM 966049 and R01 GM 068530), a grant from HHMI to SUNY Buffalo, and by the Center for Computational Research and the Keck Center for Computational Biology at SUNY Buffalo.
The publication costs of this article were defrayed in part by payment of page charges. This article must therefore be hereby marked “advertisement” in accordance with 18 USC section 1734 solely to indicate this fact.
Supplemental material: See www.proteinscience.org
Article and publication are at http://www.proteinscience.org/cgi/doi/10.1110/ps.03411904.
References
- Bower, M.J., Cohen, F.E., and Dunbrack Jr., R.L. 1997. Prediction of protein side-chain rotamers from a backbone-dependent rotamer library: A new homology modeling tool. J. Mol. Biol. 267 1268–1282. [DOI] [PubMed] [Google Scholar]
- Brooks, B.R., Bruccoleri, R.E., Olafson, B.D., States, D.J., Swaminathan, S., and Karplus, M. 1983. CHARMM: A program for macromolecular energy, minimization, and dynamics calculations. J. Comput. Chem. 4 187–217. [Google Scholar]
- Brooks III, C.L., Karplus, M., and Pettitt, B.M. 1988. Proteins: A theoretical perspective of dynamics, structure, and thermodynamics. John Wiley & Sons, New York.
- Bruccoleri, R.E. and Karplus, M. 1987. Prediction of the folding of short polypeptide segments by uniform conformational sampling. Biopolymers 26 137–168. [DOI] [PubMed] [Google Scholar]
- Burke, D.F. and Deane, C.M. 2001. Improved protein loop prediction from sequence alone. Protein Eng. 14 473–478. [DOI] [PubMed] [Google Scholar]
- Burke, D.F., Deane, C.M., and Blundell, T.L. 2000. Browsing the sloop database of structurally classified loops connecting elements of protein secondary structure. Bioinformatics 16 513–519. [DOI] [PubMed] [Google Scholar]
- Chothia, C., Lesk, A.M., Levitt, M., Amit, A.G., Mariuzza, R.A., Phillips, S.E., and Poljak, R.J. 1986. The predicted structure of immunoglobulin D1.3 and its comparison with the crystal structure. Science 233 755–758. [DOI] [PubMed] [Google Scholar]
- Cohen, B.I., Presnell, S.R., and Cohen, F.E. 1993. Origins of structural diversity within sequentially identical hexapeptides. Protein Sci. 2 2134–2145. [DOI] [PMC free article] [PubMed] [Google Scholar]
- Deane, C.M. and Blundell, T.L. 2001. Coda: A combined algorithm for predicting the structurally variable regions of protein models. Protein Sci. 10 599–612. [DOI] [PMC free article] [PubMed] [Google Scholar]
- de Bakker, P.I.W., Depristo, M.A., Burke, D.F., and Blundell, T.L. 2003. Ab initio construction of polypeptide fragments: Accuracy of loop decoy discrimination by an all- atom statistical potential and the amber force field with the generalized born solvation model. Proteins 51 21–40. [DOI] [PubMed] [Google Scholar]
- DePristo, M.A., de Bakker, P.I., Lovell, S.C., and Blundell, T.L. 2003. Ab initio construction of polypeptide fragments: Efficient generation of accurate, representative ensembles. Proteins 51 41–55. [DOI] [PubMed] [Google Scholar]
- Donate, L.E., Rufino, S.D., Canard, L.H.J., and Blundell, T.L. 1996. Conformational analysis and clustering of short and medium size loops connecting regular secondary structures. A database for modeling and prediction. Protein Sci. 5 2600–2616. [DOI] [PMC free article] [PubMed] [Google Scholar]
- Dunbrack Jr., R.D. and Cohen, F.E. 1997. Bayesian statistical analysis of protein sidechain rotamer preferences. Protein Sci. 6 1661–1681. [DOI] [PMC free article] [PubMed] [Google Scholar]
- Fine, R.M., Wang, H., Shenkin, P.S., Yarmush, D.L., and Levinthal, C. 1986. Predicting antibody hypervariable loop conformations. II: Minimization and molecular dynamics studies of MCPC603 from many randomly generated loop conformations. Proteins 1 342–362. [DOI] [PubMed] [Google Scholar]
- Fiser, A., Do, R.K.G., and Sali, A. 2000. Modeling of loops in protein structures. Protein Sci. 9 1753–1773. [DOI] [PMC free article] [PubMed] [Google Scholar]
- Forrest, L.R. and Woolf, T.B. 2003. Discrimination of native loop conformations in membrane proteins: Decoy library design and evaluation of effective energy scoring functions. Proteins 52 492–509. [DOI] [PubMed] [Google Scholar]
- Galaktionov, S., Nikiforovich, G.V., and Marshall, G.R. 2001. Ab initio modeling of small, medium, and large loops in proteins. Biopolymers 60 153–168. [DOI] [PubMed] [Google Scholar]
- Gallicchio, E., Zhang, L.Y., and Levy, R.M. 2002. The SGB/NP hydration free energy model based on the surface generalized Born solvent reaction field and novel nonpoloar hydration free energy estimators. J. Comp. Chem. 23 517–529. [DOI] [PubMed] [Google Scholar]
- Glaser, F., Sternberg, D., Vasker, I., and Ben-Tal, N. 2001. Residue frequencies and pairing preferences at protein–protein interfaces. Proteins 43 89–102. [PubMed] [Google Scholar]
- Greer, J. 1980. Model for haptoglobin heavy chain based upon structural homology. Proc. Natl. Acad. Sci. 77 3393–3397. [DOI] [PMC free article] [PubMed] [Google Scholar]
- Hobohm, U., Scharf, M., Schneider, R., and Sander, C. 1992. Selection of representive protein data sets. Protein Sci. 1 409–417. [DOI] [PMC free article] [PubMed] [Google Scholar]
- Jacobson, M.P., Pincus, D.L., Day, T.J.F., Rapp, C.S., Li, X., An, Y., and Friesner, R.A. 2003. A hierarchical approach to all-atom loop prediction. Proteins (in press). [DOI] [PubMed]
- Jorgensen, W.L., Maxwell, D.S., and Tirado-Rives, J. 1996. Development and testing of the OPLS all-atom force field on conformational energetics and properties of organic liquids. J. Am. Chem. Soc. 118 11225–11236. [Google Scholar]
- Kabsch, W. and Sander, C. 1985. Identical pentapeptides with different backbones. Nature 317 207. [DOI] [PubMed] [Google Scholar]
- Kaminski, G.A., Friesner, R.A., Tirado-Rives, J., and Jorgensen, W.L. 2001. Evaluation and reparametrization of the OPLS-AA force field for proteins via comparison with accurate quantum chemical calculations on peptides. J. Phys. Chem. B 105 6474–6487. [Google Scholar]
- Lazaridis, T. and Karplus, M. 1999. Effective energy function for proteins in solution. Proteins 35 133–152. [DOI] [PubMed] [Google Scholar]
- Liu, S., Zhang, C., Zhou, H., and Zhou, Y. 2004. A physical reference state unifies the structure-derived potential of mean force for protein folding and binding. Proteins (in press). [DOI] [PubMed]
- Lu, H. and Skolnick, J. 2001. A distance-dependent atomic knowledge-based potential for improved protein structure selection. Proteins 44 223–232. [DOI] [PubMed] [Google Scholar]
- Lu, H., Lu, L., and Skolnick, J. 2003. Development of unified statistical potentials describing protein–protein interactions. Biophys. J. 84 1895–1901. [DOI] [PMC free article] [PubMed] [Google Scholar]
- Mart-Renom, M.A., Stuart, A., Fiser, A., Sánchez, R., Melo, F., and Sali, A. 2000. Comparative protein structure modeling of genes and genomes. Annu. Rev. Biophys. Biomol. Struct. 29 291–325. [DOI] [PubMed] [Google Scholar]
- Mezei, M. 1998. Chameleon sequences in the PDB. Protein Eng. 11 411–414. [DOI] [PubMed] [Google Scholar]
- Moont, G., Gabb, H., and Sternberg, M. 1999. Use of pair potentials across protein interfaces in screening predicted docked complexes. Proteins 35 364–373. [PubMed] [Google Scholar]
- Moult, J. and James, M.N.G. 1986a. An algorithm for determining the conformation of polypeptide segments in proteins by systematic search. Proteins 2 146–163. [DOI] [PubMed] [Google Scholar]
- ———. 1986b. An algorithm which predicts the conformation of short lengths of chain in proteins. J. Mol. Graphics 4 180. [Google Scholar]
- Ofran, Y. and Rost, B. 2003. Analysing six types of protein–protein complexes. J. Mol. Biol. 325 377–387. [DOI] [PubMed] [Google Scholar]
- Oliva, B., Bates, P.A., Querol, E., Aviles, F.X., and Sternberg, M.J.E. 1997. An automated classification of the structure of protein loops. J. Mol. Biol. 266 814–830. [DOI] [PubMed] [Google Scholar]
- Qiu, D., Shenkin, P.S., Hollinger, F.P., and Still, W.C. 1997. The GB/SA continuum model for solvation. A fast analytical method for the calculation of approximate Born radii. J. Phys. Chem. A 101 3005–3014. [Google Scholar]
- Rapp, C.S. and Friesner, R.A. 1999. Prediction of loop geometries using a generalized Born model of solvation effects. Proteins 35 173–183. [PubMed] [Google Scholar]
- Rufino, S.D., Donate, L.E., Canard, L.H.J., and Blundell, T.L. 1997. Predicting the conformational class of short and medium size loops connecting regular secondary structures: Application to comparative modeling. J. Mol. Biol. 267 352–367. [DOI] [PubMed] [Google Scholar]
- Samudrala, R. and Moult, J. 1998. An all-atom distance-dependent conditional probability discriminatory function for protein structure prediction. J. Mol. Biol. 275 895–916. [DOI] [PubMed] [Google Scholar]
- Schaefer, M., Bartels, C., and Karplus, M. 1998. Solution conformations and thermodynamics of structured peptides: Molecular dynamics simulation with an implicit solvation model. J. Mol. Biol. 284 835–848. [DOI] [PubMed] [Google Scholar]
- Schonbrun, J., Wedemeyer, W., and Baker, D. 2002. Protein structure prediction in 2002. Curr. Opin. Struct. Biol. 12 348–354. [DOI] [PubMed] [Google Scholar]
- Scott, W.R.P., Hunenberger, P.H., Tironi, I.G., Mark, A.E., Billeter, S.R., Fennen, J., Torda, A.E., Huber, T., Kruger, P., and van Gunsteren, W.F. 1999. The GROMOS biomolecular simulation program package. J. Phys. Chem. A 103 3596–3607. [Google Scholar]
- Sippl, M.J. 1990. Calculation of conformational ensembles from potentials of mean force. An approach to the knowledge-based prediction of local structures in globular proteins. J. Mol. Biol. 213 859–883. [DOI] [PubMed] [Google Scholar]
- Swindells, M.B., MacArthur, M.W., and Thornton, J.M. 1995. Intrinsic φ, ψ propensities of amino acids, derived from the coil regions of known structures. Nat. Struct. Biol. 2 596–603. [DOI] [PubMed] [Google Scholar]
- Tanaka, S. and Scheraga, H.A. 1976. Medium- and long-range interaction parameters between amino acids for predicting three-dimensional structures of proteins. Macromolecules 9 945–950. [DOI] [PubMed] [Google Scholar]
- Thomas, P.D. and Dill, K.A. 1996. Statistical potentials extracted from protein structures: How accurate are they? J. Mol. Biol. 257 457–469. [DOI] [PubMed] [Google Scholar]
- van Vlijmen, H.W. and Karplus, M. 1997. PDB-based protein loop prediction: Parameters for selection and methods for optimization. J. Mol. Biol. 267 975–1001. [DOI] [PubMed] [Google Scholar]
- Weiner, S.J., Kollman, P., Nguyen, D., and Case, D. 1986. An all atom force field for simulations of proteins and nucleic acids. J. Comput. Chem. 7 230–252. [DOI] [PubMed] [Google Scholar]
- Xiang, Z. and Honig, B. 2001. Extending the accuracy limits of prediction for side-chain conformations. J. Mol. Biol. 311 421–430. [DOI] [PubMed] [Google Scholar]
- Xiang, Z., Soto, C.S., and Honig, B. 2002. Evaluating conformational free energies: The colony energy and its application to the problem of loop prediction. Proc. Natl. Acad. Sci. 99 7432–7437. [DOI] [PMC free article] [PubMed] [Google Scholar]
- Zhou, H. and Zhou, Y. 2002. Distance-scaled, finite ideal-gas reference state improves structure-derived potentials of mean force for structure selection and stability prediction. Protein Sci. 11 2714–2726 [Corrections 2003. Protein Sci. 12: 2121]. [DOI] [PMC free article] [PubMed] [Google Scholar]
- ———. 2003. Qualifying the effect of burial of amino acid residues on protein stability. Proteins (in press). [DOI] [PubMed]


