Abstract
The α-crystallins, αA and αB, are major lens structural proteins with chaperone-like activity and sequence homology to small heat-shock proteins. As yet, their crystal structures have not been determined because of the large size and heterogeneity of the assemblies they form in solution. Because α-crystallin chaperone activity increases with temperature, understanding structural changes of α-crystallin as it is heated may help elucidate the mechanism of chaperone activity. Although a variety of techniques have been used to probe changes in heat-stressed α-crystallin, the results have not yet yielded a clear understanding of chaperone activity. We report examination of native assemblies of human lens α-crystallin using hydrogen/deuterium exchange in conjunction with enzymatic digestion and analysis by mass spectrometry. This technique has the advantage of sensing structural changes along much of the protein backbone and being able to detect changes specific to αA and αB in the native assembly. The reactivity of the amide linkages to hydrogen/deuterium exchange was determined for 92% of the sequence of αA and 99% of αB. The behavior of αA and αB is remarkably similar. At low temperatures, there are regions at the beginning of the α-crystallin domains in both αA and αB that have high protection to isotope exchange, whereas the C termini offer little protection. The N terminus of αA also has low protection. With increasing temperatures, both proteins show gradual unfolding. The maximum percent change in exposure with increasing temperatures was found in αA 72–75 and αB 76–79, two regions considered critical for chaperone activity.
Keywords: Human lens, α-crystallins, conformation, mass spectrometry, cataract
α-Crystallins are major structural proteins of the ocular lens that exhibit chaperone-like activity in preventing the aggregation of denatured proteins (Horwitz 1992; Derham and Harding 1999). There are two α-crystallin gene products, αA and αB, with molecular masses of 19,952 D and 20,201 D, respectively. These two proteins form large macromolecular assemblies of 700–800 kD (Derham and Harding 1999) with an approximate ratio in human lenses of 3 : 2 for αA:αB, with some age and lens variation (Swamy and Abraham 1991; Miesbauer et al. 1994; Ma et al. 1998). As the lens ages, α-crystallins experience posttranslation modifications, many of which occur within the first two decades of life (Datiles et al. 1992; Lampi et al. 1998; Ma et al. 1998). The large size and heterogeneity of α-crystallins have so far prevented determination of an X-ray crystallographic structure.
Despite the lack of high-resolution structures, a working model of the structure of α-crystallin assemblies has emerged from information obtained by a variety of low-resolution techniques. These data suggest that α-crystallin has a compact globular form with considerable flexibility (Chiou and Azari 1989). The quaternary structure varies with solution and storage conditions (Vanhoudt et al. 2000) with free exchange of the subunits (van den Oetelaar et al. 1990; Bova et al. 1997; Datta and Rao 2000). Based on exon structure, Wistow proposed a two-domain structure for α-crystallin with N-terminal domains including residues 1–63 for both αA and αB and C-terminal domains of residues 64–173 for αA and residues 64–175 for αB (Wistow 1985). Spin labeling data showed that the residues at the beginning of the C-terminal domain, form a loop that lacks accessibility, followed by three β-strands (Berengian et al. 1997; Koteiche et al. 1998). The beginning of the C-terminal domain includes segments in both αA and αB that have demonstrated chaperone-like activity in isolation (Sharma et al. 2000; K.K. Sharma, pers. comm.). The C-terminal domain has high sequence homology with heat-shock proteins (Caspers et al. 1995) and includes the subunit binding region of the α-crystallin assembly (Berengian et al. 1997; Mchaourab et al. 1997). The last eight residues of αA and 10 residues of αB, which have sufficient flexibility to be detected by NMR (Carver et al. 1992), are referred to as the C-terminal extensions.
Structural changes associated with increasing α-crystallin chaperone activity as the temperature is raised are of particular interest to understanding α-crystallin activity (Das et al. 1997; Lee et al. 1997; Raman and Rao 1997). Depending on the technique used to examine α-crystallins, some studies show little change with heating (Maiti et al. 1988; Carver et al. 1993; Farnsworth et al. 1997; Burgio et al. 2001), some show greater heat-induced changes in αB (Datta and Rao 1999; Liang et al. 2000), whereas others show greater changes in αA (Reddy et al. 2000).
Even though the native α-crystallin assembly is a more stable structure than homopolymers of either αA or αB (Abgar et al. 2000; Burgio et al. 2001) and responds to heat stress differently from the homopolymers (Carver et al. 1993; Abgar et al. 2000; Burgio et al. 2001), nonphysiological homopolymers of isolated αA and αB-crystallins have been studied most often because the analytical methods do not distinguish between signals from αA and αB. These data show that homopolymers of αB are better chaperones than those of αA at physiological temperatures at which αB has more surface hydrophobicity, whereas αA becomes the better chaperone at higher temperatures, as more hydrophobic sites of αA become exposed (Datta and Rao 1999; Reddy et al. 2000). This correlation between chaperone activity and exposed hydrophobicity supports the proposal that chaperone activity depends on exposure of hydrophobic regions (Raman and Rao 1994; Das and Surewicz 1995; Smulders and de Jong 1997). Whether αA and αB behave similarly in the native α-crystallin assemblies is not known.
To obtain information about structural changes of native α-crystallin as it is heated, we have used hydrogen/deuterium (H/D) exchange coupled with enzymatic digestion and mass spectrometry (Engen and Smith 2001). The exchange rates of amide hydrogens depend on their solvent exposure and intramolecular hydrogen bonding. With this technique, α-crystallins isolated under nearly physiological conditions can be examined. When H/D exchange is coupled with enzymatic digestion, isotope exchange of amide hydrogens along the entire backbone of the molecule is measured. Furthermore, because the molecular masses are specific to either αA or αB, signals from αA and αB in the native aggregate can be readily distinguished. The observed increase in H/D exchange over a temperature range of 27°C to 57°C indicated a gradual unfolding of the entire backbones of both αA and αB in the native α-crystallin assemblies. The largest percentage increases in H/D exchange were in peptides 72–75 of αA and peptides 76–79 of αB, two regions thought to be critical to chaperone activity.
Results
Analysis of intact protein
The soluble α-crystallins isolated from a normal 19-year-old lens by size exclusion chromatography included the two gene products, αA- and αB-crystallins, as well as low levels of several modified forms (Miesbauer et al. 1994). The most abundant modified forms include αA that has lost the C-terminal Ser (designated here as αA-S) and αB that has one serine residue phosphorylated (αB + P). This mixture of native α-crystallins was exposed to D2O at various times and temperatures (37°–57°C). As will be discussed later, the exposure times were chosen to offset the temperature dependence of the rate constant for intrinsic hydrogen exchange. Isotope exchange was effectively stopped by acidifying the samples and decreasing the temperature to 0°C. The labeled protein was analyzed by HPLC electrospray ionization mass spectrometry (ESIMS) to determine the deuterium levels in the intact protein.
The experimental procedures used in this study were designed to detect thermal-induced structural changes in the folded structures of the α-crystallins, which may be detected as changes in deuterium levels. The relationship between hydrogen exchange rates and protein structure when exchange is dominated by EX2 kinetics is indicated by equation 1:
 |
(1) |
where kHX is the rate constant for hydrogen exchange at individual peptide amide linkages, KU is the equilibrium constant for partial or total unfolding of the protein, β is a probability for exchange from the folded protein, and kint is the rate constant for hydrogen exchange in an unfolded polypeptide (Kim and Woodward 1993; Engen et al. 1999a). The goal of this study was to detect thermal-induced changes in the sum of KU + β. Although no evidence for EX1 kinetics was found, it is possible that some exchange occurred through this mechanism. The temperature dependence of kint confounds these measurements. However, because of the reciprocity in labeling time and kint, specific labeling times can be used to offset the temperature dependence of kint (Bai et al. 1993; Wang et al. 2001). For example, kint increases by a factor of 5.6 when the temperature is increased from 37°C to 57°C. To compensate for this change, the labeling time at 37°C was increased by the same factor. This procedure, which facilitates direct comparison of deuterium levels found for labeling at different temperatures, has been discussed previously (Zhang and Smith 1993; Wang et al. 2001).
Mass spectra of the α-crystallins labeled under different conditions are presented in Figure 1 ▶. To ensure representation of all structural forms of α-crystallin, these spectra were summed over the entire HPLC elution time for the α-crystallins. The mass spectrum of α-crystallins that were not exposed to D2O (i.e., the 0% reference) gives four peaks (Fig. 1A ▶). The two largest peaks are due to unmodified αA- and αB-crystallins, whereas the two minor peaks are due to αA-S and αB + P. The molecular masses found for these proteins are within ±2 D of the expected values. The mass spectrum of α-crystallins exposed to D2O at 37°C for 112 sec (Fig. 1B ▶) shows the same four peaks, but with increased molecular masses. For example, the mass of αA-crystallin has increased from 19,950 to 20,044. This increase of 94 D indicates that it has exchanged 94 hydrogens for deuteriums. Mass spectra of α-crystallins completely exchanged in D2O (i.e., the 100% reference) indicate even higher levels of deuterium (Fig. 1C ▶). The difference between the molecular mass of completely exchanged αA-crystallin (20,090 D) and α-crystallin that was not exposed to D2O (see Fig. 1A ▶) shows that there were 140 deuteriums present at peptide amide linkages when the protein reached the mass spectrometer. Note that deuterium located at the C termini, as well as deuterium in the side chains, was lost during the HPLC step (Englander et al. 1985; Zhang and Smith 1993). The number of deuteriums found is less than the number of amide hydrogens, 161, because labeling was performed in 95% D2O and because some amide deuterium was lost during HPLC. Similar results were found for the other forms of α-crystallin.
Figure 1.
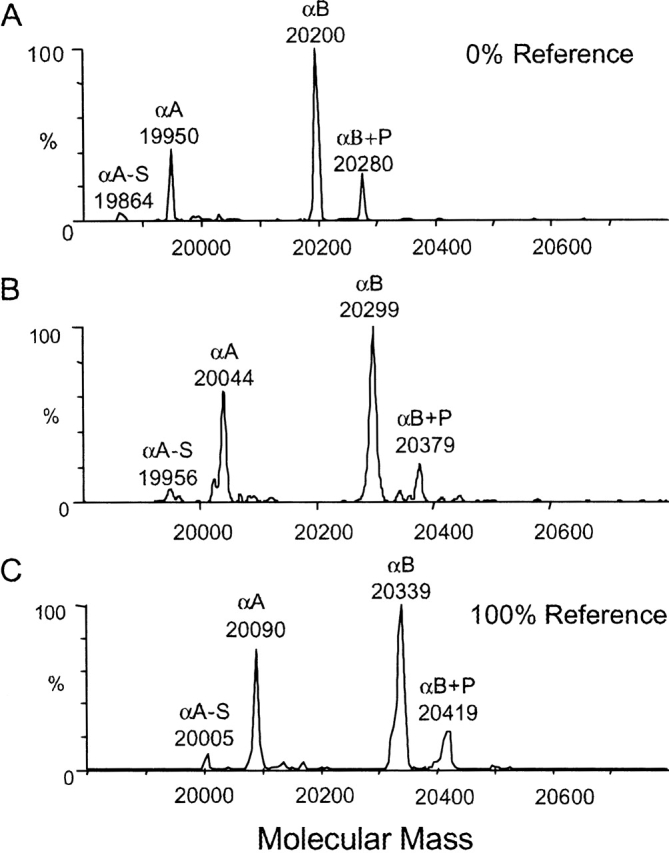
HPLC ESI mass spectra of α-crystallins labeled with deuterium under different conditions. (A) No exposure to D2O. (B) Exposed to D2O at 37°C for 112 sec. (C) Completely exchanged in 95% D2O. αA-S and αB + P refer to αA that has lost the C-terminal Ser and phosphorylated αB, respectively.
A wide range of labeling times was used to increase the probability of detecting localized structural changes because the hydrogen exchange rates at peptide linkages in folded proteins often span a range of 106 to 108. If only one labeling time were used, some structural changes that substantially affect hydrogen exchange rates would not have been detected. That is, a change in hydrogen exchange rate gives a detectable change in deuterium level only when the half-life for exchange is comparable to the labeling time. The various labeling times used in this study are given in Table 1 as t1–t5. Following a strategy used in NMR (Bai et al. 1994), the range of exposure times used in this study corresponds roughly to a range in protection factors of 50–1000. Protection factor is the reduction in amide exchange rate from what it is in an unstructured polypeptide. Thus, amide linkages are silent in the present experiments when the protection factor is less than ~50 or greater than 1000.
Table 1.
Labeling times t1–t5 used for hydrogen exchange at different temperatures
| Labeling time (sec)a | |||||
| Temperature | t1 | t2 | t3 | t4 | t5 |
| 37°C | 28 | 56 | 112 | 224 | 448 |
| 42°C | 18 | 36 | 72 | 144 | 288 |
| 47°C | 12 | 24 | 48 | 96 | 192 |
| 52°C | 8 | 16 | 32 | 64 | 128 |
| 57°C | 5 | 10 | 20 | 40 | 80 |
a The times were chosen to offset the temperature dependence of the intrinsic rates of hydrogen exchange.
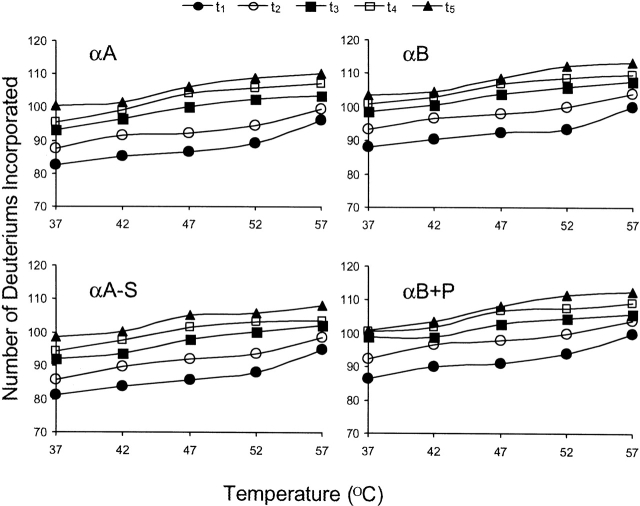
The deuterium levels in the intact proteins of the α-crystallins following exposure of native α-crystallin to D2O for various times and temperatures (Fig. 2 ▶) reveal the thermal stability of αA and αB. Results for the shortest exposure times (t1, protection factor of ~50) are indicated by the solid circles in each panel, whereas results for the longest time (t5, protection factor ~1000) are indicated by the solid triangles. It is evident from these results that deuterium levels in all four structural forms of α-crystallin increased gradually as the temperature was increased, indicating a gradual increase in (KU + β). These results indicate a gradual loosening of structure with no sharp transitions. Results for the modified forms, αA-S and αB + P, were equal within experimental error to those of unmodified αA and αB, indicating that these modifications do not substantially affect the thermal stabilities of the α-crystallin subunits.
Figure 2.
Deuterium levels found in four α-crystallins following exposure to D2O for various times (t1–5) at 37°C, 42°C, 47°C, 52°C, and 57°C. See Table 1 for values of t1–5.
Analysis of peptic fragments of labeled α-crystallins
Detection of structural changes from the deuterium levels of the intact protein is limited by the uncertainty of the measurements. Analysis of five samples, in which each sample was labeled and analyzed independently, showed that the uncertainty in these measurements is two to three deuteriums. Thus, structural changes that altered the deuterium level by less than two to three deuteriums would not be detected. One solution to this limitation is to digest the labeled protein into peptides and determine the deuterium levels in the peptides. Data from the analysis of five peptic peptides from five independent samples showed that the deuterium levels in peptides could be determined with an uncertainty of <0.1 deuterium. In addition to increasing the sensitivity for detecting structural changes that alter the H/D exchange rate, analysis of peptides leads to identification of specific regions undergoing structural change.
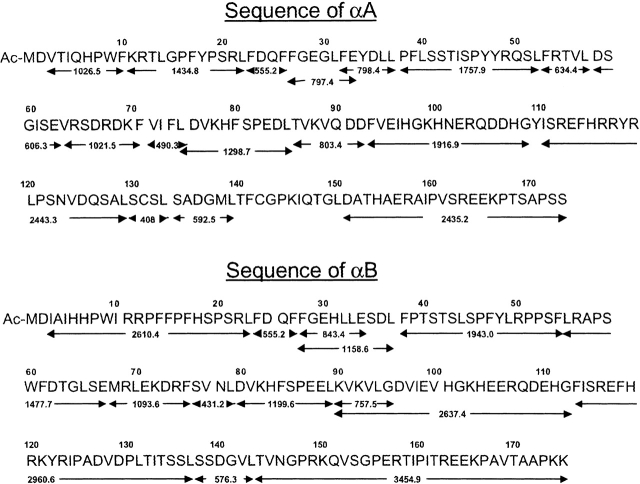
Peptide analyses were initiated by labeling α-crystallin as described above. Following the acid quench step, the protein was digested with pepsin to give fragments that were analyzed by HPLC ESIMS. The number of deuteriums in each peptic fragment was determined from the molecular masses. Digestion with pepsin, which tends to cut before or after hydrophobic residues, gave a large number of fragments. A set of ~25 peptides used in this study was identified by collision induced dissociation mass spectrometry (CID MS/MS). These peptides, as well as the entire amino acid sequences of αA- and αB-crystallin, are illustrated in Figure 3 ▶. Digestion conditions were optimized to give short peptides covering the entire protein backbone under conditions in which deuterium loss was minimal. The peptides used in this study, which cover 92% of αA and 99% of αB, had an average length of 10 residues (range 3–31 residues). These peptides and their monoisotopic masses are shown in Figure 3 ▶.
Figure 3.
Amino acid sequences and peptic fragments of human αA- and αB-crystallin. All peptides were identified by their molecular masses and CID MS/MS. Numbers imbedded in the arrows give the monoisotopic molecular mass of each peptide.
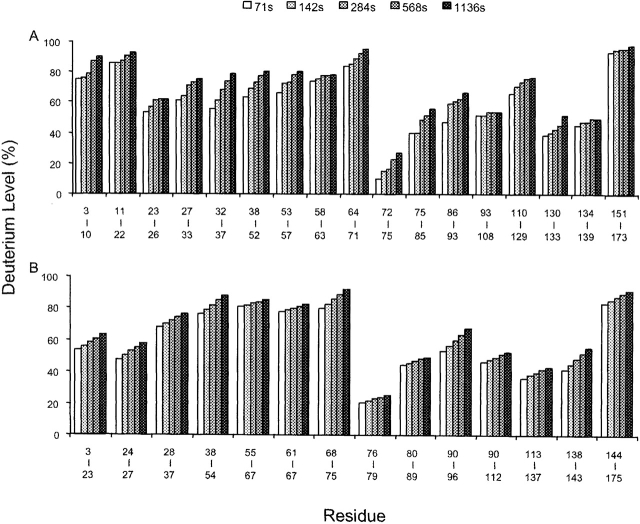
Mass spectra of two peptic fragments, including residues 28–37 (singly charged) and 144–175 (quadruply charged) of αB-crystallin, illustrate how deuterium levels in these segments changed when the intact protein was labeled for different times. Mass spectra of these fragments from α-crystallin that was not exposed to D2O (0% reference) are presented in Figure 4A ▶. The difference in the resolution of isotope peaks for the two peptides is due to the large difference in their molecular masses. The mass spectra of the same fragments when the α-crystallin was exposed to D2O at 27°C for 71 sec (Fig. 4B ▶) or 1136 sec (Fig. 4C ▶) show that their molecular masses have increased. Measured deuterium levels are given in each panel. Mass spectra for these peptides when derived from αB crystallin equilibrated in 95% D2O (100% reference) give the deuterium levels at the time the peptides reached the mass spectrometer (Fig. 4D ▶). These deuterium levels were used along with the number of peptide linkages to determine the number of deuteriums present at the end of labeling. The results presented in Figure 5 ▶ show how hydrogen exchange along the backbones of αA- and αB-crystallins changed with labeling time at 27°C. The deuterium levels, expressed as percent, were determined from the ratio of the deuterium level found at specific times divided by the deuterium level found in the same peptide from the 100% reference sample (as described for Fig. 4D ▶). These results show that the deuterium levels spanned a range of 10%–100% in different parts of the α-crystallin backbones. For example, exchange in the segment including residues 72–75 of αA-crystallin was only 10% complete, whereas exchange in the C-terminal regions including residues 151–173 was nearly 100%. The increased deuterium level in each segment with labeling time (71–1136 sec) is indicated by shading (light to dark). These changes in deuterium levels indicate the distribution of the rates at which H/D exchange occurs within each segment. The deuterium levels found for the shortest time (lightest bars) indicate the fraction of amide hydrogens with protection factors <50. Similarly, the differences between 100% and the deuterium levels found for the longest labeling time (darkest bars) indicate the fraction of amide hydrogens with protection factors greater than ~1000.
Figure 4.
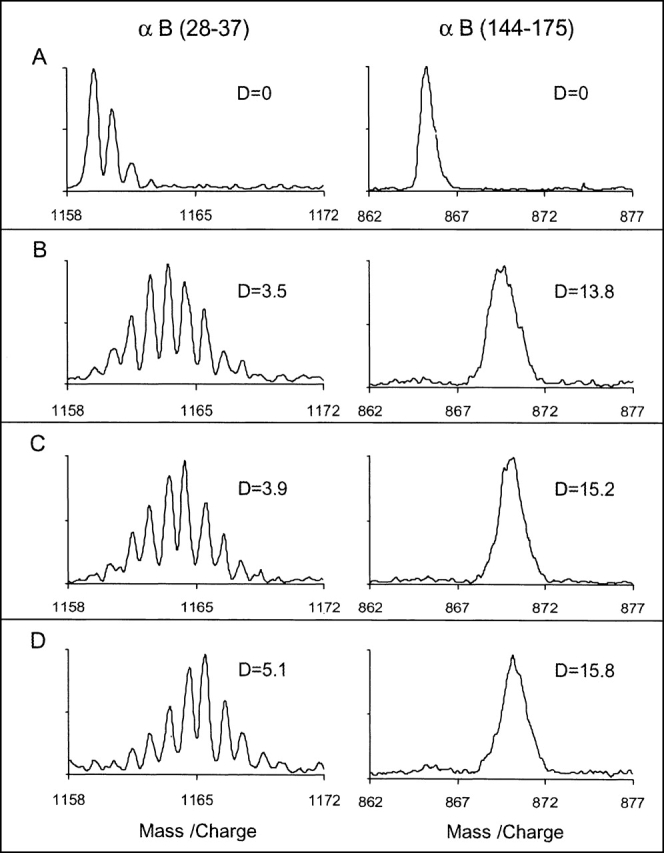
Mass spectra of peptides including residues 28–37 (singly charged) and 144–175 (quadruply charged) of αB-crystallin. (A) No exposure to D2O. (B,C) Exposed to D2O at 27°C for 71 sec and 1136 sec, respectively. (D) Completely exchanged in 95% D2O.
Figure 5.
Deuterium levels found in peptides of αA-crystallin (A) and αB-crystallin (B) following exposure of the native protein to D2O for various times at 27°C. The deuterium levels were normalized to the deuterium levels found in the fragment derived from α-crystallin equilibrated in 95% D2O.
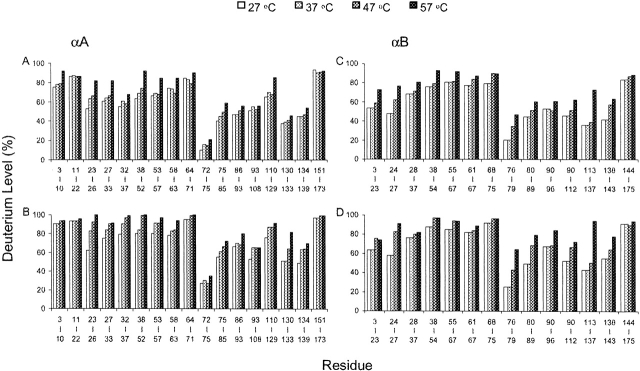
The thermal stability, as sensed by H/D exchange, along the entire backbones of αA- and αB-crystallins is indicated by results presented in Figure 6 ▶. Intact, native α-crystallin was equilibrated and labeled at each temperature. As described above, the labeling time was adjusted to compensate for the temperature dependence of the rate for intrinsic exchange such that changes in deuterium levels reflect changes in protein stability (i.e., KU + β). Deuterium levels found in peptic fragments of αA-crystallin labeled for short times (t1) and long times (t5) are presented in Figure 6 ▶, A and B, respectively. Isotope exchange for these labeling times occurs when the protection factors are >50 (t1) or <1000 (t5). Shading of the bars from light to dark indicates temperatures from 27°C to 57°C. The same format has been used to present results for αB-crystallin in Figure 6 ▶, C and D.
Figure 6.
Deuterium levels found in peptic fragments of α-crystallin following exposure of the intact protein to D2O at different temperatures for different times. (A) αA-Crystallin, short (t1) exposure time. (B) αA-Crystallin, long (t5) exposure time. (C) αB-Crystallin, short (t1) exposure time. (D) αB-Crystallin, long (t5) exposure time. The exposure time used for each temperature was adjusted to compensate for the temperature dependence of the rate of intrinsic hydrogen exchange (see Table 1).
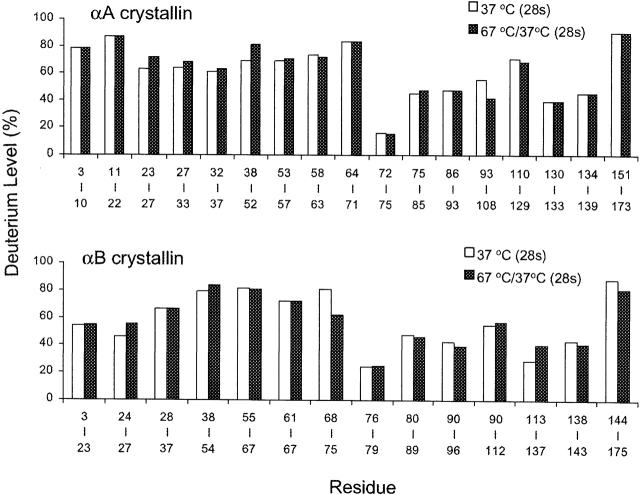
The experiments described above were designed to reveal both reversible and irreversible, thermal-induced structural changes in α-crystallins. Another experiment was designed to detect specifically irreversible, thermal-induced structural changes. Native α-crystallin was heated to 67°C for 30 min, then cooled to 37°C and labeled for 28 sec. A control sample was labeled at 37°C. Both samples were digested and analyzed by HPLC ESIMS as described above. Deuterium levels found in peptic fragments of the control (light bars) and the cycled sample (dark bars) of αA- and αB-crystallins are presented in Figure 7 ▶. There were regions of greater H/D exchange after heating in αA including residues 23–52 and in αB including residues 24–27, 38–54, and 113–137. There were also regions of less H/D exchange after heating in αA 93–129 and αB 68–75, 80–96, and 138–175. These changes indicated that heating caused an irreversible conformational change that involved loosening of some regions and tightening of others.
Figure 7.
Deuterium levels in peptic fragments of α-crystallin when the protein was exposed to D2O at 37°C for 28 sec. Prior to labeling, the protein was equilibrated at 37°C for 30 min (open bars) or heated to 67°C for 30 min, then cooled to 37°C (closed bars).
Discussion
Hydrogen exchange was chosen to study thermal-induced structural changes in α-crystallins because the technique is a sensitive indicator of protein structure. The folded structure of proteins can reduce the exchange rates of hydrogen located at peptide amide linkages by several orders of magnitude from the rates found in an unstructured peptide. This large reduction in exchange rates, which is often referred to as “protection,” is primarily due to intramolecular hydrogen bonding and solvent shielding. The high sensitivity of hydrogen exchange rates to protein structure has been illustrated by the different exchange rates measured for oxidized and reduced cytochrome c (Wand et al. 1986; Dharmasiri and Smith 1997). Finding different hydrogen exchange properties was surprising because X-ray crystallography shows that the root mean square (rms) difference in the atomic positions of oxidized and reduced cytochrome c is only 0.5 Å (Berghuis and Brayer 1992). Amide hydrogen exchange has also been used to detect minor structural differences in different constructs of SH2 and SH3 domains (Engen et al. 1999b).
The principal goal of the present study was to detect thermal-induced structural changes in human α-crystallin. Our hydrogen exchange results for the intact proteins (αA, αA-S, αB, and αB + P), presented in Figure 2 ▶, show that there is a gradual loosening of structure as the temperature is increased from 27°C to 57°C for all four major structural forms of α-crystallin. Results from analyses of the peptic fragments of these proteins, presented in Figure 6 ▶, show that the thermal loosening occurs along the entire α-crystallin backbone. In general, there were no localized, abrupt changes in hydrogen bonding or solvent exposure, although a few regions showed larger increases in H/D exchange as the temperature was increased from 47°C to 57°C than for the other temperature intervals. This gradual loosening of the structure is consistent with studies noting the high thermal stability of α-crystallin (Maiti et al. 1988; Carver et al. 1993, 1995) and only gradual structural changes with heating (Farnsworth et al. 1997; Burgio et al. 2001).
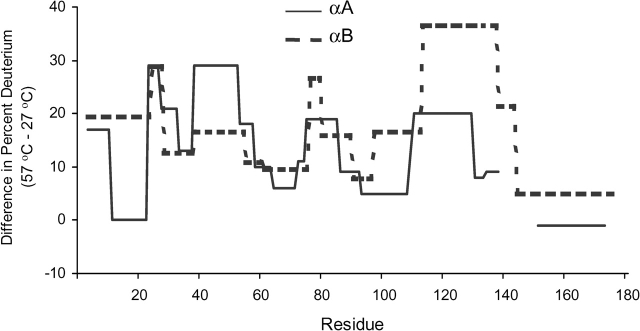
Even though α-crystallin is stable toward heating, data from isolated αA- and αB-crystallins using various techniques have noted differences in the responses of heated αA- and αB-crystallins. Tryptophan fluorescence indicated greater thermal-induced structural changes in αB than αA (Datta and Rao 1999; Liang et al. 2000), whereas studies using bis-ANS binding as a probe showed the structure of αA to be more affected by heating than αB (Reddy et al. 2000). We examined the H/D exchange data for regional differences in the behavior of αA and αB that might explain these discrepancies. The difference between the H/D exchange of αA and αB at 27°C and 57°C for each of the peptides is shown in Figure 8 ▶. Three regions showed marked differences between αA and αB. First, the region including residues 11–23, adjacent to Trp 9 in both αA and αB, showed a large increase in H/D exchange in αB as the temperature was increased from 27°C to 57°C, but no change in αA. This difference indicated that the larger change in Trp fluorescence of αB (Datta and Rao 1999; Liang et al. 2000) might be due to an unfolding in the area adjacent to Trp 9 that does not occur in αA. A second region where the behavior of αA and αB differs with heating includes the hydrophobic areas, αA 38–52 and the corresponding αB 38–54. For these peptides, αA had a much greater heat-induced increase in H/D exchange than αB. Because bis-ANS binds to hydrophobic regions, this difference in H/D exchange may reflect the change in exposure responsible for increased bis-ANS binding to αA as compared with αB as the temperature is raised (Reddy et al. 2000). A third region, including residues 110–129 of αA and 113–137 of αB, showed a greater increase in H/D exchange of αB. However, the H/D exchange in this region of αB at 27°C was much lower than αA, and, despite the increase, was still lower than αA at 57°C.
Figure 8.
The difference between deuterium levels found in peptic fragments of αA- and αB-crystallins following exposure of the intact protein to D2O for 57°C or 27°C, both at t1.
A salient feature of the H/D exchange data for both αA and αB at all temperatures is the division of the sequences into two principal regions of moderate to high exchange separated by a region of very low exchange. This division corresponds very well with the two-domain structure proposed by Wistow (1985). In that structure, the N-terminal domains include residues 1–63 of αA and αB, and the C-terminal domains include the remaining amino acids. At the beginning of the C-terminal domain are peptides 72–75 in αA and 76–79 in αB, with only ~25% exchange after the longest incubation time at 27°C. These two peptides have the slowest exchange of all the regions of αA and αB. This low H/D exchange and the very hydrophobic nature of these residues indicate that these regions of αA and αB are buried and perhaps form the nucleus of the “core” of the folded protein. Even though these regions were still highly protected at 57°C, the H/D exchange was more than double what it was at 27°C, resulting in these peptides having the largest percentage increases in H/D exchange. Residues 72–75 of αA and 76–79 of αB are also of interest because they are included in the sequences of two peptides described as “mini-chaperones” (Sharma et al. 2000; K.K. Sharma, pers. comm.). Isotope exchange of peptide 72–75 in bovine αA-crystallin has been reported to be similarly low, and increased at higher temperatures (Smith et al. 1996). Exposure of these regions when the proteins are denatured likely contributes to enhanced α-crystallin chaperone-like activity at higher temperatures.
For both αA and αB, peptides from the region between the putative central “core” and the C-terminal extensions (αA 75–139 and αB 80–143) showed, in general, lower exchange than the N-terminal domains or the C-terminal extensions. These results contrast with NMR data indicating that this central region of the C-terminal domains is more exposed than the N-terminal domains (Carver et al. 1993). These apparent differences may be because NMR data for the C termini were limited to signals from Tyr 122 of αB and phosphorylated Ser 122 of αA. In the H/D exchange data, αA peptide 110–129, which includes Ser 122, has exchange comparable to the N-terminal domain. The generally lower H/D exchange for the C-terminal domains of both αA and αB does not support models that feature exposed C-terminal domains and less accessible N-terminal domains (Carver et al. 1993, 1994; Wistow 1993).
The regions of highest exchange in both αA and αB are the C-terminal extensions. Because H/D exchange uses peptides produced by pepsin, the C-terminal peptides in this study, αA 151–173 and αB 144–175, are longer than the 8 and 10 residues for αA and αB, respectively, described as C-terminal extensions in NMR studies (Carver et al. 1992). Even with these larger peptides, H/D exchange showed >95% exchange for αA 151–173, indicating a loosely structured region. For αB 144–175, the exchange was slightly lower, perhaps because the measured H/D exchange for αB included additional residues that may be more structured. The high H/D exchange of the C termini agrees with the C-terminal flexibility indicated by NMR data (Carver et al. 1993).
The hydrophobicity of the N termini of αA- and αB-crystallins has led to proposed structures with these regions in unexposed positions (Derham and Harding 1999). Isotope exchange for the N termini indicate otherwise. Protection factors for isotope exchange in the N termini of αA- and αB-crystallins were <50 for 60%–80% of the residues (Fig. 6 ▶). When compared with protection factors for tightly folded proteins (104–108), these low protection factors point to a loose, highly exposed structure. The higher exchange in the N terminus of αA than αB is surprising in light of their high sequence homology, and indicates that, even though αA and αB subunits exchange freely (van den Oetelaar et al. 1990; Bova et al. 1997), their conformations differ. The recently solved three-dimensional structure of the 16.9-kD sHSP from Triticum aestivum (wheat) shows an assembly of 12 monomers, six with flexible N termini and six with structured N termini (van Montfort et al. 2001). Future proposed structures for native α-crystallin aggregates should consider the possibility that αA and αB occupy positions within the α-crystallin assembly analogous to the two forms of subunits in HSP 16.9.
Materials and methods
Isolation of α-crystallins
Two clear lenses were obtained from a 19-year-old organ donor (Lions Eye Bank, Omaha, NE) with no history of diseases known to affect lens clarity. The lenses were homogenized using a stirring bar for 4 h in a buffer (5 mM sodium phosphate, 1 mM EDTA, 1 mM DTT, and 0.02% NaN3 at pH 6.9). The lens homogenate was centrifuged at 15,000g and 4°C for 1 h to form a supernatant and pellet. The supernatant, which contained the water-soluble crystallins, was separated from the pellet and stored at −80°C. α-Crystallins were isolated from the other water-soluble crystallins by size exclusion chromatography (2.5 × 95 cm, Toyo-pearl HW-55sf, Toso HAAS). The elution buffer, which was the same as the buffer used to homogenize the lens, was delivered to the column by a parastolic pump at a flow rate of 22.5 mL/h. Protein elution was monitored at 280 nm. Fractions corresponding to α-crystallins were pooled and stored at −80°C.
Hydrogen/deuterium exchange
The general experimental procedure used to perform H/D exchange in folded proteins, quench the H/D exchange reaction, and analyze the labeled protein or its peptic fragments has been described previously (Smith et al. 1997; Wang and Smith 2002). Total α-crystallins (400 pmole/20 μL) obtained from size exclusion chromatography were equilibrated at 27°C, 37°C, 47°C, and 57°C for 30 min and then diluted 20-fold into D2O buffer (5 mM Na2HPO4, pD 6.9). These conditions were chosen because incubations at higher temperatures and longer times led to precipitation. Following incubation in the D2O buffer at these temperatures for various times, H/D exchange was quenched by decreasing the pD to 2.5 by addition of 20 μL of 100 mM HCl and decreasing the temperature to 0°C. These samples were frozen quickly in dry ice and stored at −80°C until analyzed by HPLC electrospray ionization mass spectrometry (ESIMS). To identify regions of α-crystallin that might be irreversibly altered by heating, one set of samples was incubated at 67°C for 30 min and then cooled to 37°C before labeling in D2O buffer (5 mM Na2HPO4 at pH 6.9) for 28 sec. The H/D exchange of these samples was compared with matched samples labeled at 37°C.
Two types of control samples were used to determine the amount of deuterium lost during analysis by HPLC ESIMS. One control sample, the 0% reference, contained no deuterium. The other control sample, the 100% reference, was completely equilibrated in the labeling solution. This sample was prepared by diluting total α-crystallin in buffer (5 mM sodium phosphate, 1 mM EDTA, 1 mM DTT, and 0.02% NaN3 at pH 6.9) 20-fold in the labeling solution (5 mM Na2HPO4 at pD 6.9) and incubating at 80°C for 6–8 h. The exchange reaction was quenched by decreasing the pD to 2.5 with 20 μL of 0.1 M DCl and decreasing the temperature to 0°C. All pH measurements are as read directly from the pH meter (Bai et al. 1993).
Analysis of labeled α-crystallins by HPLC ESIMS
The deuterium levels in intact αA- and αB-crystallin were determined by HPLC ESIMS. The labeled α-crystallins (400 pmole/420 μL) of each sample were trapped in an HPLC injector loop (5 μL protein microtrap, Michrom Resources) and desalted with 800 μL of a solution of 2% acetonitrile and 0.05% trifluoroacetic acid (TFA) in water. The proteins were then eluted to separate αA- and αB-crystallins by reversed phase HPLC (Vydac C4, 1 × 50 mm, 5 μm, Micro-Tech Scientific, flow rate 30 μL/min) using a gradient of 35%–50% of solvent B in 5 min. Solvent A was water and solvent B was acetonitrile, both with 0.05% TFA. The HPLC injector and column were cooled to 0°C using an ice bath. The effluent from the HPLC was directed to a quadrupole ESI mass spectrometer (Micromass Platform II). Mass spectra of the charge states +12 to +28 were summed to assign molecular masses. Following calibration of the mass spectrometer with myoglobin, the molecular masses of partially deuterated α-crystallins were determined with an uncertainty of ±2 D. Mass spectrometric data were processed with Mass Lynx 3.3 software using the maximum entropy algorithm.
Similar procedures were used to determine the deuterium levels in peptic fragments of α-crystallin labeled as described above. Just prior to analysis by HPLC ESIMS, the labeled crystallins were digested with pepsin (0°C, 5 min, E:S 2:1 [w/w]) under conditions that minimized isotope exchange at peptide amide linkages (Englander et al. 1985; Zhang and Smith 1993). The labeled peptides were concentrated and desalted by a cartridge (5 μL of peptide microtrap, Michrom Resources). The cartridge was washed with 200 μL of 0.05% TFA containing 2% acetonitrile to remove salts. The peptides were then eluted from the cartridge and fractionated by reversed phase HPLC (Vydac C18, 1 × 50 mm, 5 μm, Micro-Tech Scientific, flow rate 30 μL /min). The effluent from the HPLC was directed to an electrospray ion trap mass spectrometer (Finnigan LCQ), where the molecular masses of peptides were routinely determined with an uncertainty of ±0.1 D. The data were processed with X-Caliber, and average mass values were determined using Magtran.
Method reproducibility
Reproducibility of the methods for both intact proteins and peptides was determined using multiple samples. Ten samples of α-crystallin (400 pmole in 20 μL of 5 mM Na2HPO4/H2O buffer at pH 6.9) were equilibrated at room temperature for 30 min. Isotope exchange was initiated by diluting each sample 20-fold into the deuterated form of the same buffer. Following incubation for 30 min, isotope exchange was quenched as described above. The molecular masses of the intact proteins in five deuterated samples were determined as described above for protein analysis. The other five samples were digested by pepsin and analyzed following the procedure described above for peptide analysis.
Acknowledgments
This investigation was supported by NIH grant RO1 EY07609 and the Nebraska Center for Mass Spectrometry. We thank Z. Zhang for use of the Magtran computer program.
The publication costs of this article were defrayed in part by payment of page charges. This article must therefore be hereby marked “advertisement” in accordance with 18 USC section 1734 solely to indicate this fact.
Article and publication are at http://www.proteinscience.org/cgi/doi/10.1110/ps.03180004.
References
- Abgar, S., Backman, J., Aerts, T., Vanhoudt, J., and Clauwaert, J. 2000. The structural differences between bovine lens αA- and αB-crystallin. Eur. J. Biochem. 267 5916–5925. [DOI] [PubMed] [Google Scholar]
- Bai, Y.W., Milne, J.S., Mayne, L., and Englander, S.W. 1993. Primary structure effects on peptide group hydrogen exchange. Proteins 17 75–86. [DOI] [PMC free article] [PubMed] [Google Scholar]
- ———. 1994. Protein stability parameters measured by hydrogen exchange. Proteins 20 4–14. [DOI] [PubMed] [Google Scholar]
- Berengian, A.R., Bova, M.P., and Mchaourab, H.S. 1997. Structure and function of the conserved domain in αA-crystallin. Site-directed spin labeling identifies a β-strand located near a subunit interface. Biochemistry 36 9951–9957. [DOI] [PubMed] [Google Scholar]
- Berghuis, A.M. and Brayer, G.D. 1992. Oxidation state-dependent conformational changes in cytochrome c. J. Mol. Biol. 223 959–976. [DOI] [PubMed] [Google Scholar]
- Bova, M.P., Ding, L.-L., Horwitz, J., and Fung, B.K.-K. 1997. Subunit exchange of αA-crystallin. J. Biol. Chem. 272 29511–29517. [DOI] [PubMed] [Google Scholar]
- Burgio, M.R., Bennett, P.M., and Koretz, J.F. 2001. Heat-induced quaternary transitions in hetero- and homo-polymers of α-crystallin. Mol. Vis. 7 228–233. [PubMed] [Google Scholar]
- Carver, J.A., Aquilina, J.A., Truscott, R.J.W., and Ralston, G.B. 1992. Identification by 1H NMR spectroscopy of flexible C-terminal extensions in bovine α-crystallins. FEBS Lett. 311 143–149. [DOI] [PubMed] [Google Scholar]
- Carver, J.A., Aquilina, A., and Truscott, R.J.W. 1993. An investigation into the stability of α-crystallin by NMR spectroscopy; evidence for a two-domain structure. Biochim. Biophys. Acta 1164 22–28. [DOI] [PubMed] [Google Scholar]
- ———. 1994. A possible chaperone-like quaternary structure for α-crystallin. Exp. Eye Res. 59 231–242. [DOI] [PubMed] [Google Scholar]
- Carver, J.A., Guerreiro, N., Nicholls, K.A., and Truscott, R.J.W. 1995. On the interaction of α-crystallin with unfolded proteins. Biochim. Biophys. Acta 1252 251–260. [DOI] [PubMed] [Google Scholar]
- Caspers, G., Leunissen, J.A.M., and de Jong, W.W. 1995. The expanding small heat-shock protein family, and structure predictions of the conserved “α-crystallin domain.” J. Mol. Evol. 40 238–248. [DOI] [PubMed] [Google Scholar]
- Chiou, S.-H. and Azari, P. 1989. Physicochemical characterization of α-crystallins from bovine lenses: Hydrodynamic and conformational properties. J. Protein Chem. 8 1–17. [DOI] [PubMed] [Google Scholar]
- Das, K.K., Liang, J.J.-N., and Chakrabarti, B.C. 1997. Heat-induced conformational change and increased chaperone activity of lens α-crystallin. Curr. Eye Res. 16 303–309. [DOI] [PubMed] [Google Scholar]
- Das, K.P. and Surewicz, W.K. 1995. Temperature-induced exposure of hydrophobic surfaces and its effect on the chaperone activity of α-crystallin. FEBS Lett. 369 321–325. [DOI] [PubMed] [Google Scholar]
- Datiles, M.B., Schumer, D.J., Zigler, J.S., Russell, P., Anderson, L., and Garland, D. 1992. Two-dimensional gel electrophoretic analysis of human lens proteins. Curr. Eye Res. 11 669–677. [DOI] [PubMed] [Google Scholar]
- Datta, S.A. and Rao, C.M. 1999. Differential temperature-dependent chaperone-like activity of αA- and αB-crystallin homoaggregates. J. Biol. Chem. 274 34773–34778. [DOI] [PubMed] [Google Scholar]
- ———. 2000. Packing-induced conformational and functional changes in the subunits of α-crystallin. J. Biol. Chem. 275 41004–41010. [DOI] [PubMed] [Google Scholar]
- Derham, B.K. and Harding, J.J. 1999. α-Crystallin as a molecular chaperone. Prog. Ret. Eye Res. 18 463–509. [DOI] [PubMed] [Google Scholar]
- Dharmasiri, K. and Smith, D.L. 1997. Regional stability changes in oxidized and reduced cytochrome c located by hydrogen exchange and mass spectrometry. J. Am. Soc. Mass Spectrom. 8 1039–1045. [Google Scholar]
- Engen, J.R. and Smith, D.L. 2001. Investigating protein structure and dynamics by hydrogen exchange MS. Anal. Chem. 73 256A–265A. [DOI] [PubMed] [Google Scholar]
- Engen, J.R., Gmeiner, W.H., Smithgall, T.E., and Smith, D.L. 1999a. Hydrogen exchange shows peptide binding stabilizes motions in Hck SH2. Biochemistry 38 8926–8935. [DOI] [PubMed] [Google Scholar]
- Engen, J.R., Smithgall, T.E., Gmeiner, W.H., and Smith, D.L. 1999b. Comparison of SH3 and SH2 domain dynamics when expressed alone or in an SH(3 + 2) construct: The role of protein dynamics in functional regulation. J. Mol. Biol. 287 645–656. [DOI] [PubMed] [Google Scholar]
- Englander, J.J., Rogero, J.R., and Englander, S.W. 1985. Protein hydrogen exchange studied by the fragment separation method. Anal. Biochem. 147 234–244. [DOI] [PMC free article] [PubMed] [Google Scholar]
- Farnsworth, P.N., Groth-Vasselli, B., Greenfield, N.J., and Singh, K. 1997. Effects of temperature and concentration on bovine lens α-crystallin secondary structure: A circular dichroism spectroscopic study. Int. J. Biol. Macromol. 20 283–291. [DOI] [PubMed] [Google Scholar]
- Horwitz, J. 1992. α-Crystallin can function as a molecular chaperone. Proc. Natl. Acad. Sci. 89 10449–10453. [DOI] [PMC free article] [PubMed] [Google Scholar]
- Kim, K.-S. and Woodward, C. 1993. Protein internal flexibility and global stability: Effect of urea on hydrogen exchange rates of bovine pancreatic trypsin inhibitor. Biochemistry 32 9609–9613. [DOI] [PubMed] [Google Scholar]
- Koteiche, H.A., Berengian, A.R., and Mchaourab, H.S. 1998. Identification of protein folding patterns using site-directed spin labeling. Structural characterization of a β-sheet and putative substrate binding regions in the conserved domain of αA-crystallin. Biochemistry 37 12681–12688. [DOI] [PubMed] [Google Scholar]
- Lampi, K.J., Ma, Z., Hanson, S.R.A., Azuma, M., Shih, M., Shearer, T.R., Smith, D.L., Smith, J.B., and David, L.L. 1998. Age-related changes in human lens crystallins identified by two dimensional gel electrophoresis. Exp. Eye Res. 67 31–43. [DOI] [PubMed] [Google Scholar]
- Lee, J.-S., Satah, T., Shinoda, H., Samejima, T., Wu, S.-H., and Chiou, S.-H. 1997. Effect of heat-induced structural perturbation of secondary and tertiary structures on the chaperone activity of α-crystallin. Biochem. Biophys. Res. Commun. 237 277–282. [DOI] [PubMed] [Google Scholar]
- Liang, J.J.-N., Sun, T.-X., and Akhtar, N.J. 2000. Heat-induced conformational change of human lens recombinant αA- and αB-crystallins. Mol. Vis. 6 10–14. [PubMed] [Google Scholar]
- Ma, Z., Hanson, S.R., Lampi, K., David, L., Smith, D.L., and Smith, J.B. 1998. Age-related changes in human lens crystallins identified by HPLC and mass spectrometry. Exp. Eye Res. 67 21–30. [DOI] [PubMed] [Google Scholar]
- Maiti, M., Kono, M., and Chakrabarti, B. 1988. Heat-induced changes in the conformation of α- and β-crystallins: Unique thermal stability of α-crystallin. FEBS Lett. 236 109–114. [DOI] [PubMed] [Google Scholar]
- Mchaourab, H.S., Berengian, A.R., and Koteiche, H.A. 1997. Site-directed spin-labeling study of the structure and subunit interactions along a conserved sequence in the α-crystallin domain of heat-shock protein 27. Evidence of a conserved subunit interface. Biochemistry 36 14627–14634. [DOI] [PubMed] [Google Scholar]
- Miesbauer, L.R., Zhou, X., Yang, Z., Yang, Z., Sun, Y., Smith, D.L., and Smith, J.B. 1994. Post-translational modifications of the water soluble human lens crystallins from young adults. J. Biol. Chem. 269 12494–12502. [PubMed] [Google Scholar]
- Raman, B. and Rao, C. M. 1994. Chaperone-like activity and quaternary structure of α-crystallin. J. Biol. Chem. 269 27264–27268. [PubMed] [Google Scholar]
- ———. 1997. Chaperone-like activity and temperature-induced structural changes of α-crystallin. J. Biol. Chem. 272 23559–23564. [DOI] [PubMed] [Google Scholar]
- Reddy, G.B., Das, K.P., Petrash, J.M., and Surewicz, W.K. 2000. Temperature-dependent chaperone activity and structural properties of human αA- and αB-crystallins. J. Biol. Chem. 275 4565–4570. [DOI] [PubMed] [Google Scholar]
- Smith, D.L., Deng, Y., and Zhang, Z. 1997. Probing the non-covalent structure of proteins by amide hydrogen exchange and mass spectrometry. J. Mass Spectrom. 32 135–146. [DOI] [PubMed] [Google Scholar]
- Smith, J.B., Liu, Y., and Smith, D.L. 1996. Identification of possible regions of chaperone activity in lens α-crystallins. Exp. Eye Res. 63 125–128. [DOI] [PubMed] [Google Scholar]
- Smulders, R.H.P.H. and deJong, W.W. 1997. The hydrophobic probe 4,4′-bis(1-anilino-8-naphthalene sulfonic acid) is specifically photoincorporated into the N-terminal domain of αB-crystallin. FEBS Lett. 409 101–104. [DOI] [PubMed] [Google Scholar]
- Swamy, M.S. and Abraham, E.C. 1991. Reverse-phase HPLC analysis of human α crystallin. Curr. Eye Res. 10 213–220. [DOI] [PubMed] [Google Scholar]
- van den Oetelaar, P.J.M., van Someren, P.F.H.M., Thomson, J.A., Siezen, R.J., and Hoenders, H.J. 1990. A dynamic quaternary structure of bovine α-crystallin as indicated from intermolecular exchange of subunits. Biochemistry 29 3488–3493. [DOI] [PubMed] [Google Scholar]
- Vanhoudt, J., Abgar, S., Aerts, T., and Clauwaert, J. 2000. Native quaternary structure of bovine α-crystallin. Biochemistry 39 4483–4492. [DOI] [PubMed] [Google Scholar]
- van Montfort, R.L., Basha, E., Friedrich, K.L., Slingsby, C., and Vierling, E. 2001. Crystal structure and assembly of a eukaryotic small heat shock protein. Nat. Struct. Biol. 8 1025–1030. [DOI] [PubMed] [Google Scholar]
- Wand, A.J., Roder, H., and Englander, S.W. 1986. Two-dimensional 1H NMR studies of cytochrome c: Hydrogen exchange in the N-terminal helix. Biochemistry 25 1107–1114. [DOI] [PubMed] [Google Scholar]
- Wang, L. and Smith, D.L. 2002. Probing protein structure and dynamics by hydrogen exchange-mass spectrometry. Curr. Prot. Protein Sci. 2 17.16.11– 17.16.18. [DOI] [PubMed] [Google Scholar]
- Wang, L., Lane, L.C., and Smith, D.L. 2001. Detecting structural changes in viral capsids by hydrogen exchange and mass spectrometry. Protein Sci. 10 1234–1243. [DOI] [PMC free article] [PubMed] [Google Scholar]
- Wistow, G. 1985. Domain structure and evolution in crystallins and small heat-shock proteins. FEBS Lett. 181 1–6. [DOI] [PubMed] [Google Scholar]
- ———. 1993. Possible tetramer-based quaternary structures for α-crystallin and small heat shock proteins. Exp. Eye Res. 56 729–732. [DOI] [PubMed] [Google Scholar]
- Zhang, Z. and Smith, D.L. 1993. Determination of amide hydrogen exchange by mass spectrometry: A new tool for protein structure elucidation. Protein Sci. 2 522–531. [DOI] [PMC free article] [PubMed] [Google Scholar]


