

Abstract
The potential for using paramagnetic lanthanide ions to partially align troponin C in solution as a tool for the structure determination of bound troponin I peptides has been investigated. A prerequisite for these studies is an understanding of the order of lanthanide ion occupancy in the metal binding sites of the protein. Two-dimensional {1H, 15N} HSQC NMR spectroscopy has been used to examine the binding order of Ce3+, Tb3+, and Yb3+ to both apo- and holo-forms of human cardiac troponin C (cTnC) and of Ce3+ to holo-chicken skeletal troponin C (sTnC). The disappearance of cross-peak resonances in the HSQC spectrum was used to determine the order of occupation of the binding sites in both cTnC and sTnC by each lanthanide. For the lanthanides tested, the binding order follows that of the net charge of the binding site residues from most to least negative; the N-domain calcium binding sites are the first to be filled followed by the C-domain sites. Given this binding order for lanthanide ions, it was demonstrated that it is possible to create a cTnC species with one lanthanide in the N-domain site and two Ca2+ ions in the C-domain binding sites. By using the species cTnC•Yb3+•2 Ca2+ it was possible to confer partial alignment on a bound human cardiac troponin I (cTnI) peptide. Residual dipolar couplings (RDCs) were measured for the resonances in the bound 15N-labeled cTnI129–148 by using two-dimensional {1H, 15N} inphase antiphase (IPAP) NMR spectroscopy.
Keywords: Troponin C, lanthanides, NMR, ion binding order, residual dipolar couplings
The troponin complex is a group of proteins that are collectively responsible for the regulation of muscle contraction in striated muscle. Troponin C (TnC) plays a key role in this regulation, as it is the molecule that translates the influx of calcium to the sarcoplasmic reticulum into a series of conformational changes in the thin filament proteins that are necessary for contraction. This cascade of conformational changes, which flows from TnC through troponin I (TnI), troponin T, and tropomyosin to actin, where the activation/inhibition of the actomyosin ATPase occurs and triggers muscle contraction (for reviews, see Geeves and Holmes 1999, Gordon et al. 2000). Although both skeletal and cardiac muscles behave similarly in this contraction cascade, they do differ in the isoforms of the proteins involved. With respect to TnC, there are two distinct isoforms, one cardiac and one skeletal. They are both dumbbell-shaped molecules that consist of N- and C-terminal globular domains connected by a helical linker, and contain four EF-hand helix–loop–helix folds that are potential Ca2+-binding sites (sites I to IV; for review, see Gagné et al. 1998). Each globular domain contains two Ca2+-binding sites, with the C-domain sites (III and IV) having a higher affinity for Ca2+ and a potential for Mg2+ binding, and the N-domain sites (I and II) are specific for Ca2+ and of lower binding affinity. The key difference between the cardiac (cTnC) and skeletal (sTnC) isoforms is a set of key amino acid substitutions that render site I in cTnC unable to bind Ca2+ at physiological concentrations (van Eerd and Takahashi 1975). In addition to this, it is known that the metal binding properties of the cardiac isoform differ significantly from the skeletal isoform, particularly with respect to Mg2+ (Robertson et al. 1981). It is believed that sites III and IV are constantly occupied by Ca2+ or Mg2+ under physiological conditions and that the C-domain fulfills a more structural role in anchoring TnC to the rest of the thin filament via TnI. The presence or absence of Ca2+ in the N-domain sites is the regulating factor in the transmission of the signal through the thin filament.
Both the cardiac and skeletal isoforms differ in their site I functionality, which results in differences in the mechanism by which the N-domain of each bind to their respective TnI counterparts (Putkey et al. 1989; Sheng et al. 1992). In the skeletal isoform, the binding of Ca2+ to the N-domain results in a conformational change that unveils a hydrophobic pocket (Gagné et al. 1995). In cTnC, conformational change does not occur (Sia et al. 1997; Spyracopoulos et al 1997). However, it has been demonstrated that both isoforms take a similar conformation when bound to their respective TnI regions: residues 115–131 in skeletal and residues 147–163 in cardiac (Li et al. 1999; Spyracopoulos et al 2000). This region of TnI is known to bind to the N-domain of TnC and modulate the interactions between the N terminus of TnI (residues 1–40 in skeletal and 34–71 in cardiac) and the TnI inhibitory domain (residues 96–115 in skeletal and 129–148 in cardiac) with TnC (for reviews, see Farah and Reinach 1995, Solaro and Rarick 1998).
Studies of the interaction of cTnC and cTnI by NMR have been limited to cTnI peptides bound to either the N- or C-domain or to intact cTnC (McKay et al. 1999; Li et al. 2002; Lindhout et al. 2002). This is due to the large size of the cTnC•cTnI complex (43 kD) and a lack of spectral dispersion for residues of TnI, which results in poor-quality spectra from which to extract NOE restraints for structure elucidation. For this reason, other methods such as the residual dipolar coupling (RDC) have been pursued (Permi et al 2000). RDCs have the advantages that they can be used in higher-molecular-weight complexes and that they provide long-range distance restraints such as the angle that the amide bonds in the protein make with a magnetic susceptibility tensor (χ) principle axis (Tolman et al. 1995). These are very useful constraints for elongated structures such as the TnC–TnI complex.
It has been known for quite some time that lanthanides may be substituted for calcium in calcium-binding EF-hand proteins (Lee and Sykes 1983). This is due to lanthanide metals having a similar radius and ligand preference in the 3+ oxidation state to that of Ca2+, with a higher charge density (Leavis et al. 1980; Wang et al. 1981; Lee and Sykes 1983). Bound paramagnetic lanthanides have been demonstrated to have the ability to induce partial alignment of proteins in high magnetic fields to an extent similar to other orienting methods (Biekofsky et al. 1999; Contreras et al. 1999; Bertini et al. 2000; Feeney et al. 2001). These calcium binding proteins have allowed for the use of RDCs as orientation restraints in the calculation and refinement of several solution structures (Barbieri et al. 2002; Dvoretsky et al. 2002). Thus, the calcium binding properties of cTnC make the use of lanthanide substitution ideal for the extraction of orientation-based parameters for structure elucidation of the cardiac troponin complex. It has been noted, however, that the order in which lanthanides bind to EF-hand binding sites differs not only with respect to Ca2+ binding, but also among the lanthanides themselves (Leavis et al. 1980). By using an oriented protein of known structure, it is possible to extract orientation parameters (Feeney et al. 2001) and thereby determine the three-dimensional structure of a bound ligand. As a prerequisite for structural studies, it is necessary to understand lanthanide occupancy in TnC. Although others have addressed lanthanide occupancy in the skeletal isoform (Leavis et al. 1980), it is unwise to assume that both isoforms behave the same way with respect to metal ion binding. This has been shown in the studies of the magnesium binding abilities of the two isoforms, which demonstrated that magnesium binds 17-fold stronger to sites III and IV in sTnC than to cTnC. (Johnson et al. 1980) This work details the binding order of several lanthanide ions (Ce3+, Tb3+, and Yb3+) to apo- and Ca2+-saturated cTnC, as well as the binding order of Ce3+ to Ca2+-saturated sTnC. We have demonstrated that it is possible to place a single lanthanide ion into site II of calcium-saturated cTnC, and to monitor the formation of the species by simple one-dimensional (1D) NMR. By using this method, we have been able to extract orientation parameters from 15N-cTnI129–148 bound to unlabeled cTnC containing a single bound Yb3+ ion in site II.
Results
The purpose of this study was to determine the potential for using paramagnetic lanthanide ions to partially align troponin C in solution as a tool for the structure determination of bound TnI peptides. To do so, it was necessary to determine the site specificity for lanthanide addition to troponin C as a prerequisite for structural applications.
Lanthanide titration of Ca2+-saturated cTnC
In this study two-dimensional (2D) {1H, 15N} HSQC NMR spectroscopy was used to monitor the binding order of different lanthanide ions to 15N-cTnC. Previous studies have demonstrated the utility of 2D {1H, 15N} HSQC NMR in characterizing Ca2+ and TnI peptide binding to both sTnC and cTnC (McKay et al. 2000). The 2D {1H, 15N} HSQC spectrum of Ca2+-saturated cTnC has previously been assigned (Sia et al. 1997) and was used to determine which residues were affected by pseudo-contact shifting and/or paramagnetic broadening during the lanthanide titrations. Figure 1 ▶ depicts the same expanded region from the 2D {1H, 15N} HSQC spectrum for each of the four species that were generated during the titrations of cTnC•3Ca2+ with CeCl3, TbCl3, and YbCl3. Figure 1A ▶ shows the holo-cTnC spectrum at the beginning of the titration, with the labeled cross-peaks corresponding to amino acid residues that occur in the three active binding loops of cTnC. Residues E66, V72, and D73 are located in site II; I112 and D113 in site III; and I148, D149, and F153 in site IV. Figure 1, B through D ▶, show the same spectral region after one molar equivalent of Ce3+, Tb3+, and Yb3+, respectively, have been titrated into holo-cTnC. In this figure asterisks mark those residues with resonances that had disappeared from their original positions and/or broadened beyond detectability due to close proximity to a bound lanthanide. In all cases, those resonances that had disappeared corresponded to the residues found in the site II binding loop, whereas those that corresponded to sites III and IV had not shifted noticeably. This was an indication that all three lanthanide ions had preferentially bound to, and displaced Ca2+ from, the N-domain binding site. Note that some of the unassigned resonances in the upper right had also shifted or broadened upon addition of lanthanide. These resonances are also located in the N-domain but are not part of the binding loop. Further note the change in intensity of the C-domain binding loop residues in Figure 1, C and D ▶. Because the degree of shifting and broadening due to lanthanide binding is dependent upon 1/r3 and 1/r6, respectively (Bertini et al. 2001), we would not expect this broadening to come from lanthanides bound to the N-domain. Thus, the change in intensity demonstrated that there was partial binding of lanthanide to sites III and IV by the time one molar equivalent had been reached in the titration.
Figure 1.

Portions of a 2D {1H, 15N} HSQC spectra of 15N-cTnC saturated with Ca2+ (A), subsequently titrated to one molar equivalent with Ce3+ (B), Tb3+ (C), or Yb3+ (D). Asterisks mark the position of N-domain binding site II resonances that have either shifted or broadened beyond detection after the addition of one molar equivalent of lanthanide to holo-cTnC.
Figure 2 ▶ shows the results of the continued titration of Ca2+-saturated cTnC with Ce3+ beyond the first molar equivalent. Here we observed the glycine residues located in the middle of the binding loops, G110 and G146, corresponding to sites III and IV respectively. Although Ca2+ is displaced from both sites, the site III resonances diminished faster than their site IV counterparts, and by the time two molar equivalents of Ce3+ had been added, there was no longer a detectable resonance from G110. This indicated a preference for site III over site IV.
Figure 2.

Portions of a 2D {1H, 15N} HSQC spectra of 15N-cTnC•Ce3+•2Ca2+ depicting the downfield Gly residues of the C-domain binding loops III and IV. This series demonstrates the binding order of Ce3+ to the C-domain sites after the binding of one molar equivalent of Ce3+ to holo-cTnC. The titration progresses from the upper left box at 1.1 eq and proceeds to the lower right by 0.1 eq steps. The two C-domain Gly residues are labeled, and an additional unassigned residue is labeled with a question mark. This residue moved into this region upon the binding of the first equivalent of Ce3+ and is likely an N-domain resonance.
Lanthanide titration of Apo-cTnC
In the titrations of holo-cTnC with lanthanides, a displacement of the weakest bound 2+ cation first by a stronger 3+ cation appeared to be occurring. To determine which site was occupied first in the absence of competing Ca2+, apo-15N-cTnC was titrated with CeCl3. Figure 3 ▶ depicts the 2D {1H, 15N} HSQC spectrum of both apo-cTnC (Fig. 3A ▶) and cTnC bound to one molar equivalent of Ce3+ (Fig. 3B ▶). In each case, the resonances corresponding to the residues of the N-domain binding site are indicated with arrows. Note that after the addition of 1 eq of Ce3+, these resonances had either shifted from their initial positions or disappeared, implying that binding had occurred in site II. This is significant in that it demonstrated a preference for the N-domain binding site over the C-domain sites, even when there were no competing ions to displace. Also note that that in apo-cTnC the C-domain is unstructured, and thus, resonances for the C-domain Gly residues 110 and 146 were not observed.
Figure 3.

2D {1H, 15N} HSQC spectrum of both 15N-apo-cTnC (A) and 15N-cTnC bound to one molar equivalent of Ce3+ (B). Arrows point to the apo-positions of the site II binding loop resonances in both spectra.
Lanthanide titration of Ca2+-saturated sTnC
In the results above, a demonstration of an N-domain binding preference by lanthanides for cTnC can be seen. In previous fluorescence studies with sTnC, however, the binding preference was found to be the same among lanthanides as for Ca2+ (Leavis et al. 1980). In an attempt to understand the differences between the cardiac and skeletal isoforms with respect to their lanthanide binding order preferences, a titration of sTnC was performed in a manner identical to the cTnC titrations. Figure 4 ▶ shows an expanded region of the 2D {1H, 15N} HSQC spectrum for several points in the titration of sTnC with Ce3+. This region shows the downfield-shifted Gly residues found in the center of each binding loop in sTnC, and assignments were made based on previously assigned 2D {1H, 15N} HSQC spectra (Slupsky and Sykes 1995). Figure 4, A and B ▶, shows the apo- and Ca2+-saturated states, and Figure 4, C through F ▶, shows the changes to the spectrum after the addition of one, two, three, or four molar equivalents of Ce3+, respectively. As Ce3+ was added to the solution, the N-domain peaks were the first to disappear, followed by the C-domain. Note also that the N-domain peaks were split, G36 more so than G72. This cause of the splitting is likely due to Cys cross-bridge formation at high concentrations dimerizing the protein at the N-domain because neither DTT nor β-mercaptoethanol was added to the protein solution (Tsuda et al. 1988). Again, as in the cTnC spectra, the C-domain is unfolded in the apo-state; thus, the C-domain Gly resonances were not observed in Figure 4A ▶.
Figure 4.

Portions of a 2D {1H, 15N} HSQC spectrum showing several points in the titration of 0.92 mM 15N-sTnC with Ce3+. The area containing downfield Gly residues of the ion binding loops is expanded, and the panels follow through the titration from apo-saturated (A) to Ca2+-saturated (B) through one, two, three, and four molar equivalents (C–F, respectively). All visible residues are labeled. Note that the splitting in the N-domain Gly resonances is likely due to Cys cross-bridge formation.
Orientation of cTnC•Yb3+•2Ca2+ and the measurement of RDCs for resonances of bound 15N-cTnI129–148
The 1D 1H NMR spectra shown in Figure 5, A and B ▶, demonstrate the selective binding of the Yb3+ ion to site II of calcium-saturated cTnC. Note that the degree that the C-domain cTnC Gly resonances were diminished was kept to a minimum by halting the addition of Yb3+ to the cTnC•3Ca2+•15N-cTnI129–148 at the first sign of a reduction in intensity. This was done to ensure that the least amount of Yb3+ possible would be present in the C-domain, so that the resonances from the bound peptide would not be broadened. To that end, only ~0.6 molar equivalents of Yb3+ were added to the TnC–TnI complex. A 2D {1H, 15N} IPAP spectra from an 800-MHz spectrometer is shown in Figure 5C ▶. In it, the resonances of 15N-cTnI129–148 residues (assigned as per Lindhout and Sykes 2003) are shown with their IPAP peaks connected with a dashed line, and the measured RDC (in hertz) noted. What is actually observed in the spectrum is a single averaged peak for each peptide residue, due to the fast exchange rate of the bound cTnI peptide between the Yb3+•2Ca2+ and 3Ca2+ species of cTnC. To extract the RDCs from the measured couplings, measurements were taken from both an unaligned and a partially aligned sample and subtracted to yield the residual coupling. This is done because the measured coupling is actually a sum of the 1JNH scalar coupling and the RDC (Tjandra et al. 1996). The RDC itself is dependent upon the square of the applied magnetic field (Bo) as shown by
Figure 5.


Expanded region of 1D NMR spectra at 600 MHz (A) and 800 MHz (B) of unlabeled cTnC, as well as a 2D {1H, 15N} IPAP spectrum also at 800 MHz (C) of 15N-cTnI129–148 bound to unlabeled cTnC. (A, B) The successful addition of Yb3+ solely to the N-domain site II, with the lower spectrum in each depicting the downfield Gly residues of cTnC•3Ca2+, and the upper spectrum depicting the same region of cTnC•Yb3+•2Ca2+. (C) The splitting of the 15N-cTnI129–148 resonances and the measured RDCs for each residue. For each pair of resonances connected by a dashed line, the upper resonance is the inphase resonance and the lower resonance is antiphase.
 |
(1) |
where Δχa and Δχr are the axial and rhombic components of the magnetic susceptibility tensor (χ), and θ and φ are the angular coordinates of the orientation of the N-H bond vector within the principal axis system of χ (Tjandra et al. 1996).
When the absolute value of the measured RDCs are plotted against the amino acid sequence of cTnI129–148 (Fig. 6 ▶), the strongest RDCs are found near the center of the peptide, whereas the weakest are found near the ends. In particular, this center area with the strongest RDCs has been found to be the only structured part of the peptide when bound to cTnC (Lindhout and Sykes 2003). This trend is to be expected because relatively unstructured regions of a polypeptide would experience much less average alignment than do structured regions. When the results of similar experiments on a 600-MHz spectrometer (data not shown) were compared with those above, the differences in measured RDCs were strictly dependent on the expected difference due to a weaker Bo. This demonstrated the large errors that are present in taking RDC measurements as the extraction of the data depends largely upon the accuracy of the measure of peak centers. Because of these errors and the relatively small RDCs observed, a structure was not calculated from the RDC data presented in Figure 6 ▶.
Figure 6.

A plot of the absolute value of measured RDCs from 15N-cTnI129–148 at 800 MHz versus the amino acid sequence of 15N-cTnI129–148. The inset structure of bound 15N-cTnI129–148 to the C-domain of cTnC is taken from Lindhout et al. 2002.
Discussion
In this study the binding of the lanthanide ions tested to cTnC has been shown to be in the order of site II → site III → site IV. This is in direct contrast to the observed binding order of Ca2+, which has been demonstrated to be III + IV → II (van Eerd and Takahashi 1975). The same can be said for the skeletal isoform, as the binding order of Ca2+ there has been demonstrated to be III + IV → I + II (Potter and Gergley 1975), yet we observe the opposite for Ce3+. This latter observation is not in agreement with previous fluorescence measurements that determined the Tb3+ binding order to be the same as that of Ca2+ (Leavis et al. 1980). Given that two of the ions tested, Ce3+ and Yb3+, span the lanthanide series, it is assumed that this behavior is the same for all lanthanides in that series. To understand this phenomenon, the crystal structures of calcium saturated chicken cTnC and rabbit sTnC were examined. Although there are differences in the primary sequence between the proteins used in these experiments and those of the crystal structures, the differences have no effect on the electrostatics of the binding loops.
The 12 residues that compose each active binding loop in both cTnC and sTnC are shown in Table 1, A and B, respectively. The data in these tables were generated by first calculating the net charge of each ion binding loop in both cTnC and sTnC at physiological pH. This value is listed beneath each residue and the total summed at the end of the line. The crystal structures of both chicken cTnC (Table 1A) and rabbit sTnC (Table 1B) were examined, and distances from the bound ion to the various charged loop residues were measured. By dividing the residue charge in Coulombs over the distance measured, a charge/distance ratio was obtained. This value is directly proportional to the electrostatic binding energy on each bound ion
Table 1.
A table showing the amino acid sequence of the active binding loops of chicken cardiac (A) and rabbit skeletal (B) tropoinin C
| A. | cTnC | |||||||||||||
| Site II | D | E | D | G | S | G | T | V | D | F | D | E | F | Total |
| Residues (62–74) | ||||||||||||||
| Charge | −1 | −1 | −1 | 0 | 0 | 0 | 0 | 0 | −1 | 0 | −1 | −1 | 0 | −6 |
| qi/riM × 10−9 (C/m) | −0.48 | −0.19 | −0.48 | — | — | — | — | — | −0.33 | — | −0.17 | −0.56 | — | −2.2 |
| Site III | D | K | N | A | D | G | Y | I | D | L | E | E | L | Total |
| Residues (105–117) | ||||||||||||||
| Charge | −1 | +1 | 0 | 0 | −1 | 0 | 0 | 0 | −1 | 0 | −1 | −1 | 0 | −4 |
| qi/riM × 10−9 (C/m) | −0.48 | +0.16 | — | — | −0.49 | — | — | — | −0.31 | — | −0.15 | −0.54 | — | −1.8 |
| Site IV | D | K | N | N | D | G | R | I | D | Y | D | E | F | Total |
| Residues (141–153) | ||||||||||||||
| Charge | −1 | +1 | 0 | 0 | −1 | 0 | +1 | 0 | −1 | 0 | −1 | −1 | 0 | −3 |
| qi/riM × 10−9 (C/m) | −0.45 | +0.17 | — | — | −0.50 | — | +0.22 | — | −0.32 | — | −0.16 | −0.55 | — | −1.6 |
| B. | sTnC | |||||||||||||
| Site 1 | D | A | D | G | G | G | D | I | S | V | K | E | V | Total |
| Residues (28–40) | ||||||||||||||
| Charge | −1 | 0 | −1 | 0 | 0 | 0 | −1 | 0 | 0 | 0 | +1 | −1 | 0 | −3 |
| qi/riM × 10−9 (C/m) | −0.46 | — | −0.48 | — | — | — | −0.30 | — | — | — | +0.34 | −0.56 | — | −1.5 |
| Site II | D | E | D | G | S | G | T | I | D | F | E | E | F | Total |
| Residues (64–76) | ||||||||||||||
| Charge | −1 | −1 | −1 | 0 | 0 | 0 | 0 | 0 | −1 | 0 | −1 | −1 | 0 | −6 |
| qi/riM × 10−9 (C/m) | −0.45 | −0.18 | −0.47 | — | — | — | — | — | −0.32 | — | −0.16 | −0.54 | — | −2.1 |
| Site III | D | R | N | A | D | G | Y | I | D | A | E | E | L | Total |
| Residues (104–116) | ||||||||||||||
| Charge | −1 | +1 | 0 | 0 | −1 | 0 | 0 | 0 | −1 | 0 | −1 | −1 | 0 | −4 |
| qi/riM × 10−9 (C/m) | −0.47 | +0.16 | — | — | −0.48 | — | — | — | −0.32 | — | −0.16 | −0.57 | — | −1.8 |
| Site IV | D | K | N | N | D | G | R | I | D | F | D | E | F | Total |
| Residues (140–152) | ||||||||||||||
| Charge | −1 | +1 | 0 | 0 | −1 | 0 | +1 | 0 | −1 | 0 | −1 | −1 | 0 | −3 |
| qi/riM × 10−9 (C/m) | −0.43 | +0.17 | — | — | −0.49 | — | +0.22 | — | −0.32 | — | −0.17 | −0.58 | — | −1.6 |
For each residue, the charge and charge/distance ratio is listed and then totalled for each loop at the end of the line. The charge of each residue is given at physiological pH. The charge/distance ratio is calculated by using the formula qi/riM, where qi is the charge of residue i in Coulombs, and riM is the distance from residue i to the bound metal ion as measured from the carbonyl carbon of Asp and Glu or the terminal nitrogen of Arg and Lys. For Arg, the distance is the average of the measure from both terminal nitrogens.
 |
(2) |
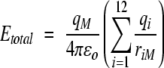
where Etotal is the electrostatic energy from the loop on a particular bound ion, ɛo is the permittivity of free space, qM is the charge on the ion, qi is the charge on loop residue i, and riM is the distance between the bound ion and the charge center of each residue. In the case of Glu and Asp, the charge center was placed on the side-chain carboxyl carbon; for Arg, the charge was placed on the average distance as measured from the two terminal nitrogens of the side chain; and for Lys, the charge was placed on the terminal nitrogen of the side chain. Each value is listed below the residue it corresponds to, and the total is summed at the end of the row. It should be noted that this electrostatic model does not take into consideration dielectric compensation of the protein and solvent, and it assumes that all groups are fully ionized and the structure does not vary.
When the loop is examined, it can be seen that the phenomenon of lanthanide binding order follows the decrease of net negative charge and charge/distance ratio of the residues. This is also true when considering the effective charge at the ion binding site. This seems to be an adequate explanation for the observed results, given that the similar size of the lanthanide ions to the calcium ion would indicate that this preference for the lanthanide by cTnC is driven solely by the greater positive charge density of the lanthanide. This has been proposed to be the case in other systems (Atreya et al. 2003). Thus, it seems quite reasonable to expect such a positive charge density–driven replacement of a bound ion to result in sites with a greater net negative charge being filled first.
The results of the Ce3+ titration of sTnC, however, seem to differ with this explanation. In Table 1B, the net charge of the ion-binding loops of sTnC seems to be in the order of II → III → I and IV, from most to least negative. When the effective charge at the bound ion is examined, the trend appears to be the same. Given the above charge/density explanation, one would expect to see G72 disappearing first, followed by G112, but in Figure 4 ▶ we see G36 vanishing followed by G72. Note that G72 also begins to vanish before G36 is completely gone, as does G112, indicating that although a preference is present, it is quite small. This result contradicts the previously published fluorescence-based work on sTnC, which states that the binding order would be C-domain first then N-domain (Leavis et al. 1980). The aforementioned work, however, could not distinguish between Y10 and Y109 fluorescence in rabbit sTnC, which was later shown to have disparate contributions to the total observed fluorescence (Keleti et al. 1994). It would appear then that although electrostatics plays a significant role in the binding of lanthanides to troponin C, there are other factors, such as binding cooperativity, ligand coordination, or even charge repulsion from bound ions, that influence the order in which these ions bind to the protein.
With one bound Yb3+, it was possible to confer partial alignment on bound 15N-cTnI129–148 and measure small RDCs. The size of the RDCs could be due to several factors, given the conditions under which they were measured. First, the amount of Yb3+ bound to cTnC was 0.6 molar equivalents, and so, only ~60% of the molecules in solution would experience some sort of partial alignment. One could choose a paramagnetic ion with a higher magnetic moment such as Ho3+ or Dy3+, which could induce a higher degree of alignment upon binding to the protein. Another factor could be that cTnI129–148 has only one structured area when bound to cTnC. The remaining unstructured area, the C-terminal end of the peptide, has a great deal of mobility, and thus, even if an overall magnetic susceptibility tensor is conferred on the complex, the degree of local alignment of these residues in the peptide could be minimal. Finally, the degree of flexibility in the linker helix of cTnC could have an effect on the degree of local alignment of the peptide residues. This could be overcome by using a longer peptide or intact cTnI to add rigidity to the complex by tying the N- and C-domains of cTnC. Despite the lack of RDCs large enough to calculate a three-dimensional structure, it was possible to note the areas of the peptide that were more structured. (Fig. 6 ▶) An outline of the secondary structure of the peptide can be seen even from the weak RDCs collected when plotted against the sequence of the peptide.
In the end, by determining the order of lanthanide binding, it is possible to create a troponin species containing one paramagnetic center, which can be used to confer partial alignment on a bound ligand to obtain orientation-based restraints for structure calculation. Although it was relatively easy to determine the binding order necessary for the creation of the paramagnetic species, predicting this binding order is not quite as simple. Although understanding the electrostatics of the ion-binding loop is essential, there are many other factors that also have a hand in governing the binding of an ion that were not addressed in the proposed model. The degree to which these factors influence this phenomenon determines how easily simple electrostatics can be used to predict ion binding order in any such protein. Also, from what was learned about lanthanide occupancy in the troponin isoforms, it can be concluded that the behavior of the isoforms should not be assumed to be similar with respect to their ion-binding abilities. This also speaks to the manner by which different ions bind to each isoform. When metal ions are used so often in biophysical chemistry as probes, or other means to obtain measurements in proteins, care should be taken in understanding their binding order sufficiently.
Materials and methods
Sample preparation
Recombinant human cTnC (residues 1–161) with the mutations C35S and C84S (denoted cTnC [C35S, C84S]), and chicken sTnC (residues 1–163), in which C101 was not mutated, were used in this study. Hereafter, the cysteine-less version of cTnC will be referred to as cTnC for simplicity. The cTnC (C35S, C84S) expression vector was constructed as described previously (Li et al. 2002) and was expressed, purified, and isotopically labeled in BL21(DE3)pLysS cell, as described previously for 15N-cTnC N-domain (Li et al. 1997) with decalcification performed by using 200 mM EDTA instead of 100 mM. The higher concentration of EDTA helped to remove any tightly bound metal ions in the C-domain of cTnC. The process used in the expression and purification of the chicken sTnC is as previously described (Slupsky and Sykes 1995), with the exception that iodoacetamide was not added to prevent Cys oxidation. The cTnI peptide, cTnI129–148 TQKIFDLRGKFKRPTLRRVR-hSer, was prepared as a fusion protein with GB1 by using recombinant techniques and separated via CNBr cleavage. The expression and purification of the 15N-cTnI129–148 in BL21-DE3(pLysS) cells were as described previously (Lindhout et al. 2002, 2003; Lindhout and Sykes 2003). The peptide sequence was confirmed by DNA sequencing, and the mass was verified by MALDI-TOF mass spectrometry.
All NMR samples were 500 μL in volume. The buffer conditions were 100 mM KCl, 10 mM imidazole, 0.2 mM 2,2-dimethyl-2-silapentanesulfonic acid (DSS), and 0.01% NaN3 in 90% H2O/10% D2O, and the pH was 6.7. The concentration of the apo 15N-cTnC sample used for Ce3+ titration was determined by amino acid analysis to be 0.87 mM (Smillie and Nattriss 1990). By using the same methods, the concentration of the 15N-cTnC sample used for the cTnI129–148 titration was 0.56 mM. Each of the samples contains ~3 to 5 mM CaCl2.
Lanthanide titrations of cTnC
Stock solutions of 100 mM CaCl2, standardized by atomic absorption spectroscopy, and 284 mM CeCl3 were used for the titration. The stock solution of CeCl3 was prepared from solid by dissolution of CeCl3•5H2O in distilled H2O. A 100-fold diluted sample of the stock solution, combined with 0.05% xylenol orange dye, was then calibrated via titration with EDTA. To an NMR tube containing a 500 μL sample of 0.89 mM 15N-cTnC, 13.5 μL of stock CaCl2 solution diluted to 89 mM were added and thoroughly mixed. For a total of 30 additions following, 0.5 μL aliquots of stock CeCl3 solution diluted to 0.89 mM were added, mixing thoroughly after each addition. All protein concentrations were determined via amino acid analysis. The total volume increase was 28.5 μL, and the change in protein concentration due to dilution was taken into account for data analysis. An acidic change in pH of ~0.3 units due to the Ca2+ and Ce3+ additions was noted. Both 1D 1H and 2D {1H, 15N} HSQC NMR spectra were acquired at 500 MHz at every titration point. This was repeated for both TbCl3 and YbCl3, with concentrations of 158.08 and 497.13 mM, respectively.
Lanthanide titration of sTnC
Stock solutions of 100 mM CaCl2 and 284 mM CeCl3 were used for the titration and were standardized as above. To an NMR tube containing a 500 μL sample of 0.92 mM 15N-sTnC, 18 μL of stock CaCl2 solution diluted to 92 mM was added and thoroughly mixed. For a total of 30 additions following, 0.5 μL aliquots of stock CeCl3 solution diluted to 0.92 mM were added, with mixing thoroughly after each addition. All protein concentrations were determined by amino acid analysis. The total volume increase was 38 μL, and the change in protein concentration due to dilution was taken into account for data analysis. An acidic change in pH of ~0.2 units due to the Ca2+ and Ce3+ additions was noted. Both 1D 1H and 2D {1H, 15N} HSQC NMR spectra were acquired at 500 MHz at every titration point. This titration was repeated up to 15 additions with TbCl3, from a stock solution of concentration 158.08 mM standardized in the same manner as that of CeCl3, using a protein concentration of 0.61 mM and a TbCl3 stock dilution to 61 mM.
Yb3+ Titration of cTnC•3Ca2+•15N-cTnI129–148
Stock solutions of 100 mM CaCl2 and 497 mM YbCl3, and 50 mM 15N-cTnI129–148 were used for the titration. The concentration of the 15N-cTnI129–148 solution was determined by amino acid analysis. To an NMR tube containing a 500 μL sample of 0.50 mM 15N-cTnC, 13.5 μL of stock CaCl2 solution diluted to 56 mM were added and thoroughly mixed. Following this, five 1 μL aliquots of 15N-cTnI129–148 solution were added, mixing thoroughly after each addition, up to one molar equivalent of cTnC. Both 1D 1H and 2D {1H, 15N} HSQC NMR spectra were acquired at 500 MHz at every titration point. Stock YbCl3 solution was diluted to 60 mM and added in 0.2 μL additions while monitoring G70, G110, and G146 resonances by 1D 1H NMR at 500 MHz. The titration was stopped after 12 additions when the first sign of a loss of intensity of G110 was noted to minimize the amount of Yb3+ in the C-domain. The total volume increase was 20.9 μL, and the change in protein concentration due to dilution was taken into account for data analysis. An acidic change in pH of ~0.3 units due to the Ca2+, cTnI129–148, and Yb3+ additions was noted. Both 2D {1H, 15N} HSQC and 2D {1H, 15N} IPAP NMR spectra were acquired at 600 and 800 MHz.
NMR spectroscopy
All of the NMR spectra were obtained at 30°C by using Varian Unity 600 MHz and Varian INOVA 500-MHz and 800-MHz spectrometers. 2D {1H,15N} HSQC NMR spectra were acquired by using the sensitivity-enhanced gradient pulse scheme developed by Lewis Kay and coworkers (Kay et al. 1992; Zhang et al. 1994). The 1H and 15N sweep widths were 7500 and 1500 Hz, respectively, on the 500-MHz spectrometer; 8000 and 1650 Hz, respectively, on the 600-MHz spectrometer; and 12,000 and 2200 Hz, respectively, on the 800-MHz spectrometer. 2D {1H,15N} IPAP NMR spectra were acquired by using 3919 WATERGATE suppression pulse scheme (Ottiger et al. 1998). All spectra were processed and analyzed by using VNMR (Varian Associates), NMRPipe (Delaglio et al. 1995), and NMRView (Johnson and Blevins 1994) and were referenced according to the IUPAC conventions.
Acknowledgments
We thank Gerry McQuaid for maintaining the 500- and 600-MHz spectrometers, as well as David Corson and Angela Theissen for expressing and purifying the cTnC and sTnC proteins. We would also like to thank the staff at the National High Field Nuclear Magnetic Resonance Center (NANUC) in Edmonton, Alberta, Canada, for their assistance in collecting the 800-MHz data. This work was generously supported by the Canada Research Chairs Program/Chair in Structural Biology (CRC), a Canadian Institutes of Health Research Graduate Studentship (CIHR), and an Alberta Heritage Fund for Medical Research Graduate Fellowship (AHFMR).
The publication costs of this article were defrayed in part by payment of page charges. This article must therefore be hereby marked “advertisement” in accordance with 18 USC section 1734 solely to indicate this fact.
Abbreviations
TnC, troponin C
cTnC, cardiac muscle TnC
sTnC, skeletal muscle TnC
TnI, troponin I
cTnI, cardiac muscle TnI
cTnI129–148, cTnI peptide (residues 129–148)
HSQC, heteronuclear single quantum coherence
IPAP, inphase antiphase HSQC
Article and publication are at http://www.proteinscience.org/cgi/doi/10.1110/ps.03412704.
References
- Atreya, H.S., Mukherjee, S., Chary, K.V.R., Lee, Y.M., and Luchinat, C. 2003. Structural basis for sequential displacement of Ca2+ by Yb3+ in a protozoan EF-hand calcium binding protein. Protein Sci. 12 412–425. [DOI] [PMC free article] [PubMed] [Google Scholar]
- Barbieri, R., Bertini, I., Cavallaro, G., Lee, Y.M., Luchinat, C., and Rosato, A. 2002. Paramagnetically induced residual dipolar couplings for solution structure determination of lanthanide binding proteins. J. Am. Chem. Soc. 124 5581–5587. [DOI] [PubMed] [Google Scholar]
- Bertini, I., Felli, I.C., and Luchinat, C. 2000. Lanthanide induced residual dipolar couplings for the conformational investigation of peripheral (NH2)-15N moieties. J. Biomol. NMR 18 347–355. [DOI] [PubMed] [Google Scholar]
- Bertini, I., Luchinat, C., and Parigi, G. 2001. Solution NMR of paramagnetic molecules. Elsevier Science, The Netherlands.
- Biekofsky, R.R., Muskett, F.W., Schmidt, J.M., Martin, S.R., Browne, J.P., Bayley, P.M., and Feeney, J. 1999. NMR approaches for monitoring domain orientations in calcium-binding proteins in solution using partial replacement of Ca2+ by Tb3+. FEBS Lett. 460 519–526. [DOI] [PubMed] [Google Scholar]
- Contreras, M.A., Ubach, J., Millet, O., Rizo, J., and Pons, M. 1999. Measurement of one bond dipolar couplings through lanthanide-induced orientation of a calcium-binding protein. J. Am. Chem. Soc. 121 8947–8948. [Google Scholar]
- Delaglio, F., Grzesiek, S., Vuister, G.W., Zhu, G., Pfeifer, J., and Bax, A. 1995. NMRPipe: A multidimensional spectral processing system based on UNIX pipes. J. Biomol. NMR 6 277–293. [DOI] [PubMed] [Google Scholar]
- Dvoretsky, A., Abusamhadneh, E.M., Howarth, J.W., and Rosevear, P.R. 2002. Solution structure of calcium-saturated cardiac troponin C bound to cardiac troponin I. J. Biol. Chem. 277 38565–38570. [DOI] [PubMed] [Google Scholar]
- Farah, C.S. and Reinarch, F.C. 1995. The troponin complex and regulation of muscle contraction. FASEB J. 9 755–767. [DOI] [PubMed] [Google Scholar]
- Feeney, J., Birdsall, B., Bradbury, A.F., Biekofsky, R.R., and Bayley, P.M. 2001. Calmodulin tagging provides a general method of using lanthanide induced magnetic field orientation to observe residual dipolar couplings in proteins in solution. J. Biomol. NMR 21 41–48. [DOI] [PubMed] [Google Scholar]
- Gagné, S.M., Tsuda, S., Li, M.X., Smillie, L.B., and Sykes, B.D. 1995. Structures of the troponin C regulatory domains in the apo and calcium-saturated states. Nat. Struct. Biol. 2 784–789. [DOI] [PubMed] [Google Scholar]
- Gagné, S.M., Li, M.X., McKay, R.T., and Sykes, B.D. 1998. The NMR angle on troponin C. Biochem. Cell. Biol. 76 302–312. [DOI] [PubMed] [Google Scholar]
- Geeves, M.A. and Holmes, K.C. 1999. Structural mechanism of muscle contraction. Annu. Rev. Biochem. 68 687–728. [DOI] [PubMed] [Google Scholar]
- Gordon, A.M., Homsher, E., and Regnier, M. 2000. Regulation of contraction in striated muscle. Physiol. Rev. 80 853–924. [DOI] [PubMed] [Google Scholar]
- Johnson, A.J. and Blevins, R.A. 1994. NMR View: A computer program for the visualization and analysis of NMR data. J. Biomol. NMR 4 603–614. [DOI] [PubMed] [Google Scholar]
- Johnson, J.D., Collins, J.H., Robertson, S.P., and Potter, J.D. 1980. A fluorescent-probe study of Ca2+ binding to the Ca2+-specific sites of cardiac troponin and troponin-C. J. Biol. Chem. 255 11688–11693. [PubMed] [Google Scholar]
- Kay, L.E., Keifer, P., and Saarinen, T. 1992. Pure absorption gradient enhanced heteronuclear single quantum correlation spectroscopy with improved sensitivity. J. Am. Chem. Soc. 114 10663–10665. [Google Scholar]
- Keleti, D., Rao, V.G., Su, H., Akella, A.B., Ding, X.L., and Gulati, J. Disparate contributions of Tyr10 and Tyr109 to fluorescence intensity of rabbit skeletal muscle troponin C identified using a genetically engineered mutant. FEBS Lett. 354 135–139. [DOI] [PubMed]
- Leavis, P.C., Nagy, B., Lehrer, S.S., Bialkowska, H., and Gergely, J. 1980. Terbium binding to troponin-C: Binding stoichiometry and structural-changes induced in the protein. Arch. Biochem. Biophys. 200 17–21. [DOI] [PubMed] [Google Scholar]
- Lee, L. and Sykes, B.D. 1983. Use of lanthanide-induced nuclear magnetic-resonance shifts for determination of protein-structure in solution: EF calcium-binding site of carp parvalbumin. Biochemistry 22 4366–4373. [DOI] [PubMed] [Google Scholar]
- Li, M.X., Gagné, S.M., Spyracopoulos, L., Kloks, C.P.A.M., Audette, G., Chandra, M., Solaro, R.J., Smillie, L.B., and Sykes, B.D. 1997. NMR studies of Ca2+-binding to the regulatory domains of cardiac and E41A skeletal muscle troponin C reveal importance of site I to energetics of the induced structural changes. Biochemistry 36 12519–12525. [DOI] [PubMed] [Google Scholar]
- Li, M.X., Spyracopoulos, L., and Sykes, B.D. 1999. Binding of cardiac troponin-I147–163 induces a structural opening in human cardiac troponin-C. Biochemistry 38 8289–8298. [DOI] [PubMed] [Google Scholar]
- Li, M.X., Saude, E.J., Wang, X., Pearlstone, J.R., Smilie, L.B., and Sykes, B.D. 2002. Kinetic studies of calcium and cardiac troponin I peptide binding to human cardiac troponin C using NMR spectroscopy. Eur. Biophys. J. 31 245–256. [DOI] [PubMed] [Google Scholar]
- Lindhout, D.A. and Sykes, B.D. 2003. Structure and dynamics of the C-domain of human cardiac troponin C in complex with the inhibitory region of human cardiac troponin I. J. Biol. Chem. 29 27024–27034. [DOI] [PubMed] [Google Scholar]
- Lindhout, D.A., Li, M.X., Schieve, D., and Sykes, B.D. 2002. Effects of T142 Phosphorylation and mutation R145G on the interaction of the inhibitory region of human cardiac troponin I with the C-domain of human cardiac troponin C. Biochemistry 41 7267–7274. [DOI] [PubMed] [Google Scholar]
- Lindhout, D.A., Thiessen, A., Schieve, D., and Sykes, B.D. 2003. High-yield expression of isotopically labeled peptides for use in NMR studies. Protein Sci. 12 1786–1791. [DOI] [PMC free article] [PubMed] [Google Scholar]
- McKay, R.T., Tripet, B.P., Pearlstone, J.R., Smillie, L.B., and Sykes, B.D. 1999. Defining the region of troponin-I that binds to troponin-C. Biochemistry 38 5478–5489. [DOI] [PubMed] [Google Scholar]
- McKay, R.T., Saltibus, L.F., Li, M.X., and Sykes, B.D. 2000. Energetics of the induced structural change in a Ca2+ regulatory protein: Ca2+ and troponin I peptide binding to the E41A mutant of the N-domain of skeletal troponin C. Biochemistry 39 12731–12738. [DOI] [PubMed] [Google Scholar]
- Ottiger, M., Delaglio, F., and Bax, A. 1998. Measurement of J and dipolar couplings from simplified two-dimensional NMR spectra. J. Magn. Res. 131 373–378. [DOI] [PubMed] [Google Scholar]
- Permi, P., Rosevear, P.R., and Annila, A. 2000. A set of HNCO-based experiments for measurement of residual dipolar couplings in N-15, C-13, (H-2)-labeled proteins. J. Biomol. NMR 17 43–54. [DOI] [PubMed] [Google Scholar]
- Potter, J.D. and Gergley, J. 1975. The calcium and magnesium binding sites on troponin and their role in the regulation of myofibrillar adenosine triphosphatase. J. Biol. Chem. 250 4628–4633. [PubMed] [Google Scholar]
- Putkey, J.A., Sweeney, H.L., and Campbell, S.T. 1989. Site-directed mutation of the trigger calcium-binding sites in cardiac troponin C. J. Biol. Chem. 264 12370–12378. [PubMed] [Google Scholar]
- Robertson, S.P., Johnson, J.D., and Potter, J.D. 1981. The time-course of Ca2+ exchange with calmodulin, troponin, parvalbumin, and myosin in response to transient increases in Ca2+. Biophys. J. 34 559–569. [DOI] [PMC free article] [PubMed] [Google Scholar]
- Sheng, Z., Pan, B.S., Miller, T., and Potter, J.D. 1992. Isolation, expression, and mutation of a rabbit skeletal muscle cDNA clone for troponin I. J. Biol. Chem. 267 25407–25413. [PubMed] [Google Scholar]
- Sia, S.K., Li, M.X., Spyracopoulos, L., Gagné, S.M., Liu, W., Putkey, J.A., and Sykes, B.D. 1997. NMR structure of cardiac troponin C reveals an unexpected closed regulatory domain. J. Biol. Chem. 272 18216–18221. [DOI] [PubMed] [Google Scholar]
- Slupsky, C.M. and Sykes, B.D. 1995. NMR solution structure of calcium-saturated skeletal muscle troponin C. Biochemistry 34 15953–15964. [DOI] [PubMed] [Google Scholar]
- Smillie, L.B. and Nattriss, M. 1990. HPLC of peptides and proteins: Separation, analysis, and conformation. In Amino acid analyses of proteins and peptides: An overview (eds. C. Mant and R. Hodges), pp. 809–821. CRC Press, Boca Raton, FL.
- Solaro, R.J. and Rarick, H.M. 1998. Troponin and tropomyosin: Proteins that switch on and tune in the activity of cardiac myofilaments. Circ. Res. 83 471–480. [DOI] [PubMed] [Google Scholar]
- Spyracopoulos, L., Li, M.X., Sia, S.K., Gagné, S.M., Chandra, M., Solaro, R.J., and Sykes, B.D. 1997. Calcium-induced structural transition in the regulatory domain of human cardiac troponin C. Biochemistry 36 12138–12146. [DOI] [PubMed] [Google Scholar]
- Spyracopoulos, L., McKay, R.T., and Sykes, B.D. 2000. Structure of skeletal troponin-C in complex with skeletal troponin-I 115–131: Comparison to cardiac troponin-C-troponin-I 147–163 complex. Biophys. J. 78 434A. [Google Scholar]
- Tjandra, N., Grzesiek, S., and Bax, A, 1996. Magnetic field dependence of nitrogen-proton J splittings in 15N-enriched human ubiquitin resulting from relaxation interference and residual dipolar coupling. J. Am. Chem. Soc. 118 6264–6272. [Google Scholar]
- Tolman, J.R., Flanagan, J.M., Kennedy, M.A., and Prestegard, J.H. 1995. Nuclear magnetic dipole interactions in field-oriented proteins: Information for structure determination in solution. Proc. Natl. Acad. Sci. 92 9279–9283. [DOI] [PMC free article] [PubMed] [Google Scholar]
- Tsuda, S., Hasegawa, Y., Yoshida, M., Yagi, K., and Hikichi, K. 1988. Nuclear magnetic-resonance study on rabbit skeletal troponin-C: Calcium-induced conformational change. Biochemistry 27 4120–4126. [DOI] [PubMed] [Google Scholar]
- van Eerd, J.P. and Takahashi, K. 1975. The amino acid sequence of bovine cardiac troponin-C: Comparison with rabbit skeletal troponin-C. Biochem. Biophys. Res. Commun. 64 122–127. [DOI] [PubMed] [Google Scholar]
- Wang, C.A., Leavis, P.C., Horrocks, W.D., and Gergely, J. 1981. Binding of lanthanide ions to troponin C. Biochemistry 20 2439–2444. [DOI] [PubMed] [Google Scholar]
- Zhang, O., Kay, L.E., Olivier, J.P., and Forman-Kay, J.D. 1994. Backbone 1H and 15N resonance assignments of the N-terminal SH3 domain of drk in folded and unfolded states using enhanced-sensitivity pulsed field gradient NMR techniques. J. Biomol. NMR 4 845–858. [DOI] [PubMed] [Google Scholar]