Abstract
The Archaeoglobus fulgidis gene RS27_ARCFU encodes the 30S ribosomal protein S27e. Here, we present the high-quality NMR solution structure of this archaeal protein, which comprises a C4 zinc finger motif of the CX2CX14-16CX2C class. S27e was selected as a target of the Northeast Structural Genomics Consortium (target ID: GR2), and its three-dimensional structure is the first representative of a family of more than 116 homologous proteins occurring in eukaryotic and archaeal cells. As a salient feature of its molecular architecture, S27e exhibits a β-sandwich consisting of two three-stranded sheets with topology B(↓), A(↑), F(↓), and C(↑), D(↓), E(↑). Due to the uniqueness of the arrangement of the strands, the resulting fold was found to be novel. Residues that are highly conserved among the S27 proteins allowed identification of a structural motif of putative functional importance; a conserved hydrophobic patch may well play a pivotal role for functioning of S27 proteins, be it in archaeal or eukaryotic cells. The structure of human S27, which possesses a 26-residue amino-terminal extension when compared with the archaeal S27e, was modeled on the basis of two structural templates, S27e for the carboxy-terminal core and the amino-terminal segment of the archaeal ribosomal protein L37Ae for the extension. Remarkably, the electrostatic surface properties of archaeal and human proteins are predicted to be entirely different, pointing at either functional variations among archaeal and eukaryotic S27 proteins, or, assuming that the function remained invariant, to a concerted evolutionary change of the surface potential of proteins interacting with S27.
Keywords: RS27_ARCFU, high-throughput NMR, structural genomics, 30S ribosomal protein, zinc finger, Archaeoglobus fulgidis
Structural genomics aims at the systematic exploration of protein fold space, with the long-range goal of making the three-dimensional atomic level structure of most proteins easily available form knowledge of the corresponding DNA sequences. In the United States, nine research networks (consortia) are supported through the Protein Structure Initiative set forth by the National Institutes of Health. Among those is the Northeast Structural Genomics Consortium (NEGSC, http://www.nesg.org). In addition to utilizing high-throughput X-ray crystallography, the NESGC is strongly committed to the development of improved NMR (e.g., Montelione et al. 2000; Szyperski et al. 2002; Xia et al. 2002; Yee et al. 2002; Kim and Szyperski 2003; Zheng et al. 2003) and structural bioinformatics methodology (Goldsmith-Fischman and Honig 2003) for structural genomics.
Here, we report the NMR solution structure of the protein S27e encoded in gene RS27_ARCFU of Archaeoglobus fulgidis (Klenk et al. 1997). S27e is a 30S ribosomal protein and was selected as NESGC target GR2, representing a family of more than 116 sequence homologs from eukaryotic and archaebacterial organisms (Fig. 1 ▶). Atomic resolution structures have recently been solved for the large subunit of an archaeal ribosome (Ban et al. 2000), as well as the small subunit of a bacterial ribosome (Schluenzen et al. 2000; Brodersen et al. 2002). Most importantly, however, bacterial ribosomes do not contain a S27 homolog. Hence, the S27e structure determination was targeted by the NESGC in order to provide (1) a high-leverage value—that is, a large number of homology models derived from the experimentally determined structure, and (2) novel insights into the operation of the eukaryotic ribosome. Evidently, (1) meets with a primary goal of structural genomics, that is, the exploration of fold space. Because ribosomal proteins operate in the context of the large macromolecular assembly of the ribosome, their function may not be readily inferred from structure alone. Nonetheless, the isolated ribosomal proteins appear to be valuable structural (genomics) targets; many ribosomal proteins retain their RNA-binding specificities and/or have functions outside of the ribosome (Ramakrishnan and White 1998), and the assessment of conformational changes upon ribosome formation promises to lead to new insights into protein–protein and protein–RNA interactions.
Figure 1.
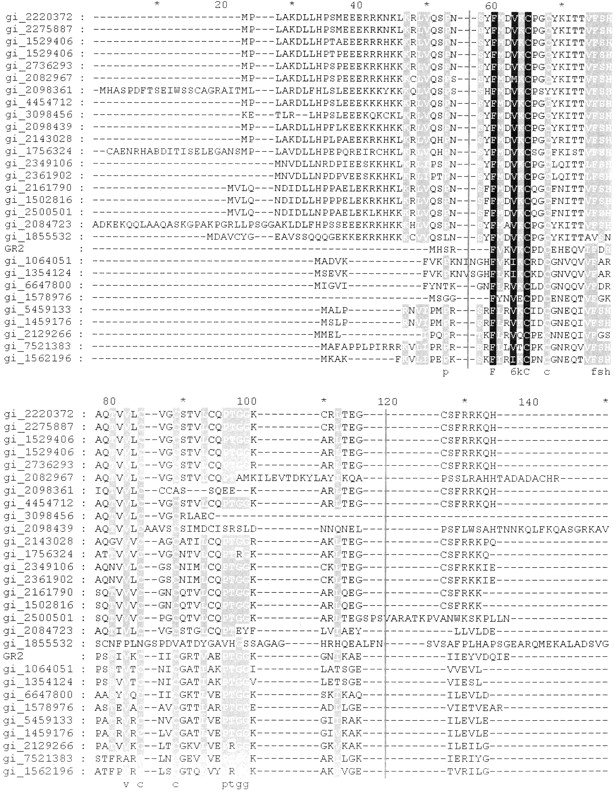
Multiple sequence alignment of RS27_ARCFU ending S27e with eukaryotic and archaebacterial homologs as detected by a PSI-BLAST search (Altschul et al. 1997). Note that eukaryotic sequences have an amino-terminal extension. The thin black lines at positions 56 and 120 denote the alignment used in the program ConSurf (Armon et al. 2001; Glaser et al. 2003), which maps sequence conservation to the surface of a representative structure (Fig. 5 ▶).
Ribosomes represent the central unit of the protein-synthesizing machinery of living cells and consist roughly of two-thirds RNA and one-third protein. The ribosomal proteins are named according to the subunit to which they belong (small subunit: S1 to S31; large subunit: L1 to L44), and they cover a large variety of structural and functional roles (Ramakrishnan and White 1998). In particular, eukaryotic ribosomal protein S27 has been reported to be involved in rRNA processing (BaudinBaillieu et al. 1997), the degradation of damaged mRNAs (Revenkova et al. 1999), as well as direct binding to mRNA (Takahashi et al. 2002). However, the structural basis of S27–RNA interactions remains to be explored. Moreover, the X-ray structures of the large (Ban et al. 2000) and small ribosomal subunits (Schluenzen et al. 2000; Brodersen et al. 2002) reveal that ribosomal proteins may interact with both other proteins and ribonucleic acids. This may eventually be found for S27 proteins.
Several ribosomal proteins contain zinc finger motifs that may serve to mediate protein–RNA interactions (Frankel 2000), and the sequences of S27 genes from various species (Fig. 1 ▶) demonstrate that most of them are C4 zinc finger proteins of the CX2CX14-16CX2C class. It has been suggested that the S27 zinc finger may be a fossil from ancient evolution (Chan et al. 1993), that is, the zinc finger is possibly not anymore of functional importance for modern S27 proteins. This view is supported by the sequence alignment (Fig. 1 ▶) showing that the zinc finger motif is not strictly conserved. Moreover, the eukaryotic proteins have an amino-terminal extension when compared with their archaebacterial congeners. Taken together, it might thus be that eukaryotic and archaeal S27 proteins have evolved divergently in order to undertake different roles in their ribosomes.
Results and Discussion
NMR structure of S27e
A total of 669 conformationally restricting NOE distance constraints were derived from three-dimensional (3D) 15N-and 13C-resolved [1H,1H]-NOESY. In addition, 31 3JHNα coupling constants yielded Φ-angle constraints, and 60 backbone dihedral angle constraints were obtained from chemical-shift values (Cornilescu et al. 1999) for residues located in β-strands. Stereospecific assignments were obtained for one glycine α-methylene proton pair (25% of the pairs with nondegenerate chemical shifts), seven β-methylene proton pairs (23%), 15 more peripheral methylene proton pairs, and for all six valine isopropyl methyl groups. The resulting ensemble of 20 DYANA (Guntert et al. 1997) conformers, together with the corresponding NMR constraints, have been submitted to the PDB (1QXF).
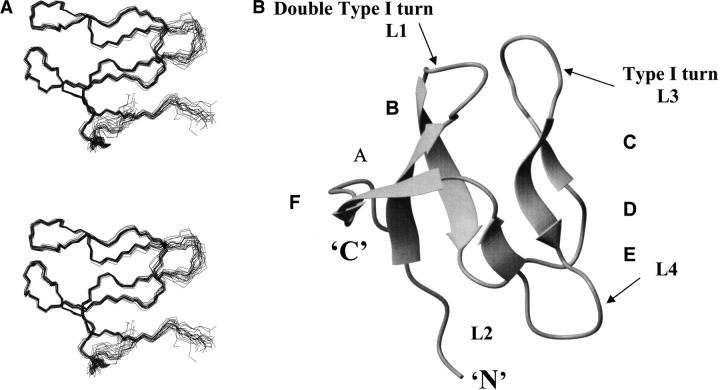
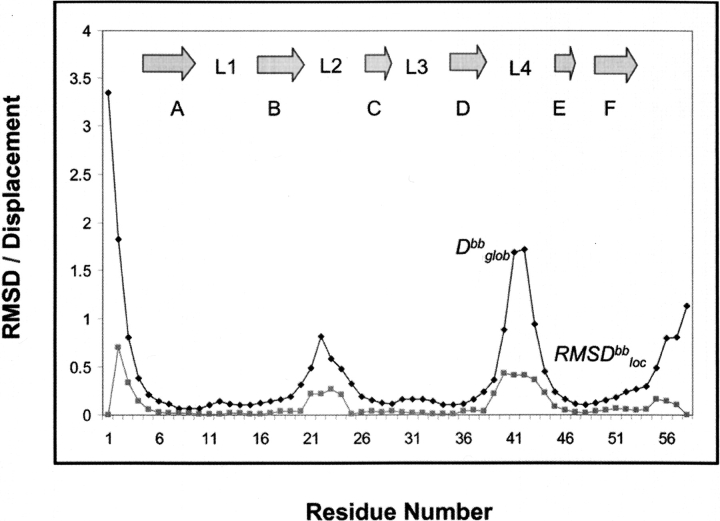
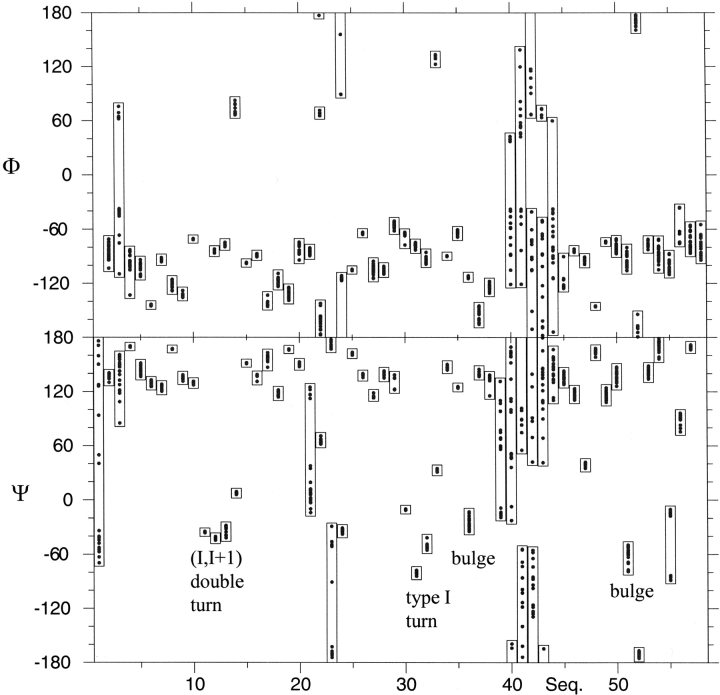
An illustration of the quality of the S27e structure is presented in Figure 2A ▶, which shows the polypeptide backbone of the 20 best DYANA conformers selected to represent the solution structure. The absence of any large constraint violations (Table 1) demonstrates that these experimental constraints are well satisfied in the set of 20 conformers, and the small RMSD values (Table 1) indicates a high-quality NMR structure. Furthermore, plots of local backbone RMSD values and global backbone displacements (Fig. 3 ▶) show (1) that the β-sheets are structurally very well defined, and (2) that increased local and global disorder is observed for the amino-terminal tetrapeptide segment, the two loops comprising residues 21–25 and 40–45, and the carboxy-terminal segment of residues 53–58. The high quality of the NMR structure is also reflected in the narrow ranges among the 20 DYANA conformers of most Φ and Ψ dihedral angles (Fig. 4 ▶).
Figure 2.
(A) The 20 DYANA conformers with the lowest residual DYANA target function chosen to represent the NMR solution structure of archaeal S27e are shown after superposition of the backbone heavy atoms N, Cα and C’ for minimal RMSD. (B) Ribbon diagram of the backbone of the DYANA conformer with the lowest residual target function.
Table 1.
Statistics for the final ensemble of 20 structures calculated for RS27_ARCFU
| Distance restraints | |
| Intraresidue | 228 |
| Sequential | 170 |
| Medium range (1 < |i − j| ≤ 5) | 79 |
| Long range (|i − j| > 5) | 192 |
| Hydrogen bond restraints | 0 |
| Total | 669 |
| Dihedral restraints | |
| Φ | 61 |
| Ψ | 30 |
| Total | 91 |
| Number of structural constraints per residue | 13 |
| Number of long range constraints per residue | 3 |
| Residual target function (Å2) | 0.52 ± 0.04 |
| Distance constraint violations per structure (>0.1 Å) | 0 |
| Dihedral constraint violations per structure (>5°) | 0 |
| RMSD relative to the mean coordinates (Å) | |
| All residuesa | |
| Backbone heavy atoms | 0.69 ± 0.17 |
| All heavy atoms | 1.10 ± 0.16 |
| Regular secondary structure elementsb | |
| Backbone heavy atoms | 0.17 ± 0.05 |
| All heavy atoms | 0.54 ± 0.09 |
| Ramachandran plot statistics (%)c | |
| Residues in most favored regions | 76.3 |
| Residues in additional allowed regions | 20.2 |
| Residues in generously allowed regions | 2.6 |
| Residues in disallowed regions | 0.9 |
a RMSD values for residues 1–58.
b Residues 5–9, 16–20, 27–28, 35–38, 45–46, 49–52.
c Determined using the program PROCHECK-NMR (Laskowski et al. 1996).
Figure 3.
Global displacement (Dbbglob) and local RMSD (RMSDbbloc) values calculated for the backbone heavy atoms N, Cα and C’ from the ensemble of the 20 best DYANA conformers of S27e (Fig. 2 ▶) are plotted vs. the amino acid sequence.
Figure 4.
Plot of Φ and Ψ value ranges vs. the amino acid sequence for the 20 best DYANA conformers of S27e (Fig. 2 ▶; Table 1). The ranges for the residues forming the (I,I+1) double turn (L1), the type I turn (L3), and the bulges are indicated.
Three-dimensional structure of S27e
As a salient feature of its molecular architecture, S27e exhibits a β-sandwich consisting of two three-stranded sheets with topology B(↓), A(↑), F(↓), and C(↑), D(↓), and E(↑) (Fig. 2B ▶). Both β-sheets have similar right-handed twists so that in the face-to-face arrangement the strands in the first sheet are almost parallel to those in the second one (Chothia et al. 1977). Notably, strands D and F have bulges at Thr 35–Val 36 and Ile 51–Glu 52, respectively. A double type I turn connecting β-strands A and B (loop L1) and a type I β-turn connecting strands C and D (loop L3) are structurally well defined (Figs. 3 ▶, 4 ▶) and located in close spatial proximity. Loops L1 and L3 contain the four cysteine residues of the zinc finger motif in a conformation required for zinc coordination, and the 13Cβ chemical shifts indicate that the cysteines are in reduced states (Atreya et al. 2000). The Φ and Ψ-dihedral angles of the double turn (L1; Fig. 4 ▶) are quite close to the ideal values (Hutchinson and Thornton 1994), whereas the Ψ dihedral angles of the type I turn (L3; Fig. 4 ▶) are somewhat more negative than expected (−80° and −51° instead of −30° and 0°). The two other loops, L2 connecting strands B and C, and L4 connecting strands D and E, are located on the opposite side of the β-sandwich with respect to L1 and L3, but on the same side as the amino- and carboxy-termini. L2 is moderately well defined, whereas the glycine-rich loop L4 (sequence: PTGGKG) is flexibly disordered in solution (Figs. 3 ▶, 4 ▶).
Novelty of S27e fold
First, no structural homologs were detected by searching S27e (Fig. 2 ▶) against the PDB using the programs CE (Shindyalov and Bourne 1998) or DALI (Holm and Sander 1993). Second, the structure of S27e has not yet been classified in CATH (Orengo et al. 1997), but a GRATH search yielded no structural homologs. Third, S27e could be assigned to the smaller protein class of the rubredoxin-like fold in the SCOP classification (Lo Conte et al. 2000). These proteins comprise a metal (zinc or iron)-bound fold, contain two CX(n)C motifs (in most cases n = 2) and the current SCOP classification encompasses 12 superfamilies. An automatic family pairwise search of the SCOP database gave by far the lowest e-value (3.5e-06) for the zinc beta-ribbon superfamily. However, interactive analysis reveals that the arrangement of secondary structure elements is unique in S27e. Taken together, these findings support our conclusion that S27e possesses a hitherto uncharacterized protein fold (Fig. 2 ▶).
Zinc finger motif
The threading program 3D-PSSM (Kelley et al. 1999) predicts that the sequence of S27e encoded in RS27_ARCFU is consistent with five structures deposited in the PDB (1FFK_W, 1GH9, 1PFT, 1QYP, and 1TFI), all of which have a potential zinc-binding site. Analysis of these five structures along with the structure of S27e using the structure alignment module in PrISM (Yang and Honig 1999) identifies 1GH9 as the closest structural neighbor of S27e, the RMSD is 3.2 Å over 50% of S27e (Fig. 5 ▶). 1GH9 corresponds to a 8.3-kD protein (gene Mth1184) from Methanobacterium thermoautotrophicum of unknown function, and consists of a β-sheet followed by an α-helix and an unstructured carboxyl terminus (Christendat et al. 2000). The β-sheet region contains a CXCX…XCXC sequence with Cys residues located in two proximal loops. However, zinc binding could not be experimentally verified, so that Christendat et al. (2000) hypothesize that there may be specificity for some other metal. Accordingly, although 1QXF and 1GH9 exhibit different folds, the putative metal-binding region of S27e is observed in 1GH9.
Figure 5.
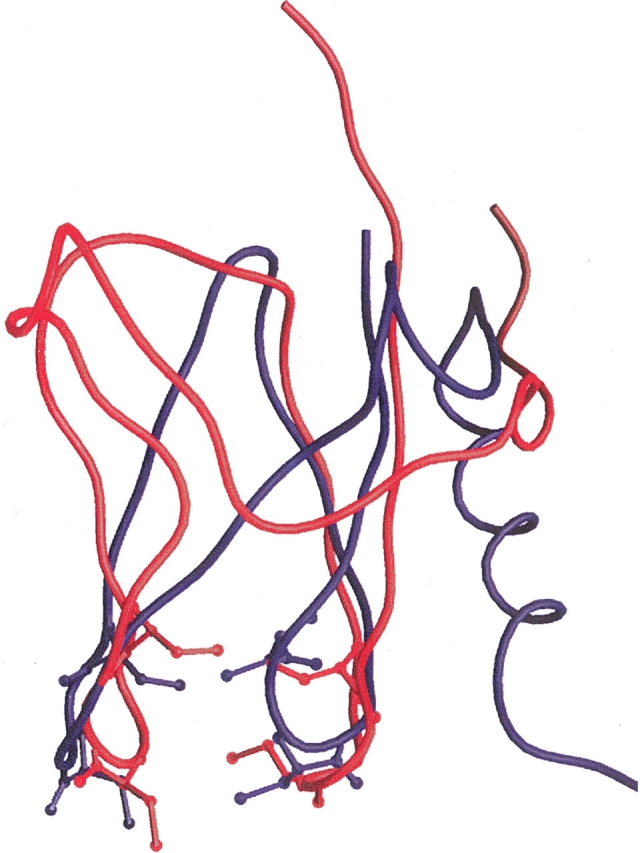
Structure superposition of S27e (red; Fig. 2 ▶) and 1GH9 (blue). The putative zinc-binding Cys residues are shown in ball-and-stick representation.
Identification of conserved structural motifs
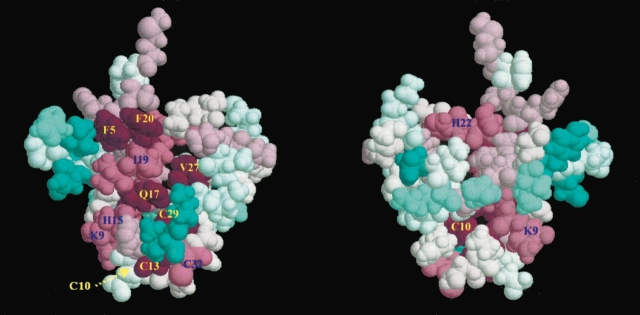
A PSI-BLAST search (Altschul et al. 1997) identified 116 sequence homologs to RS27_ARCFU, the gene encoding S27e, and additional homologs are likely to be identified as the genome-sequencing projects continue. A multiple sequence alignment was constructed of 30 representative sequences, including 19 eukaryotic and 11 archaeal homologs (Fig. 1 ▶). Subsequently, the sequence conservation reflected by this alignment was mapped onto the S27e structure using the program Consurf (Armon et al. 2001; Glaser et al. 2003). Two main conserved features emerge for the S27 family of sequence homologs, the putative zinc-binding region (Fig. 5 ▶) and a surface patch of hydrophobic residues consisting of Phe 5, Ile 19, Phe 20, and Val 27 in S27e (Fig. 6 ▶). When the eukaryotic and archaeal sequences are analyzed separately, one finds that the eukaryotic sequences have clusters of conserved basic residues that are missing in the archaeal sequences. Finally, there is a highly conserved four-residue fragment, Pro 39–Thr 40–Gly 41–Gly 42 (positions 96–99 in Fig. 1 ▶) located in the disordered loop L4 on the same side of the β-sheets as the aforementioned hydrophobic cluster, but on the opposite side of the β-sheets with respect to the putative zinc-binding region (Fig. 2 ▶).
Figure 6.
Multiple sequence alignment of Figure 1 ▶ analyzed by ConSurf (Armon et al. 2001; Glaser et al. 2003) using the NMR structure of archaeal S27e (Fig. 2 ▶). The most highly conserved residues are scored 9 and colored magenta, whereas the most variable sites are scored 1 and colored blue. Intermediately conserved residues are scored and colored on a graded scheme between these two extremes. The two views are rotated by 180 around the vertical axis with respect to each other. The hydrophobic patch formed by Phe 5, Ile 19, Phe 20, and Val 27 of S27e is readily apparent.
Homology modeling of human S27
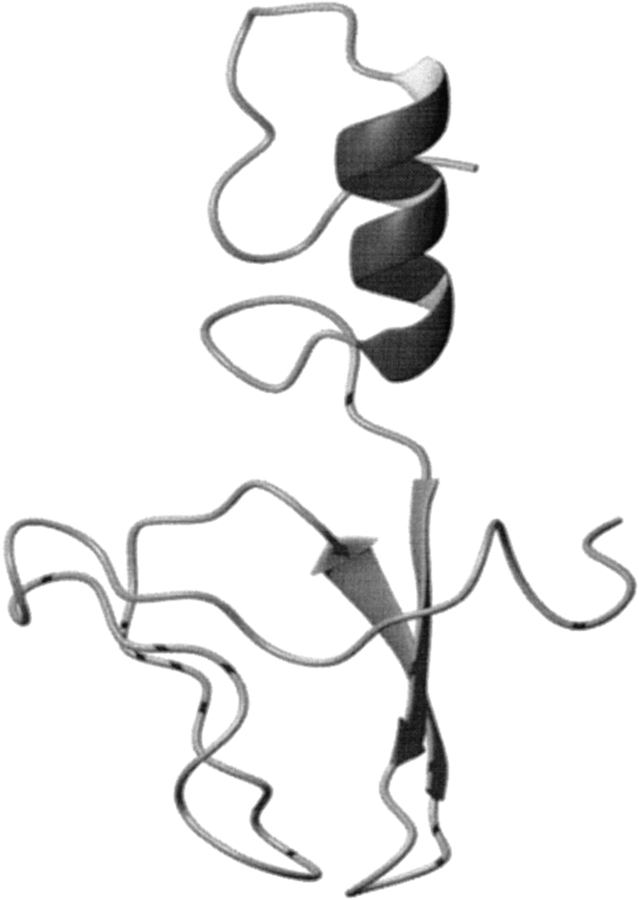
The human S27 (hS27) protein has a 26-residue amino-terminal extension relative to archaeal S27e (Fig. 1 ▶). A helix is predicted (Rost 1996) for residues 10–20 of hS27 with high confidence, and residues 13–23 were identified as a nuclear localization sequence. Consistent with the latter finding, the assembly of eukaryotic ribosomes is initiated in the cellular nucleus (Fromont-Racine et al. 2003). A model for the full-length human S27 (Fig. 7 ▶) was thus constructed using a composite approach based on two structural templates as follows: (1) the amino-terminal segment of the ribosomal protein L37Ae (1FFK:W), which contains a nuclear localization sequence and a helix in the expected location, for the amino-terminal 26 residues, and (2) the S27e structure (Fig. 2 ▶) for the carboxy-terminal domain. Notably, the Verify3D profile (Bowie et al. 1991; Luthy et al. 1992) indicates that the entire hS27 was modeled with high quality, possibly beset by some inaccuracy as far as the relative orientation of amino-terminal helix and carboxy-terminal domain is concerned.
Figure 7.
Ribbon representation of the homology model constructed for human S27 based on the structural templates of archaeal S27e (1QXF; Fig. 2 ▶) and the amino-terminal segment of the archaeal ribosomal protein L37Ae (1FFK:W).
Intriguingly, the electrostatic surface potentials calculated for the archaeal S27e and the hS27 model are strikingly different (Fig. 8 ▶). S27e has two large patches of negative electrostatic potential (red), whereas the human S27 model is predicted to be overall positively charged (blue). Comparison of the electrostatic surface potentials of models of other archaeal and eukaryotic congeners (Fig. 1 ▶) shows that this is generally observed when comparing an archael and an eukaryotic S27 protein.
Figure 8.
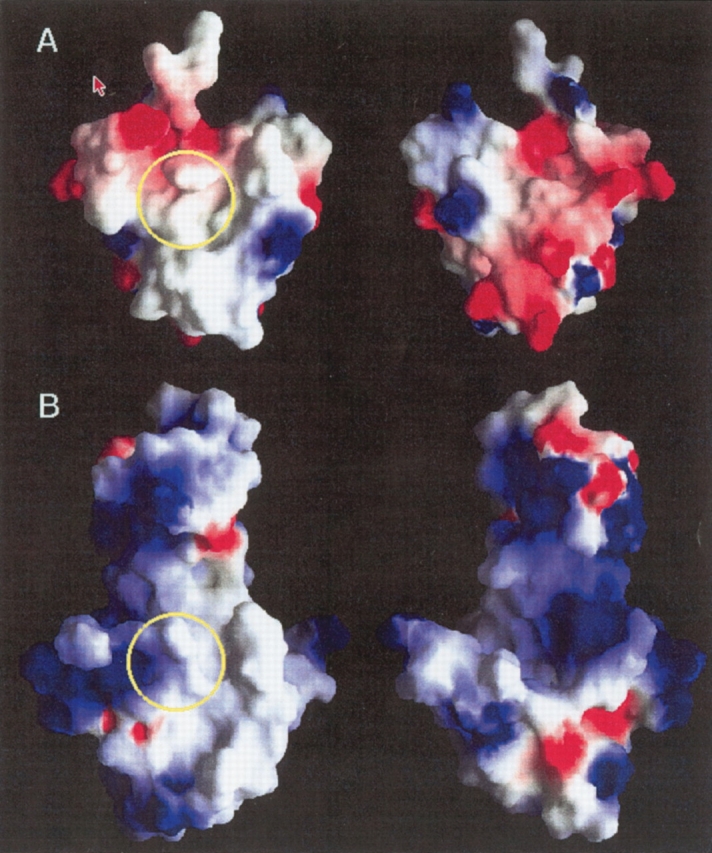
(A) Grasp (Nicholls et al. 1991) profiles representing the electrostatic surface potential of archaeal S27e. The scale of surface potentials is −5, 0, +5 kT/e with red (blue) corresponding to negative (positive) electrostatic potential. The left and right views are rotated by 180 about the vertical axis with respect to each other. (B) The same as in A for the homology model of human S27.
Conclusions
The conserved hydrophobic patch (Fig. 6 ▶) may well play a pivotal role for functioning of S27 proteins, be it in archaeal or eukaryotic cells. This finding suggests that the mode of operation of S27 proteins in the two kingdoms has common features. However, the dramatic change in the surface electrostatic potentials (Fig. 8 ▶) reveals the presence of ancient divergent evolution, which has led to either functional variations among archaeal and eukaryotic S27 proteins, or, assuming that the function remained invariant, to a concerted evolutionary change of the surface potential of proteins interacting with S27. The amino-terminal extension present in the eukaryotic S27 proteins appears to be required for nuclear ribosome assembly. In archaebacteria, the lack of compartmentation makes such a leader sequence evidently unnecessary. Most S27 proteins comprise a zinc finger (Fig. 1 ▶) capable of binding Zn or Fe ions. However, for YL37a (1FFK:W), which has been recruited to model hS27 (Fig. 7 ▶), three of the four cysteines could be replaced without noticeably affecting RNA binding or function in general (Dresios et al. 2002). Thus, it may well be that the zinc finger motifs that are highly conserved in the family of S27 proteins (Fig. 1 ▶) are indeed a vestigal structure characterizing ancient evolution of the ribosome before the divergence of archae and eubacteria lineages (Dresios et al. 2002).
Materials and methods
Protein purification
GR2 (RS27_ARCFU) was cloned, expressed, and purified following standard protocols to produce a uniformly (U) 13C,15N-labeled protein sample. Briefly, the full-length GR2 gene from Archaeglobus fulgidis was cloned into a pET21d (Novagen) derivative, yielding the plasmid pGR2-21. The resulting construct contains eight non-native residues at the carboxyl terminus (LEHHHHHH) that facilitate protein purification. Escherichia coli BL21 (DE3) pMGK cells, a rare codon enhanced strain, were transformed with pGR2-21, and cultured in MJ9 minimal medium containing (15NH4)2SO4 and U-13C-glucose as sole nitrogen and carbon sources (Jansson et al. 1996). U-13C,15N GR2 was purified using a two-step protocol consisting of Ni-NTA affinity (QIAGEN) and gel filtration (HiLoad 26/60 Superdex 75, Amersham Biosciences) chromatography. The final yield of purified U-13C,15N GR2 (>97% homogeneous by SDS-PAGE; 7.6 kD by MALDI-TOF mass spectrometry) was ~40 mg/L. In addition, a U-15N and 5% biosynthetically directed fractionally 13C-labeled sample was generated for stereospecific assignment of isopropyl methyl groups. The two samples, U-13C,15N and 5%13C,U-15N GR2, were prepared at concentrations of 1.0 mM in a 95% H2O/5% D2O solution containing 20 mM MES, 100 mM NaCl, 10 mM DTT, 5 mM CaCl2, and 0.02% NaN3 at pH 6.5.
NMR spectroscopy
All NMR data were collected at 25°C on a Varian INOVA 600 MHz spectrometer. Spectra were processed using the program PROSA (Guntert et al. 1992) or NMRPipe. (Delaglio et al. 1995) and subsequently analyzed using the program XEASY (Bartels et al. 1995). Resonance assignments were obtained from a minimal set of reduced-dimensionality NMR experiments (Szyperski et al. 2002) using 48 h of measurement time, including 3D Hα/βCα/β(CO)NHN (12 h), 3D HCCH COSY (20 h), and 3D HBCB(CGCD)HD (7 h), complemented by conventional 3D HNNCACB (5 h) and 3D HNNCO (3 h). Assignments were obtained for 97% of the backbone and 13Cβ, and 98% side-chain chemical shifts. Stereospecific assignments of prochiral methyl groups of Val and Leu were obtained from 2D [13C-1H] HSQC for the 5% fractionally 13C-labeled protein sample, which also supported the amino acid type identification (Neri et al. 1989; Szyperski et al. 1992). Chemical shifts have been deposited in the BMRB (accession no. 5682).
Structure calculation
NMR constraints were obtained from 3D HNNHA (Vuister and Bax 1993), from chemical shifts for residues in β-strands using the program TALOS (Cornilescu et al. 1999), 15N- and 13C-resolved [1H-1H] NOESY, and 2D [1H,1H]-NOESY (τm = 70 msec). NOE cross-peak assignments and volumes were obtained using the XEASY program. (Bartels et al. 1995). After obtaining the initial fold using the program DYANA (Guntert et al. 1997), the CANDID module within the CYANA program (Herrmann et al. 2002) was run in an iterative manner to obtain automated assignments and distance calibrations for the remaining NOEs. The program MolMol (Koradi et al. 1996) was used to analyze NMR structures and to generate figures.
Bioinformatics
The structure alignment module in PrISM (Yang and Honig 1999) was used to structurally superimpose S27e (Fig. 2 ▶) with the structures identified by searching the sequence of S27e against the PDB using the threading program 3D-PSSM (Kelley et al. 1999). PrISM identified 1GH9 as the closest structural neighbor with the following statistics:
 |
An RMSD of 3.2 Å over 50% of 1QXF suggests a significant superposition.
The first iteration of the PSI-BLAST search (Altschul et al. 1997) for homologs of the gene RS27_ARCFU encoding S27e in the nonredundant (nr) protein sequence database used the BLO-SUM62 substitution matrix (Henikoff and Henikoff 1992) and gap existence and extension penalties of 11 and 1, respectively. After the initial search, an e-value threshold of 0.001 was applied for including sequences to form the position-specific scoring matrix used in subsequent searches. The PSI-BLAST search converged after three iterations and yielded 116 sequence homologs.
The program ConSurf (Armon et al. 2001; Glaser et al. 2003) was used to map the sequence conservation reflected in the multiple sequence alignment of RS27_ARCFU (1QXF) with 29 representative sequence homologs, depicted in Figure 1 ▶, onto the RS27_ARCFU structure (Fig. 6 ▶). The level of sequence conservation at each position of the multiple sequence alignment is represented by coloring each residue in the structure according to the graded scheme described in the legend to Figure 6 ▶.
A high-quality homology model for residues 27–83 of human S27 was constructed using the S27e structure (Fig. 2 ▶) as the template. The amino-terminal segment of the ribosomal protein L37 (1FFK:W) was identified by 3D-PSSM (Kelley et al. 1999) as a good structural representation for the amino-terminal extension of human S27. A composite homology model for the entire human S27 sequence (Fig. 7 ▶) was constructed with the program Nest (Petrey et al. 2003) using the two templates, 1FFK:W and 1QXF, according to the following alignments:
N-terminus:
1FFK: PTGR--FGPRYGLKIRVRVRDVEIKH
h_RS27: PLAKDLLHPSPEEEKRKHKKKRLVQS
C-terminus:
1QXF: HSRFVKVKCPDCEHEQVIFDHPSTIVKCIICGRTVAEPTGGKGNIKAEIIEYVDQIE
h_RS27: PNSYFMDVKCPGCYKITTVFSHAQTVVLCVG CSTVLCQPTGGKARL-EGCSFRRKQH
The homology model of hS27 (Fig. 7 ▶) scored well according to the structure evaluation program Verify3D (Bowie et al. 1991; Luthy et al. 1992). Electrostatic surfaces (Fig. 8 ▶) were calculated using the program GRASP (Nicholls et al. 1991).
Acknowledgments
This work was supported by the National Institutes of Health (P50 GM62413-01), the National Science Foundation (MCB 00075773 to T.S.), and the Center for Computational Research at UB. C.P. is indebted to the C.N.R.S. (France) for funding a sabbatical leave at the University at Buffalo.
The publication costs of this article were defrayed in part by payment of page charges. This article must therefore be hereby marked “advertisement” in accordance with 18 USC section 1734 solely to indicate this fact.
Article and publication are at http://www.proteinscience.org/cgi/doi/10.1110/ps.03589204.
References
- Altschul, S.F., Madden, T.L., Schaffer, A.A., Zhang, J., Zhang, Z., Miller, W., and Lipman, D.J. 1997. Gapped BLAST and PSI-BLAST: A new generation pf protein database search programs. Nucleic Acids Res. 25 3389–3402. [DOI] [PMC free article] [PubMed] [Google Scholar]
- Armon, A., Graur, D., and Ben-Tal, N. 2001. ConSurf: An algorithmic tool for the identification of functional regions in proteins by surface-mapping of phylogenetic information. J. Mol. Biol. 307 447–463. [DOI] [PubMed] [Google Scholar]
- Atreya, H.S., Sahu, S.C., Chary, K.V.R., and Govil, G. 2000. A tracked approach for automated NMR assignments in proteins (TATAPRO). J. Biomol. NMR 17 125–136. [DOI] [PubMed] [Google Scholar]
- Ban, N., Nissen, P., Hansen, J., Moore, P.B., and Steitz, T.A. 2000. The complete atomic structure of the large ribosomal subunit at 2.4 Å Resolution. Science 289 905–920. [DOI] [PubMed] [Google Scholar]
- Bartels, C., Xia, T., Billeter, M., Guntert, P., and Wuthrich, K. 1995. The program XEASY for computer-supported NMR spectral analysis of biological macromolecules. J. Biomol. NMR 6 1–10. [DOI] [PubMed] [Google Scholar]
- BaudinBaillieu, A., Tollervey, D., Cullin, C., and Lacroute, F. 1997. Functional analysis of Rrp7p, an essential yeast protein involved in pre-rRNA processing and ribosome assembly. Mol. Cell. Biol. 17 5023–5032. [DOI] [PMC free article] [PubMed] [Google Scholar]
- Bowie, J.U., Luthy, R., and Eisenberg, D. 1991. A method to identify protein sequences that fold into known three-dimensional structure. Science 253 164–170. [DOI] [PubMed] [Google Scholar]
- Brodersen, D.E., Clemons Jr., W.M., Carter, A.P., Wimberly, B.T., and Ramakrishnan, V. 2002. Crystal structure of the 30S ribosomal subunit from Thermus thermophilus: Structure of the proteins and their interactions with 16S RNA. J. Mol. Biol. 316 725–768. [DOI] [PubMed] [Google Scholar]
- Chan, Y.L., Suzuki, K., Olvera, J., and Wool, I.G. 1993. Zinc finger-like motifs in rat ribosomal-proteins S27 and S29. Nucleic Acids Res. 21 649–655. [DOI] [PMC free article] [PubMed] [Google Scholar]
- Chothia, C., Levitt, M., and Richardson, D. 1977. Structure of proteins: Packing of α-helices and pleated sheets. Proc. Natl. Acad. Sci. 74 4130–4134. [DOI] [PMC free article] [PubMed] [Google Scholar]
- Christendat, D., Yee, A., Dharamsi, A., Kluger, Y., Savchenko, A., Cort, J.R., Booth, V., Mackereth, C.D., Saridakis, V., Ekiel, I., et al. 2000. Structural proteomics of an archaeon. Nat. Struct. Biol. 7 903–909. [DOI] [PubMed] [Google Scholar]
- Cornilescu, G., Delaglio, F., and Bax, A. 1999. Protein backbone angle restraints from a database for chemical shift and sequence homology. J. Biomol. NMR 13 289–302. [DOI] [PubMed] [Google Scholar]
- Delaglio, F., Grzesiek, S., Vuister, G.W., Zhu, G., Pfeifer, J., and Bax, A. 1995. NMRPipe: A multidimensional spectral processing system based on UNIX pipes. J. Biomol. NMR 6 277–293. [DOI] [PubMed] [Google Scholar]
- Dresios, J., Chan, Y.-L., and Wool, I.G. 2002. The role of the zinc finger motif and of the residues at the amino terminus in the function of yeast ribosomal protein YL37a. J. Mol. Biol. 316 475–488. [DOI] [PubMed] [Google Scholar]
- Frankel, A.D. 2000. Fitting peptides into the RNA world. Curr. Opin. Struct. Biol. 10 332–340. [DOI] [PubMed] [Google Scholar]
- Fromont-Racine, M., Senger, B., Saveanu, C., and Fasiolo, F. 2003. Ribosome assembly in eukaryotes. Gene 313 17–42. [DOI] [PubMed] [Google Scholar]
- Glaser, F., Pupko, T., Paz, I., Bell, R.E., Bechor-Shental, D., Martz, E., and Ben-Tal, N. 2003. ConSurf: Identification of functional regions in proteins by surface-mapping of phylogenetic information. Bioinformatics 19 163–164. [DOI] [PubMed] [Google Scholar]
- Goldsmith-Fischman, S. and Honig, B. 2003. Structural genomics: Computational methods for structure analysis. Protein Sci. 12 1813–1821. [DOI] [PMC free article] [PubMed] [Google Scholar]
- Güntert, P., Dotsch, V., Wider, G., and Wüthrich, K. 1992. Processing of multidimensional NMR data with the new software PROSA. J. Biomol. NMR 2 619–629. [Google Scholar]
- Güntert, P., Mumenthaler, C., and Wüthrich, K. 1997. Torsion angle dynamics for NMR structure calculation with the new program DYANA. J. Mol. Biol. 273 283–298. [DOI] [PubMed] [Google Scholar]
- Henikoff, S. and Henikoff, J.G. 1992. Amino acid substitution matrices from protein blocks. Proc. Natl. Acad. Sci. 89 10915–10919. [DOI] [PMC free article] [PubMed] [Google Scholar]
- Herrmann, T., Güntert, P., and Wüthrich, K. 2002. Protein NMR structure determination with automated NOE assignment using the new software CANDID and the torsion angle dynamics algorithm DYANA. J. Mol. Biol. 319 209–227. [DOI] [PubMed] [Google Scholar]
- Holm, L. and Sander, C. 1993. Protein structure comparison by alignment of distance matrices. J. Mol. Biol. 233 123–138. [DOI] [PubMed] [Google Scholar]
- Hutchinson, E.G. and Thornton, J.M. 1994. A revised set of potentials for β-turn formation in proteins. Protein Sci. 3 2207–2216. [DOI] [PMC free article] [PubMed] [Google Scholar]
- Jansson, M., Li, Y.C., Jendeberg, L., Anderson, S., Montelione, G.T., and Nilsson, B. 1996. High-level production of uniformly 15N- and 13C-enriched fusion proteins in Escherichia coli. J. Biomol. NMR 7 131–141. [DOI] [PubMed] [Google Scholar]
- Kelley, L.A., MacCallum, R.M., and Steinberg, M.J.E. 1999. Recognition of remote protein homologies using three-dimensional information to generate a position specific scoring matrix in the program 3D-PSSM. In RECOMB 99, Proceedings of the third annual conference on computational molecular biology (eds. S. Istrail et al.), pp. 218–225. The Association for Computing Machinery, New York.
- Kim, S. and Szyperski, T. 2003. GFT NMR, a new approach to rapidly obtain precise high dimensional NMR spectral information. J. Am. Chem. Soc. 125 1385–1393. [DOI] [PubMed] [Google Scholar]
- Klenk, H.P., Clayton, R.A., Tomb, J.F., White, O., Nelson, K.E., Ketchum, K.A., Dodson, R.J., Gwinn, M., Hickey, E.K., Peterson, J.D., et al. 1997. The complete genome sequence of the hyperthermophilic, sulphate-reducing archaeon Archaeoglobus fulgidus. Nature 390 364–370. [DOI] [PubMed] [Google Scholar]
- Koradi, R., Billeter, M., and Wuthrich, K. 1996. MOLMOL: A program for display and analysis of macromolecular structures. J. Mol. Graphics 14 51–55. [DOI] [PubMed] [Google Scholar]
- Laskowski, R.A., Rullmann, J.A., MacArthur, M.W., Kaptein, R., and Thornton, J.M. 1996. AQUA and PROCHECK-NMR: Programs for checking the quality of protein structures solved by NMR. J. Biomol. NMR 8 447–486. [DOI] [PubMed] [Google Scholar]
- Lo Conte, L., Ailey, B., Hubbard, T.J., Brenner, S.E., Murzin, A.G., and Chothia, C. 2000. SCOP: A structural classification of proteins database. Nucleic Acids Res. 28 257–259. [DOI] [PMC free article] [PubMed] [Google Scholar]
- Luthy, R., Bowie, J.U., and Eisenberg, D. 1992. Assessment of protein models with three-dimensional profiles. Nature 356 83–85. [DOI] [PubMed] [Google Scholar]
- Montelione, G.T., Zheng, D., Huang, Y., Gunsalus, K.C., and Szyperski, T. 2000.Nat. Struct. Biol. 7 982–984. [DOI] [PubMed] [Google Scholar]
- Neri, D., Szyperski, T., Otting, O., Senn, H., and Wuthrich, K. 1989. Stereo-specific nuclear magnetic resonance assignments of the methyl groups of valine and leucine in the DNA-binding domain of the 434 Repressor by biosynthetically directed fractional 13C labeling. Biochemistry 28 7510–7516. [DOI] [PubMed] [Google Scholar]
- Nicholls, A., Sharp, K.A., and Honig, B. 1991. GRASP-Graphical representation and analysis of surface properties. Struc. Funct. Genet. 11 281–296. [Google Scholar]
- Orengo, C.A., Michie, A.D., Jones, S., Jones, D.T., Swindells, M.B., and Thornton, J.M. 1997. CATH - A hierarchic classification of protein domain structures. Structure 5 1093–1108. [DOI] [PubMed] [Google Scholar]
- Petrey, D., Xiang, X., Tang, C.L., Xie, L., Gimpelev, M., Mitors, T., Soto, C.S., Goldsmith-Fischman, S., Kernytsky, A., Schlessinger, A., et al. 2003. Using multiple structure alignments, fast model building, and energetic analysis in fold recognition and homology modeling. Proteins 53 430–435. [DOI] [PubMed] [Google Scholar]
- Ramakrishnan, V. and White, S.W. 1998. Ribosomal protein structures: Insights into the architecture, machinery and evolution of the ribosome. Trends Biochem. Sci. 23 208–212. [DOI] [PubMed] [Google Scholar]
- Revenkova, E., Masson, J., Koncz, C., Afsar, K., Jakovleva, L., and Paszkowski, J. 1999. Involvement of Arabidopsis thaliana ribosomal protein S27 in mRNA degradation triggered by genotoxic stress. EMBO J. 18 490–499. [DOI] [PMC free article] [PubMed] [Google Scholar]
- Rost, B. 1996. PHD: Predicting one-dimensional protein structure profile based on neural networks. Methods Emzymol. 266 525–539. [DOI] [PubMed] [Google Scholar]
- Schluenzen, F., Tocilj, A., Zarivach, R., Harms, J., Gluehmann, M., Janelle, D., Bhasan, A., Bartels, H., Agmon, I., Franceschi, F., et al. 2000. Structure of functionally activated small ribosomal subunit at 3.3 Å resolution. Cell 102 615–623. [DOI] [PubMed] [Google Scholar]
- Shindyalov, I.N. and Bourne, P.E. 1998. Protein structural alignment by incremental combinatorial extention (CE) of the optimum path. Protein Eng. 11 739–747. [DOI] [PubMed] [Google Scholar]
- Szyperski, T., Neri, D., Leiting, B., Otting, G., and Wüthrich, K. 1992. Support of 1H NMR assignments in proteins by biosynthetically directed fractional 13C-labeling. J. Biomol. NMR 2 323–334. [DOI] [PubMed] [Google Scholar]
- Szyperski, T., Yeh, D.C., Sukumaran, D.K., Moseley, H.N.B., and Montelione, G.T. 2002. Reduced-dimensionality NMR spectroscopy for high-throughput protein resonance assignment. Proc. Natl. Acad. Sci. 99 8009–8014. [DOI] [PMC free article] [PubMed] [Google Scholar]
- Takahashi, Y., Mitsuma, T., Hirayama, S., and Odani, S. 2002. Identification of the ribosomal proteins present in the vicinity of globin mRNA in the 40S initiation complex. J. Biochem. 132 705–711. [DOI] [PubMed] [Google Scholar]
- Vuister, G.W. and Bax, A. 1993. Quantitative J Correlation: A new approach for measuring homonuclear three-bond J(HNHa) coupling constants in 15N-enriched proteins. J. Am. Chem. Soc. 115 7772–7777. [Google Scholar]
- Xia, Y.L., Arrowsmith, C.H., and Szyperski, T. 2002. Novel projected 4D triple resonance experiments for polypeptide backbone chemical shift assignment. J. Biomol. NMR 24 41–50. [DOI] [PubMed] [Google Scholar]
- Yang, A.S. and Honig, B. 1999. Sequence to structure alignment in comparative modeling using PrISM. Proteins Suppl. 3: 66–72. [DOI] [PubMed]
- Yee, A., Chang, X.Q., Pineda-Lucena, A., Wu, B., Semesi, A., Le, B., Ramelot, T., Lee, G.M., Bhattacharyya, S., Gutierrez, P., et al. 2002. An NMR approach to structural proteomics. Proc. Natl. Acad. Sci. 99 1825–1830. [DOI] [PMC free article] [PubMed] [Google Scholar]
- Zheng, D., Huang, Y.J., Moseley, H.N.B., Xiao, R., Aramini, J., Swapna, G.V.T., and Montelione, G.T. 2003. Automated protein fold determination using a minimal NMR constraint strategy. Protein Sci. 12 1232–1246. [DOI] [PMC free article] [PubMed] [Google Scholar]


