

SUMMARY
We have suggested that highly crossreactive αβ T cell receptors (TCRs) obtained by limited negative selection will best illustrate germline-encoded TCR-MHC interactions. To test this, we solved the structures of 3 TCRs bound to the same MHCII/peptide (IAb/3K). The TCRs had similar affinities for IAb/3K, but varied from non- to extremely-crossreactive with other peptides and MHCs. Crossreactivity correlated with a shrinking, increasingly hydrophobic TCR/ligand interface, involving fewer TCR amino acids. A few CDR1/CDR2 amino acids dominated the most crossreactive TCR interface with MHC, including Vβ8 48Y and 54E and Vα4 29Y, arranged to impose the familiar diagonal orientation of TCR on MHC. These amino acids contribute to MHC-binding by other TCRs using related Vs, but not usually so dominantly. These data support the ideas that crossreactive TCRs can spotlight the evolutionarily conserved features of TCR/MHC interactions and that conserved TCR/MHC interactions contribute to diagonal docking of TCRs on MHC.
INTRODUCTION
T cell development in the thymus and the assembly of the genes for αβ T cell receptors (TCRs) by somatic recombination among a set of V, D and J germline gene segments are well-documented (Bluthmann et al., 1988; Davis and Bjorkman, 1988; Fink and Bevan, 1978; Kappler et al., 1987; Marrack and Kappler, 1987; Zinkernagel et al., 1978). However, an unresolved question has been how the germline genes and somatic recombination interact to create a population of mature T cells that are focused on peptides bound to MHC molecules.
Random gene recombination creates the initial set of TCRs, but 2 processes in the thymus cull this population to establish the mature TCR repertoire. One is called ‘positive selection’, in which only T cells with TCRs that successfully engage self-MHC occupied with peptides derived from self-proteins receive the signals necessary to survive and complete T cell differentiation (Fink and Bevan, 1978; Zinkernagel et al., 1978). In a second process called ‘negative selection’, thymocytes with TCRs that engage self-MHC/self-peptide ligands too strongly are eliminated before they can leave the thymus (Bluthmann et al., 1988; Kappler et al., 1987). The surviving T cells constitute the mature T cell population, whose TCR affinities/avidities for self-MHC/self-peptides are too low for T cell activation (Ashton-Rickardt et al., 1994; Hogquist et al., 1994; Sebzda et al., 1994; Sprent et al., 1988), thus avoiding autoimmunity. However, replacement of the self-peptide with a foreign peptide converts the complex into a high affinity ligand for some of the T cells in the population, leading to a successful immune response.
We still do not understand the reasons why TCRs react nearly exclusively with MHC ligands. One straightforward idea, the evolutionary hypothesis, has been that the TCR genes have evolved to encode proteins that are inherently somewhat MHC-specific (Jerne, 1971). At the other extreme is the idea that the initial TCR repertoire is truly random in specificity and that the thymus selects out the rare TCRs that have the appropriate MHC specificity/affinity (Fink and Bevan, 1978; Zinkernagel et al., 1978).
We have been studying the properties of mice expressing an MHCII molecule with a single covalently bound peptide that excludes the binding of other peptides, including self-peptides (Huseby et al., 2005; Ignatowicz et al., 1996). Surprisingly, these mice develop a substantial mature CD4 T cell repertoire. However, many of these T cells have specificities not often seen in normal mice. Most react with cells expressing the wild type form of this same MHCII molecule with the normal contingent of self-peptides (Fung-Leung et al., 1996; Ignatowicz et al., 1996; Martin et al., 1996; Miyazaki et al., 1996). Many also react with many other MHCII alleles (Fung-Leung et al., 1996; Huseby et al., 2003; Ignatowicz et al., 1996; Martin et al., 1996; Miyazaki et al., 1996). Some even crossreact with MHCI ligands (Huseby et al., 2005). Moreover, immunization of these mice with the same MHCII molecule with a covalent foreign peptide produces peptide-reactive T cells that retain the properties of self- and allo-MHC reactivity and also tolerate multiple MHC/peptide mutations within their predicted footprint on their ligands (Huseby et al., 2005).
These experiments led us to propose a variant of the evolutionary hypothesis. We suggested that in normal animals the CDR1 and CDR2 loops of germline encoded TCR V elements produce MHC-crossreactive T cells with high frequency. These T cells can be positively selected, but their likelihood of survival is dependent on the somatically generated V region CDR3 loops, which must attenuate the conserved MHC interactions in order for the T cell bearing them to escape negative selection. The many self-MHC/self-peptides combinations present in the thymus of normal mice make escape difficult, since at least some combinations are likely to permit enough of the conserved MHC interaction that negative selection occurs. However, the single MHC/peptide combination present in our mice allows many of these normally deleted crossreactive T cells to bypass negative selection and appear in the mature T cell population (Huseby et al., 2005).
We reasoned that this highly crossreactive population of T cells provides a unique opportunity to look for TCRs manifesting relatively unadulterated examples of germline TCR/MHC interactions. Therefore, we solved and compared the structures of three TCRs bound to the same MHCII molecule, IAb, occupied the same peptide, 3K. One TCR was from a highly MHC/peptide specific T cell, B3K506, isolated from normal C57BL/6 mice immunized with the 3K peptide (Huseby et al., 2005; Rees et al., 1999). The other two TCRs were from T cells isolated from IAb single peptide mice immunized with the covalent combination of IAb and 3K (Huseby et al., 2005). One of these (2W20) was modestly crossreactive and the other (Yae62) was extremely crossreactive. All three TCRs used members of the mouse Vβ8 (BV8) family and two (B3K506 and YAe62) used members of the Vα4 family (Arden et al., 1995). The 2W20 Vα was from the Vα2 family.
The footprints of the TCRs on IAb/3K were very different ranging from a large very disperse, non-hydrophobic interaction for the highly specific TCR to a much smaller, very concentrated, hydrophobic interaction for the highly crossreactive TCR. Furthermore as predicted by our hypothesis, interactions involving the TCR germline CDR1 and CDR2 regions became highly focused on just a few TCR amino acids as the TCR progressed from highly specific to highly crossreactive. These included two amino acids, Vβ8 46Y and 48Y, that had previously been suggested to mediate conserved MHC interactions, and Vβ8 54E as well as Vα4 29Y, previously unnoticed as a potentially conserved MHC interacting amino acid. These Vα and Vβ amino acids and their binding sites on MHC impose a diagonal mode of docking for TCR on MHC. Overall our results offer a structural explanation for highly crossreactive TCRs and support our hypothesis that these TCRs may be the best tool to identify features of TCR germline V regions that predispose them to MHC reactivity.
RESULTS
Overall structures of the complexes of three TCRs bound to the same MHC/peptide
We expressed and crystallized the complexes of soluble versions of the highly specific, B3K506, moderately crossreactive, 2W20, and highly crossreactive, YAe62, TCRs bound to the IAb/3K ligand and solved the structures of the complexes to resolutions of 2.55Å, 3.40Å and 3.05Å respectively (see Experimental Procedures, Supplemental Figure 1 and Supplemental Table 1). Viewed from the T cell (Figure 1A,B,C), the 6 CDR regions of all three TCRs lie in the now familiar diagonal configuration over the top of the MHCII/peptide complex with the Vβ domains of the TCRs over the IAb α1 helix and the Vα domains over the β1 helix (Buslepp et al., 2003; Colf et al., 2007; Feng et al., 2007; Garboczi and Biddison, 1999; Garboczi et al., 1996; Garcia et al., 1998; Garcia et al., 1996; Hennecke et al., 2000; Hennecke and Wiley, 2002; Kjer-Nielsen et al., 2003; Luz et al., 2002; Maynard et al., 2005; Reinherz et al., 1999; Reiser et al., 2003; Stewart-Jones et al., 2003). The angle of this orientation (~45° to the peptide backbone) is very similar for all three TCRs. However, a view from the N-terminal end of the 3K peptide (Figure 1D,E,F) shows that the B3K506 TCR engages the MHC/peptide tilted somewhat to the MHC β chain helix, while the 2W20 TCR is tilted more and the YAe62 TCR even more toward the MHC α chain helix.
Figure 1. Orientation of the TCRs on their IAb/3K ligand.

For the A) B3K506, B) 2W20 and C) YAe62 TCRs bound to IAb/3K, a top view of the IAb α1 and β1 domains are shown as ribbons colored light cyan and light magenta respectively with the bound 3K peptide shown as a wireframe with CPK coloring. For each complex the six TCR CDR loops are shown as tubes colored as follows: αCDR1 - green; αCDR2 - dark cyan; αCDR3 - blue; βCDR1 - yellow; βCDR2 - orange; βCDR3 - red. For the D) B3K506, E) 2W20 and F) YAe62 TCRs bound to IAb/3K, views are shown looking down the IAb peptide binding groove from the peptide N-terminus. Ribbon representations of the IAb α1 and β1 domains (cyan and magenta respectively) and TCR Vα and Vβ domains (red and green) are shown. The 3K peptide is represented with a yellow tube.
These differences in tilt and in the compositions of the CDR3s of the TCRs lead to very different footprints of the TCRs on the IAb/3K ligands (Figures 2 and 3, Table I and Supplemental Figure 2). The B3K506 TCR interacts extensively with both the MHC and peptide. The result is a large, distributed footprint with a buried surface of 1893Å2, typical of that seen in most other TCR/MHC/peptide structures (Rudolph et al., 2006). The 2W20 TCR interacts with fewer MHC and peptide atoms for a footprint of 1695Å2 and the YAe62 TCR contacts even fewer MHC and peptide atoms for a footprint of only 1178Å2 , the smallest yet reported for a TCR/classical MHC complex.
Figure 2. The footprint of the TCRs on IAb/3K.

The areas of contact on the IAb/3K ligand are shown for the A) B3K506, B) 2W20 and C) YAe62 TCRs. In each case, the water accessible surface of the α1/β1/peptide portions of IAb/3K is shown, viewed looking directly at the areas of TCR contact. The portion of the IAb/3K surface in contact with the TCRs is colored as follows: that from atoms in α1, dark cyan; from β1, dark magenta; from the peptide, dark yellow. The rest of the surface is colored as follows: α1 helix, light cyan; β1 helix, light magenta; peptide light yellow; the rest of α1 and β1, white.
Figure 3. IAb/3K atom to atom contacts with the TCRs and the correlation with IAb/3K mutational data.

The figure shows the number of atom to atom contacts between the A) B3K506, B) 2W20 or C) YAe62 TCR and individual IAb/3K amino acids within the α chain (cyan), β chain (magenta) and peptide (yellow) portion of the ligand. Data are shown for all IAb/3K amino acids that contact the TCR in any of the structures. The IAb/3K non-alanine amino acids that were previously (Huseby et al., 2006) subjected to mutational analysis are high-lighted with a rectangle. A green rectangle indicates that when this position was mutated to alanine and tested for TCR binding there was an increase in ΔΔG of ≤ 0.8 kcal/mole. A red rectangle indicates an increase of >0.8 kcal/mole.
Table I.
Characterization of the TCR interfaces with IAb/3K
| B3K506 | 2W20 | YAe | |
|---|---|---|---|
| Footprint(Å2) | 1893 | 1695 | 1178 |
|
| |||
| No. of Ligand Atoms Contacted | |||
| MHC α | 29 | 46 | 46 |
| MHC β | 44 | 23 | 12 |
| Peptide | 34 | 27 | 16 |
|
| |||
| Total | 107 | 96 | 74 |
|
| |||
| Ratio (MHC/Peptide) | 2.2 | 2.5 | 3.6 |
|
| |||
| Atom to Atom Contacts | |||
| C to C VDW | 67 | 102 | 136 |
| Other VDW | 192 | 186 | 130 |
| H bonds/Salt Bridges | 21 | 20 | 7 |
|
| |||
| Total Contacts | 280 | 308 | 273 |
|
| |||
| Contacts/Ligand Atom | 2.6 | 3.2 | 3.6 |
| Proportion C to C(%) | 24 | 33 | 50 |
Comparison of the TCR complex structures to the results of IAb/3K mutational studies
The observed footprints of these TCRs correlate well with the results of extensive mutagenesis studies of their interaction with their MHC/peptide ligand (Huseby et al., 2006; Huseby et al., 2005). In these studies the five most exposed amino acids of the α1 helix (55D, 57Q, 61Q, 64A, 68H), β1 helix (66E, 70R, 73A, 77T, 81H), and the peptide (−1E, 2Q, 3K, 5K, 8K) of IAb/3K were mutated to many other amino acids. We assessed the effects of the mutations on their interaction with the three TCRs, as judged by T cell hybridoma activation and by TCR binding to IAb/3K and its mutants, measured by flow cytometry and surface plasmon resonance. For the most part, those amino acids whose mutation had the greatest effect in these assays were also those that contributed the most to the footprint of the IAb/3K on the TCRs in the x-ray crystal structures.
This point is illustrated in Figure 3, which shows the number of atom-to-atom contacts each of the engaged amino acids of IAb/3K makes with the TCRs in the three structures. Clearly some MHC amino acids, for example IAb α57Q and α61Q are heavily engaged by all 3 TCRs, whereas others, for example IAb α68H are less involved. In Figure 3, the 13 amino acids that were not alanine involved in our mutagenesis studies are boxed in the Figure to reflect the effect on TCR binding energy of their mutation to alanine, i.e. removal of their side chain. A green box indicates a ΔΔG increase of ≤ 0.8 kcal/mole (≤~ 4 fold loss of affinity) and a red box, a ΔΔG increase of >0.8 kcal/mole. As a first approximation, we can view these measurements as reflecting the contribution of the amino acid side chain atoms after the Cβ carbon to the binding affinity, but, of course, secondary effects, such as repositioning of adjacent amino acids or changes in structured water within the interface, cannot be ruled out.
Considering results for all 3 TCRs, all 26 amino acids whose mutation to A resulted in a ΔΔG increase of >0.8 kcal/mole made at least 3 contacts with the relevant TCR in the solved structures (Figure 3). Moreover, for each of the IAb α chain, IAb β chain and peptide portions of the ligand, mutation of the amino acid with the most TCR contacts invariably increased ΔΔG >0.8 kcal/mole. For the remaining 13 amino acids, mutation to A did not dramatically reduce the affinity of TCR binding. In the structures, these were either not in contact with the TCR or were at the edges of the footprint where the binding of their side chain binding might be predicted to be less important.
Our mutational experiments also identified ‘interface disrupting amino acids’, amino acids that were either A to begin with or whose mutation to A did not dramatically reduce TCR binding, but whose mutation to a number of other amino acids inhibited binding (Huseby et al., 2006; Huseby et al., 2005). For example, IAb α64A in all three structures and IAb β73A in the B3K506 and 2W20 structures lie within the TCR footprint, but are not major sites of contact. In each case, we identified other amino acids that, when substituted for the A, strongly inhibited TCR binding (ΔΔG increases of >0.8 kcal/mole) and/or T cell activation. The most straight-forward structural interpretation of these results is that steric interference by the side chains of these mutated amino acids disrupted TCR binding. Other examples were amino acids at the periphery of the TCR footprints, e.g. IAb α55D and α68H, where mutation to A had a minimal effect, but mutation to numerous other amino acids disrupted TCR binding. Again, steric interference is the most straight-forward interpretation of these results.
The nature of the TCR interface in relation to TCR crossreactivity
The 3 TCRs in this study bind to their IAb/3K ligand with very similar affinities (~10uM) and binding kinetics (very fast on and off rates, (Huseby et al., 2006)). Our mutational analyses showed that changing the side chains of many of the exposed surface MHC and peptide amino acids had much less effect on the crossreactive T cells than on highly specific ones. In order to explain this result in light of the similar TCR affinities, we suggested that perhaps the crossreactive T cells maintained affinity by making fewer contacts with the IAb/3K amino acid side chains and more contacts with the MHC/peptide backbone, thus preserving a similar area of contact, while becoming less susceptible to mutations. However, the structures of the three complexes show that this suggestion was not correct. In fact, as described above, the mutational data quite accurately predicted the decreasing size of the three TCR footprints as the TCR became more crossreactive (Figures 2 and 3).
Affinity can be preserved, even though the surface area of interaction is reduced, if the chemical nature of the interfaces between the TCRs and IAb/3K ligands is different between the non-crossreactive and crossreactive TCRs. To find out if such differences occur, we analyzed the details of the TCR/MHC interfaces in the 3 complexes (Table I and Supplemental Figure 2). Not unexpectedly, there is a direct relationship between the decreasing size of the TCR footprint and the total number of MHC/peptide atoms contacted as one proceeds from the most specific (B3K506) to the most crossreactive (YAe62) TCR. Also, as the TCR tips further toward the MHC α chain, there are more MHC α chain atoms and fewer MHC β chain atoms contacted. Finally, the ratio of MHC to peptide atoms involved in the interface changes dramatically between the most specific and most crossreactive TCR. Thus the TCR footprint shrinks and focuses more on the MHC than on the peptide as crossreactivity increases. However, despite the smaller footprint involving few ligand atoms, the total number of atom to atom contacts does not decrease dramatically with increasing crossreactivity. Thus there are more TCR contacts per ligand atom.
Perhaps the most striking difference among the TCR interfaces is the relative ratio of the various types of atom-to atom contacts. If one classifies the interactions as 1) hydrophobic C to C van der Waals (VDW) contacts, 2) non-hydrophobic VDW contacts involving a N or O or 3) hydrophilic H-bonds and salt bridges, there is a dramatic increase in the proportion of the interactions that are hydrophobic as the TCR becomes more crossreactive. For B3K506 about 1/4 of the interactions are C to C, for 2W20, about 1/3 and for YAe62, about 1/2 (Table 1). Aromatic amino acids (Y,F,W) play a large role in the hydrophobic nature of the crossreactive TCR footprints (Supplemental Figure 2). Particularly noteworthy are the Vβ CDR3’s of the 2W20 and YAe62 TCRs, where a W and an F make major contributions to the interface.
While individual VDW interactions are weak, a concentrated area of C to C hydrophobic interaction, such as is often found in the cores of globular proteins or in protein subunit interfaces, can be very stabilizing due to the ”hydrophobic effect.” These observations lead us to propose that T cells become highly crossreactive via a concentrated hydrophobic interface that focuses on the MHC portion of the ligand, but with a minimal area of contact. This allows the receptor to maintain high affinity binding and tolerant to changes in many of the amino acids of the peptide and the rest of the MHC surface.
Conserved TCR interactions with MHC are well illustrated by the crossreactive TCR
We have hypothesized that the evolutionarily conserved interactions between TCRs and MHC, were they to exist, might best be demonstrated best by very crossreactive TCRs that have been through limited negative selection (Huseby et al., 2006; Huseby et al., 2005). With this in mind we determined the number of atom to atom contacts individual amino acids of the TCR made with the IAb portion of the ligand (Figure 4 and Supplemental Figure 2). In all three structures the CDR3 regions of Vα and/or Vβ contribute to the interface. However, we confined the analysis to Vα and Vβ CDR1/2, because, while partially constructed from germ line encoded amino acids, the extreme somatic variability in the composition and length in the CDR3 loops would seem to exclude the germline maintenance of any specific conserved interactions.
Figure 4. Crossreactive TCRs use only a few amino acids in CDR1/CDR2 to bind IAb/3K.
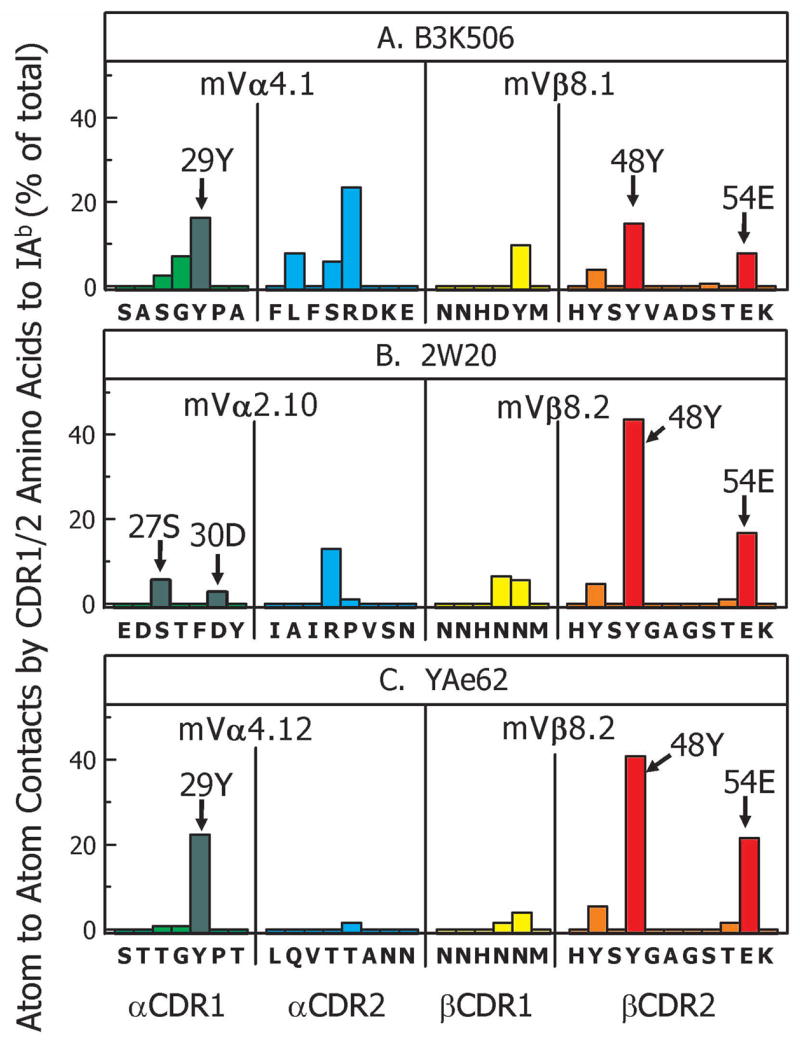
For the A) B3K506, B) 2W20 and C) YAe62 TCRs the atom-to-atom contacts between the CDR1 and CDR2 regions of the TCR Vα and Vβ chains and IAb were calculated as described in the Experimental Procedures. The data are shown as the percent of the total CDR1/2 contacts contributed by each TCR amino acid. The sequences of the CDRs are shown with the contact data for each amino acid presented as the percentage of the total Vα/Vβ CDR1/CDR2 contacts. Bars are colored green (Vα CDR1), cyan (Vα CDR2), yellow (Vβ CDR1) and orange (Vβ CDR2), except the bar for Vα 29Y (A and C) or 27S/30D (B) are colored dark green and the bars for Vβ 48Y and 54E (A,B,C) are colored red. In each panel the Vα and Vβ element used by the TCR is indicated.
Since the highly specific B3K506 and highly crossreactive YAe62 TCRs both use related members of the Vα4 and Vβ8 families, their comparison was particularly informative. The CDR1/2 interface of the YAe62 TCR with IAb was dominated by just 3 amino acids, Vα 29Y, Vβ 48Y and Vβ 54E, which account for 85% of the total CDR1/2 contacts (Figure 4C). These amino acids were present in the B3K506 TCR interface as well, but were less predominant there due to contributions from many other amino acids (Figure 4A). The intermediately crossreactive 2W20 TCR also uses a member of the Vβ8 family, whose 48Y and 54E also contributed substantially more to the interface than seen in the B3K506 structure (Figure 4B). Moreover, as discussed further below, consistent interactions with MHC by Vβ 48Y and Vβ 54E have been noted before by others (Feng et al., 2007; Maynard et al., 2005). The 2W20 TCR contained a member of the Vα2 rather than Vα4 family. However, the Vα CDR1 loop of the 2W20 also makes contact with the IAb portion of the ligand via 2 amino acids, 27S/30D.
Our hypothesis leads us to propose that these amino acids are conserved features of these V elements used for MHC recognition. If this idea is correct, these amino acids should be interacting with conserved sites on the MHCII molecule. Figure 5 shows that in the 3 structures the Vα CDR1s do indeed interact similarly with a highly conserved site on the IAb β chain. For example, in both the B3K506 and YAe62 structures 29Y extends from the tip of Vα CDR1 and inserts between the side chains of 77T and 81H on the IAb 7β chain α helix (Figure 5A,C). In the case of the B3K506 TCR, the tilt of the receptor toward the β chain side of IAb has pushed 29Y over the edge of the helix to interact with β76D as well. β76D and β81H are nearly invariant in mouse and human MHCII molecules, while βT77 is the most commonly found amino acid at this position (Lefranc et al., 2003). 27S/30D of the 2W20 Vα CDR1 loop, interact with the same region of the β chain, contacting IAb β81H and β77T (Figure 5B). While the extent of contact with these two amino acids is not as great as seen with Vα Y29 in the YAe62 structure, mutation of either β81H and β77T to alanine in our mutational studies severely reduced 2W20 interaction with IAb/3K (Figure 3B).
Figure 5. Vα 29Y and Vβ 48Y and 54E interact with conserved sites on MHCII.

The sites of interaction of the Vα CDR1 loop with the IAb β chain helix is shown for the A) B3K506, B) 2W20 and C) YAe62 TCRs. A stick representation of the side chain of Vα[ CDR1 29Y (A and C)) and 27S/30D (B) is shown (carbon colored green and oxygen colored red) with a ribbon representation of a portion of the IAb β chain helix (magenta) and stick representations of the side chains of the relevant IAb amino acids (CPK coloring). Similarly, the sites of interaction of Vβ 48Y and 54E with the IAb α chain is shown for the D) B3K506, E) 2W20 and F) YAe62 TCRs. Stick representations of the side chains of Vα 48Y and 54E are shown (carbon colored orange, oxygen colored red) with a ribbon representation of a portion of the IAb α chain helix and a tube representation of a portion of the loop connecting the 3rd and 4th β strands of the α chain (cyan) and stick representation of the side chains of the relevant IAb amino acids (CPK coloring).
Similarly, Vβ 48Y and 54E also interact with a conserved target site on the MHC α chain (Figure 5D,E,F). In all 3 structures Vβ 48Y is nestled among the side chains of 3 amino acids on the IAb α chain α helix: 57Q, 60L and 61Q. The ability of this region of the CDR2 loop of Vβ to approach the helix is facilitated by the lack of a sterically hindering side chain at IAb α 64A. 57Q, 60L and 64A are nearly invariant in MHCII molecules and 61Q is the most frequent amino acid at this position. In the 2W20 and YAe62 structures Vβ 54E also contacts this area of the α chain α helix, interacting with 57Q and 60L, but also making a number of contacts with 39K, including a salt bridge. 39K sits on the α chain loop connecting the 3rd and 4th beta strands and is highly conserved in mouse IA and human DR molecules (Lefranc et al., 2003). The tilt of the B3K506 TCR toward the IAb β chain pulls Vβ 54E away from the α chain α helix and eliminates some of its contacts including the salt bridge to α 39K.
Vα 29Y is present in the CDR1 regions of about 10% of mouse Vαs and 2 human Vαs (Vα22 and Vα31). Vα 27S and 30D(or N) are found in CDR1 of the large mouse Vα2 family as well as the human Vα 8, 14 and 21 families. VβCDR2 Y48 and E54 are present in CDR2 in 35% and 10% of mouse and human Vβs, respectively. Therefore, these amino acids are fairly well-represented in the overall mouse and human V repertoire. If our hypothesis is correct, the types of interactions that we see for these amino acids in our structures should also be present to varying degrees in other mouse and human structures using one of these V regions. Therefore, we examined five published structures of TCR/MHCII that contained these amino acids, for the number of contacts of CDR1/2 with the MHCII molecule (Figure 6).
Figure 6. Variable but frequent use of Vα 29Y and Vβ 48Y and 54E in other TCR/MHCII complexes.

The CDR1/2 contact data for 5 published TCR/MHCII complex structures involving Vα 29Y or 27S/30D and/or Vβ 48Y and 54E were calculated, labeled, presented and colored as in Figure 4. A) TCR – 3A6, ligand – HLA-DR51 + peptide from myelin basic protein (MBP), PDB – 1ZGL (Li et al., 2005); B) TCR- 1934, ligand -mouse IAu + peptide from MBP;PDB – 2PXY (Feng et al., 2007); C) TCR – 172, ligand, mouse IAu + peptide from MBP;PDB – 1U3H (Maynard et al., 2005); D) TCR –D10, ligand – IAk + peptide from hen conalbumin (ConAlb), PBD – 1D9K (Reinherz et al., 1999) and E) TCR – HA-1.7, ligand – HLA-DR1 + peptide from influenza hemagglutinin (Flu-HA), PDB – 1FYT (Hennecke et al., 2000).
In all of these structures Vα 29Y or Vα 27S/30D and Vβ 48Y and 54E, when present, contribute to the TCR CDR1/2 interface with MHCII, interacting with the same target sites on MHCII shown in Figure 5. However, in most of these other cases, more other amino acids contributed to the interface than in the YAe62 and/or 2W20 TCR complexes. This was especially true for Vα 29Y and Vβ 48Y and 54E. For example, Figure 6A and 6B show the data for two TCR/MHCII structures that contain Vα 29Y, one from a human TCR using Vα22 (Li et al., 2005) and one from a mouse TCR using Vα4.9 (Feng et al., 2007). In both cases, Vα Y29 interacts with the MHC β chain in the same area as seen with the YAe62 and B3K506 TCRs. In the human structure Vα 29Y is very dominant for Vα interaction, but many Vβ amino acids contribute as well to the total interface. In the mouse Vα4.9 structure, Vα 29Y is even less predominant in the overall contacts. As far as the Vα 27S/30D-containing TCRs are concerned, in the other structures with TCRs containing members of the mouse Vα2 family, CDR1 27S/30D are part of the contact interface, again interacting with target sites on the MHCI β chain that are similar to those seen with the 2W20 TCR (Figures 5B and 6C,D).
Perhaps because mouse and human Vβ elements related to mouse Vβ8 make TCRs particularly amenable to expression in a soluble form, the published structures of TCRs bound to MHCI and MHCII ligands are heavily skewed toward TCR with these Vβ’s. Garcia and his colleagues have concentrated on the analysis of these structures from their own and other laboratories (Feng et al., 2007; Maynard et al., 2005). They pointed out that Vβ 46Y, 48Y and 54E (48Y, 50Y and 56E by their number scheme) are repeatedly found in the interface between TCR and MHCII and may represent germline encoded conserved sites of MHC interaction. Figures 6B-E show an analysis of 4 TCR/MHCII published structures that contain Vβ 48Y and 54E, three from mouse (Vβ 8.2) and one from human (Vβ 3.1). As pointed out by Feng et al. (Feng et al., 2007), in each structure Vβ 48Y contributes to the TCR/MHCII interface, binding to the same positions on the MHC α chain helix as in Figure 5. However, again, in each of these structures many other amino acids contribute to the total interface. Another amino acid noted by Feng et al., Vβ 46Y, also makes contact with the MHC β chain helix in all of the TCR structures where it is present but in these structures the overall contribution in every case is less than seen for Y48. Vβ 54E also makes many contacts in all the structures analyzed in Figure 6, however, this amino acid received less attention in previous analyses, perhaps because it is less consistently used in interactions between TCRs and MHCI versus with MHCII.
A picture emerges from the sum of our and these previously reported structures of a gradient of contributions from these amino acids to the CDR1/2 interface with MHCII ranging from a minimum contribution in the B3K506 and HA1.7 structures to a maximum in the YAe62 structure. This gradient is consistent with our hypothesis that negative selection in the normal thymus operates to lessen the contribution from these conserved amino acids to avoid autoimmunity.
Are the evolutionarily conserved residues in the YAe TCR important for its reactivity?
We have previously examined the effects of mutations of IAb/3K on its affinity for these 3 TCRs. The results support the notion that the TCR residues identified in the structural work are important for the IAb/3K binding to TCR, since mutations in the MHC target sites for these residues had dramatic inhibitory effects (Figure 3 and (Huseby et al., 2003)). However, the evolutionary hypothesis proposed here suggests that mutations in these TCR residues would often affect interaction between the TCR and MHC, regardless of the MHC target. The YAe62 TCR reacts with IAb/3K as well as a number of allogeneic MHCs and therefore allowed a test of the evolutionary prediction.
Retroviruses coding for the YAe62 TCR α and β chains, expressing the wild type sequence or with α29Y, β48Y or β54E mutated to A were created and co-transduced into TCR deficient hybridomas with the appropriate wild type partner chain. Staining experiments showed that all combinations were expressed at comparable levels on the surface of the transduced cells (data not shown). The transductants were tested for their ability to react with various targets. Transductants expressing only the YAe62 TCRα did not respond to any target. Transductants expressing the wild type YAe62 TCR αβ pair had the specificities for allogeneic MHC characteristic of the orginal YAe62 hybridoma, for cells bearing only IAb/3K and for spleen cells bearing H-2b, H-2k, H-2q, H-2r and H-2s plus endogenous mouse peptides (Huseby et al., 2005). The results are presented in Figure 7.
Figure 7. The evolutionarily conserved, MHC binding amino acids affect TCR reaction with self and allo-MHC.

T cell hybridomas were constructed to express the wild type YAe62 TCR, or the YAe62 TCR with CDR1α 29Y mutated to A, or CDR2β 48Y or 54E mutated to A. All hybridomas expressed equivalent levels of TCR. The hybridomas were tested for their response to fibroblasts expressing B7, ICAM-1 and IAb/3K or to spleen cells expressing the indicated H-2 alleles bound to mouse peptides. Responses were measured using an HT-2 assay, as units/ml of IL-2 produced. Results shown are the averages and standard errors of 3 independent experiments. The limit of detection in the assays (dotted line) was 2 units/ml of IL-2.
All three of the mutations studied severely reduced response to IAb/3K, as predicted by the structure of YAe62 bound to this ligand. The effect of the individual mutations on the response to allo-MHC depended upon the particular MHC allele. Change of the β48Y to A obliterated the ability of the TCR to react with any allo-MHC target tested. Alteration of β54E to A affected all reactivities except those against H-2b and H-2s. Mutation of α29Y to A reduced the reactivity to H-2s by about 2 orders of magnitude, but had no effect on the other allo-MHC reactivities. The effects of this Vα29Y mutation may have been less dramatic because the YAe62 TCR is strongly tilted towards the IAb α1 helix in the IAb/3K structure, and this may apply also to its reactions with allo-MHC/mouse peptides. Since, when responding to allogeneic MHC, TCRs are reacting with both foreign MHC and different arrays of peptides bound to these MHC proteins, it is possible that in responses to some allo-MHC, the loss of binding contribution by mutation of Vα29Y or Vβ54E can be compensated for by a particular peptide, engaged in the right configuration, by that allo-MHC protein.
Overall these mutational results show that the amino acids we have identified as frequent contributors to MHC reaction, particularly those in Vβ, operate also in reactions between the same TCR and other MHC ligands.
DISCUSSION
Some previous evidence supports the idea that TCRs have been selected evolutionarily to react with MHC. For example, TCRs that have not been positively selected are still quite likely to react with MHC, at frequencies of about 20%, and random combinations of TCR α and β chains are also unexpectedly likely to bind MHCs (Blackman et al., 1986; Merkenschlager et al., 1997; Zerrahn et al., 1997). If evolutionary selection has occurred, it probably applies to the TCR V regions, rather than their D or J sequences, since the CDR1/CDR2 loops of the V regions are not subject to the extensive somatic variation that is introduced into the V(D)J junctional regions of CDR3. Indeed, some versions of CDR3 sequences may allow TCRs to bind ligands that do not include MHC at all (Siliciano et al., 1985; van Laethem et al., 2007)
When the first TCR/MHC/peptide complexes were solved, it was gratifying to see that the V region CDR1 and CDR2s often interacted with the MHC helices, but puzzling to find so much flexibility in the orientation and pitch of the TCR on the MHC (Buslepp et al., 2003; Garboczi et al., 1996; Garcia et al., 1998; Garcia et al., 1996; Hennecke et al., 2000; Hennecke and Wiley, 2002; Kjer-Nielsen et al., 2003; Luz et al., 2002; Reinherz et al., 1999; Reiser et al., 2003; Stewart-Jones et al., 2003). It was clear that universally conserved pairwise TCR/MHC contacts did not exist. However, as the number of TCR/MHC structures has increased, some consistent interactions are beginning to emerge for particular sets of related V regions, suggesting that over evolutionary time individual sets of V regions may have accumulated different amino acids in their CDR1/CDR2 regions to guide them toward MHC recognition
The most complete set of data now exist for the mouse Vβ8 family and related Vβs in humans. As mentioned above, Garcia and his colleagues have concentrated on these Vβs and have pointed out the repeated similar use of Vβ CDR2 46Y, 48Y and 54E contacting MHCI and MHCII ligands (Feng et al., 2007; Maynard et al., 2005). They have suggested that these amino acids fit very well the criteria for amino acids that have been selected evolutionarily to react with MHC.
Approaching the question from a very different direction, we predicted the existence of conserved Vα/Vβ CDR1 and CDR2 interactions with MHC based on high frequency of broadly MHC reactive T cells in mice with limited thymic negative selection due to the presence of but a single peptide in their MHCII molecules (Huseby et al., 2005; Ignatowicz et al., 1996). We reasoned that, because TCRs that reacted very well with MHC had not been eliminated in these mice, these TCRs would manifest the evolutionarily conserved reactions of TCRs with MHC better than conventional T cells.
The structures of mouse TCRs bound to IAb/3K reported here support this notion. We studied three TCRs, one from normal mice and highly specific for MHC and peptide and two from MHC/single peptide mice, a second, peptide specific, but broadly allo-MHC reactive, and the third, extremely peptide and MHC crossreactive. All 3 TCRs contained members of the Vβ8 family. Two used related members of the Vα4 family. In all three, the previously noted Vβ8 interactions with the IAb α chain were present, especially those involving Vβ 48Y and 54E. For the two TCRs containing Vα4 family members Vα CDR1 29Y made very similar interactions with the IAb β chain helix. Furthermore, these interactions can be seen in two other published structures using related Vα elements, one from mouse and one from human. Finally, the data suggest that TCR Vα regions that do not contain a 29Y use other amino acids in a consistent way to bind MHC. In the cases described here this is exemplified by Vα 27S/30D in Vαs related to mouse Vα2. By extension, presumably other substitutions, involving other amino acids will apply to other Vαs and Vβs not related to the mouse Vb8s.
Most importantly, when comparing the combination of our and the published structures, the relative contribution of Vβ 48Y/54E and Vα 29Y was greatest for the most crossreactive T cell and least for the most conventional T cells. This observation supports our view that broad crossreactivity associated with the escape from negative selection is the hallmark of the enhanced use of conserved MHC interacting features of TCR CDR1/2 loops. Also relative to our hypothesis, it may be noteworthy that the list of published TCRs available for this analysis does not contain many conventional MHCII/peptide reactive T cells, in that they are mostly from either broadly allo-MHC reactive (D10) or autoimmune T cell (3A6, 1934, 172 (Feng et al., 2007; Li et al., 2005; Maynard et al., 2005)). We suggest that this may be why the conserved amino acid interactions were somewhat more predominant with these TCRs than with the more conventional T cells, such as B3K506 and HA1.7.
One of the questions left unanswered in our previous studies of highly crossreactive T cells was how can these T cells maintain affinity for their ligand, while being quite insensitive to many mutations in the MHC and peptide? The structural answer to this question for the YAe62 TCR is that it uses a considerably smaller, much more hydrophobic, interface with the ligand, than seen with conventional TCRs. This allows the TCR to ignore many mutations, but maintain affinity through energy gained from the hydrophobic effect. Since our IAb/3K mutational data for many other crossreactive TCRs are very similar to that obtained for YAe62, it seems likely that this may be a common explanation for high affinity, broadly crossreactive T cells.
Relevant to this point, it is interesting that tyrosines are emerging as perhaps one of the commonly used amino acids for conserved interaction. Because of their extended hydrophobic surface, tyrosines are particularly well-suited to convert an area of weak van der Waals contacts into a stronger hydrophobic interaction. Furthermore, since this type of interaction is distance, but not particularly geometry, dependent, its strength may be easier to fine tune and it may allow some flexibility to accommodate the variability in pitch and orientation seen with different TCRs. This ability to shift without losing contact may be particularly important for MHCI interaction, where in the published structures thus far Vβ 48Y interacts extensively with the α1 helix, but not nearly in such a fixed position as seen in the MHCII complexes (Buslepp et al., 2003; Colf et al., 2007).
Finally, one of the strongest a priori arguments in favor of the evolutionary hypothesis for the TCR predilection for MHC ligands has been the consistent diagonal engagement of the MHC by the TCR. However, the counter argument can be made that this orientation may be imposed by the need to accommodate CD4 or CD8 into the complex rather than by conserved structural features of the TCR (Mazza and Malissen, 2007; van Laethem et al., 2007). Our analysis of our and other structures offers support for the idea of a structural imposition of this engagement geometry. In the TCR/MHC structures that contain Vα CDR1 29Y or Vα CDR1 27S/30D and Vβ CDR2 48Y and 54E the sites of interaction on the MHC α and β chains are similar and conserved in mouse and human MHCII molecules. Figure 8 shows the positions of these amino acids on the IAb/3K ligand for YAe62/2W20, with a line showing the central diagonal axis with which these TCRs dock onto IAb. The interaction sites of these amino acids on IAb lie at the same diagonal angle on MHC, but to one side of the central axis. Given that Vα CDR2 and Vβ CDR1 residues will lie on the other side of the central axis, and that some residues in these regions may also have been evolutionarily selected to react with MHC, this Figure suggests that the diagonal docking mode of TCR on MHC is determined, at least in part, by the binding of evolutionarily conserved residues in V region CDRs with their target sites on MHC.
Figure 8. The evolutionarily conserved, MHC binding amino acids impose diagonal binding of the TCR on MHCII.
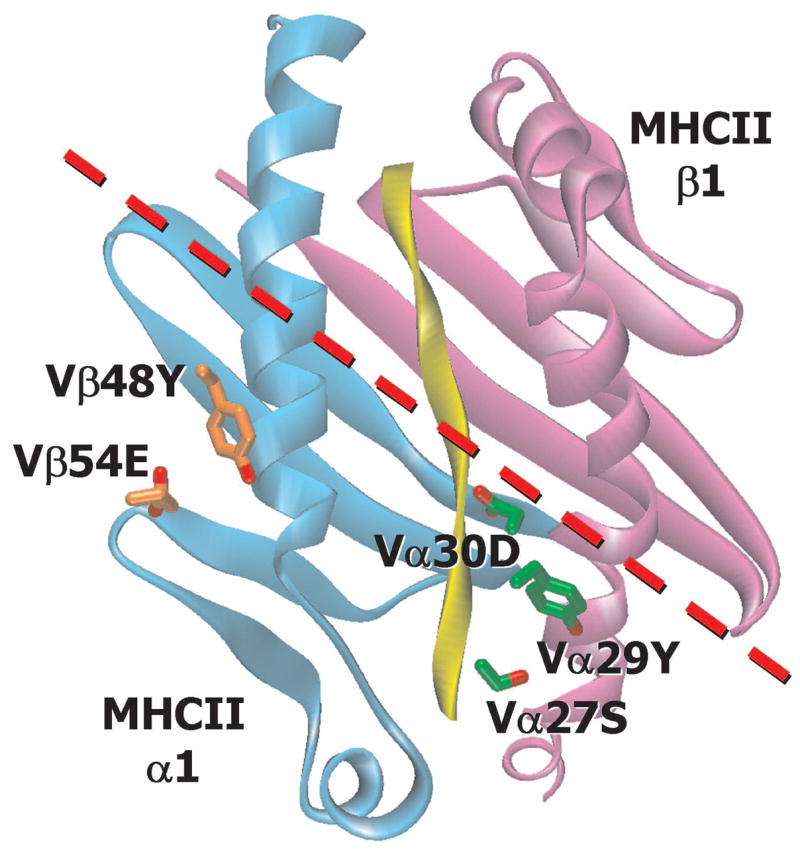
A ribbon representation of the α1 (cyan), β1(magenta) and peptide (yellow) portion of IAb/3K is shown. The sidechains of Vα 29Y (carbon-green and oxygen-red) and Vβ 48Y and 54E (carbon – orange and oxygen – red) of the YAe62 TCR and 27S/30D of the 2W20are shown. A red dotted line represents the central axis of the YAe62 TCR through the CDR regions (Vβ CDR2, Vα CDR3 and Vα CDR1, below and Vβ CDR1, Vβ CDR3 and Vα CDR2, above).
There are not enough structures to make as strong a case for conserved amino acids in other sets of Vα and Vβ elements. However, it is worth noting that MHCII β chain amino acids 76, 77 and 81, the site of Vα 29Y interaction, are invariably at the site of Vα CDR1 interaction with MHCII for TCRs using other Vα elements. Also MHCII α chain amino acid 57, 60 and 61, the site of Vβ 48Y and 54E interaction, are nearly always involved in CDR2 interaction with MHCII for TCRs using other Vβ elements. Similarly positioned conserved sites on MHCI molecules are often involved in other Vα CDR1 and Vβ CDR2 engagements (Marrack et al., 2008). It seems likely that conserved amino acids within the CDR1/2 loops of these other V elements will emerge eventually from the structural data. Our hypothesis predicts that, for normal T cells, in any given complex some of these conserved features may be weakened due to the requirements imposed to survive negative selection. Therefore, a population of T cells that have not undergone complete negative selection may again be the best place to look for these features for these other V elements.
EXPERIMENTAL PROCEDURES
Protein Expression and purification
Soluble IAb/3K was produced as previously described in baculovirus infected insect cells (Liu et al., 2002). DNA fragments encoding the Vα and Vβ portions of the mouse YAe62 and B3K506 TCRs (Huseby et al., 2005) were cloned into variants of a previously reported expression vector ((Tynan et al., 2007), kindly provided by Drs. J. McClusky and J. Rossjohn) fused to human Cα and Cβ, respectively. The completed and sequenced constructs were used to transform the Rosetta2 strain of E coli (Novagen). Functional, soluble TCR was produced as previously described (Clements et al., 2002) by refolding mixtures of denatured α and β chains isolated from inclusion bodies made in the transformed bacteria. The re-folded TCRs were further purified by the combination of FPLC size exclusion and ion exchange chromatography. A soluble form of the 2W20 TCR, with mouse Cα and Cβ was produced in baculovirus infected insect cells as previously described (Huseby et al., 2005). All 3 TCRs were tested by surface plasmon resonance for binding to IAb/3K to assure functionality. (Huseby et al., 2006). The sequences of the V region portions of all of the constructs are shown in Supplemental Figure. 1
Crystal Production and data collection
Prior to the crystallization trials, non-covalent complexes of TCR/MHC/peptide complexes were obtained by mixing the proteins at equimolar concentrations. Crystallization was performed by the hanging-drop vapor diffusion method at room temperature. The complex of the B3K506 TCR with IAb/3K was crystallized by mixing 0.5 μl of complex solution at a concentration of 10 mg/ml with an equal volume of reservoir solution containing 17% PEG4000, 100mM sodium citrate, 100 mM sodium cacodylate pH5.1. The 2W20 TCR complex with IAb/3K was crystallized in 16% PEG4000, 100mM calcium acetate, 100 mM sodium cacodylate pH6.0. The crystals were harvested after two months. Crystals of the YAe62 TCR complexed with IAb/3K were obtained in 15% PEG4000, 10% glycerol, 100mM ammonium citrate, 100 mM sodium cacodylate pH5.7. Crystals normally formed within 2 weeks.
X-ray diffraction data were collected under liquid-nitrogen cryo-conditions at 100°K. Several data sets of B3K506/IAb/3K, YAe62/IAb/3K and 2W20/IAb/3K complexes were collected at ID22, SBC ID19, APS and BL8.2.2, BL4.2.2, ALS. B3K506/IAb/3K and 2W20/IAb/3K crystals were flash-cooled in liquid nitrogen after a flash-soak in a cryoprotection solution consisting of the reservoir solution with a higher concentration of PEG4000 (35 % (w/v)), and YAe62/IAb/3K crystals were frozen by directly dipping the crystals into liquid nitrogen. The data were indexed, integrated, scaled and merged using HKL2000 (Otwinowski and Minor, 1997). The B3K506/IAb/3K crystal belonged to the monoclinic space group P21 with two complexes in the asymmetric unit. The crystals of YAe62/IAb/3K and 2W20/IAb/3K belonged to the orthorhombic space group P212121 with two complexes in the asymmetric unit. The statistics of for crystallographic data are summarized in Supplemental Table 1.
Structure determination
The structures of B3K506 TCR/IAb/3K and YAe62 TCR/IAb/3K complexes were determined by molecular replacement using AmoRe (Navaraza, 1994) and Phaser (McCoy et al., 2005) with the SB27 TCR (PDB 2AK4) and IAb/3K (PDB 1LNU) as search models, respectively. 2W20 TCR/IAb/3K structure was solved by molecular replacement method using YAe62 TCR/IAb/3K as the search model. For all three structures there were two TCR/IAb/3K complexes per asymmetric unit. After an initial round of rigid-body refinement, the models were inspected and manually fitted with Program O (Jones and Kjeldgaard, 1997; Kleywegt et al., 2001). The models were then subjected to several rounds of alternating simulated annealing/positional refinement in CNS (Brunger et al., 1998) followed by B factor refinement in CNS. Model building was performed using program O. Simulated annealing omit maps were routinely used to remove the model bias. All models have good stereochemistry, as determined by the program Procheck (Laskowski et al., 1993). The statistics for the structures are summarized in Supplemental Table 1 and representative electron density data for the structures are shown in Supplemental Figure 3.
Structure analysis
For analysis one complex of the two in the asymmetric unit was chosen on the basis of the fewest V-region crystal contacts. This was most important for the B3K506 structure in which extensive V region crystal contacts in one of the complexes had clearly distorted the TCR/MHC interface. Buried molecular surface areas were calculated using GRASP (probe radius 1.4 Å) (Nicholls et al., 1991). The tilt angles between TCR and MHC were determined with the program LSQMAN (Kleywegt and Jones, 1994). NCONT in CCP4 (Collaborative Computational_Project_No4, 1994) was used to analyze the contacts between the TCRs and their ligands. Atoms within 4.5Å of each other were considered part of the interface. Contacts involving potential electron donors and acceptors (O or N) within 3.5Å were considered potential hydrogen bonds or salt bridges. Other contacts were considered van der Waals contacts. The total list of atomic interactions are show in in Supplemental Figure 2. Molecular superimpositions were performed with Swiss PDBViewer (Guex and Peitsch, 1997). Figures were created with WebLab Veiwer Pro 4.0. (Molecular Simulations, Inc).
Nomenclature and amino acid numbering
Vβs and Vαs are named and their amino acids numbered according to the IUIS/Arden compilation (Arden et al., 1995; Clark et al., 1995). Mouse IA α chains have a single amino acid insertion at position 10 compared to the HLA-DR and mouse IE α chain. However, DRα/Eα numbering is used here for consistency with previous papers.
Analysis of the function of TCRs mutated in V region amino acids
TCR mutants were constructed using PCR with overlapping primers and cloned into engineered restriction sites. TCRα constructs were cloned in MSCV-based retroviral plasmids with an IRES plus GFP as a reporter (Persons et al., 1997). TCRβ constructs were cloned in MSCV-based retroviral plasmids with an IRES plus human nerve growth factor receptor (Pearce et al., 2003) or GFP as a reporter .
TCR constructs in retroviral plasmids were co-transfected into Phoenix cells with pCLEco accessory plasmid using Lipofectamine 2000 (Invitrogen, Carlsbad, CA) according to the manufacturer’s instructions. Retrovirus-containing supernatants were harvested 48 hrs after transfection and centrifuged to remove cell debris. All TCR constructs were expressed by retroviral transduction in 5KC-73.8.20, a T cell hybridoma that lacks endogenous TCRα and β chains (White et al., 1993). 105 hybridoma T cells were spin-infected with retroviral supernatants containing 8 μg/ml polybrene for 90 min at 37°C. Mutant TCRα or TCRβ chains were co-expressed with the appropriate wild type partner. Cells were sorted (MoFlo, Dakocytomation, Denmark) for equivalent expression of TCR and CD4. Responses were assessed by IL-2 production in response to fibroblasts bearing IAb/3K and B7 and ICAM-1 or spleen cells bearing allo-MHC (Huseby et al., 2006; Huseby et al., 2005).
Supplementary Material
Supplemental Figure 1. Sequences of the Vα and Vβ Portions of the TCRs (SupFigure 1.doc). This is an MS Word file containing the DNA and protein sequences of the V -region portions of the three TCRs used in this study after cloning in the vectors used for expression as described in the Experimental Methods.
Supplemental Figure 2 – TCR contacts with IAb/3K (Sup Figure 2.xls). This is an MS Excel spreadsheet listing the atom to atom contacts between the three TCRs used in this study and their IAb/3K ligands.
Supplemental Figure 3. Examples of electron density (Sup Figure 3.Tif). 2Fo-Fc electron density maps contoured at 1σ are shown for the A) B3K506 (2.55Å), B) 2W20 (3.40Å) and C) YAe62 (3.05Å) complexes in the area of contact between Vβ 48Y and 54E and the IAb α chain helix. Vβ CDR2 (green) and IAb α1 helix (cyan).
Supplemental Table 1. Data collection and refinement statistics
Acknowledgments
The authors thank Janice White, Rachel Fruge, Ella Kushnir and Christopher Brown for technical assistance, Corie Ralston and Stephen Ginell at the APS and Albert Fu and Jay Nix at the ALS for assistance in x-ray data collection and Randy Anselment and Amy Marrs in the NJMRC. We appreciate helpful input from Dr. Laurent Gapin at NJMRC and Dr. Chris Garcia at Stanford University. This work was supported in part by USPHS grants AI-17134, AI-18785 and AI-22295 and donations from Alan LaPorte and the Zuckerman Family to the X-ray facility at NJMRC. W.A.M. was supported by the Australian NHMRC, Victoria State Government and Monash University
Footnotes
ACCESSION NUMBERS
The coordinates for the B3K506, 2W20 and YAe62 TCR bound to IAb/3K have been deposited in the PDB with accession numbers XXXX, XXXX and XXXX, respectively.
Publisher's Disclaimer: This is a PDF file of an unedited manuscript that has been accepted for publication. As a service to our customers we are providing this early version of the manuscript. The manuscript will undergo copyediting, typesetting, and review of the resulting proof before it is published in its final citable form. Please note that during the production process errors may be discovered which could affect the content, and all legal disclaimers that apply to the journal pertain.
References
- Arden B, Clark SP, Kabelitz D, Mak TW. Mouse T-cell receptor variable gene segment families. Immunogenetics. 1995;42:501–530. doi: 10.1007/BF00172177. [DOI] [PubMed] [Google Scholar]
- Ashton-Rickardt PG, Bandeira A, Delaney JR, Van Kaer L, Pircher HP, Zinkernagel RM, Tonegawa S. Evidence for a differential avidity model of T cell selection in the thymus. Cell. 1994;76:651–663. doi: 10.1016/0092-8674(94)90505-3. [DOI] [PubMed] [Google Scholar]
- Blackman M, Yague J, Kubo R, Gay D, Coleclough C, Palmer E, Kappler J, Marrack P. The T cell repertoire may be biased in favor of MHC recognition. Cell. 1986;47:349–357. doi: 10.1016/0092-8674(86)90591-x. [DOI] [PubMed] [Google Scholar]
- Bluthmann H, Kisielow P, Uematsu Y, Malissen M, Krimpenfort P, Berns A, von Boehmer H, Steinmetz M. T-cell-specific deletion of T-cell receptor transgenes allows functional rearrangement of endogenous alpha- and beta-genes. Nature. 1988;334:156–159. doi: 10.1038/334156a0. [DOI] [PubMed] [Google Scholar]
- Brunger AT, Adams PD, Clore GM, DeLano WL, Gros P, Grosse-Kunstleve RW, Jiang JS, Kuszewski J, Nilges M, Pannu NS, et al. Crystallography & NMR system: A new software suite for macromolecular structure determination. Acta Crystallogr D Biol Crystallogr. 1998;54 ( Pt 5):905–921. doi: 10.1107/s0907444998003254. [DOI] [PubMed] [Google Scholar]
- Buslepp J, Wang H, Biddison WE, Appella E, Collins EJ. A correlation between TCR Valpha docking on MHC and CD8 dependence: implications for T cell selection. Immunity. 2003;19:595–606. doi: 10.1016/s1074-7613(03)00269-3. [DOI] [PubMed] [Google Scholar]
- Clark SP, Arden B, Kabelitz D, Mak TW. Comparison of human and mouse T-cell receptor variable gene segment subfamilies. Immunogenetics. 1995;42:531–540. doi: 10.1007/BF00172178. [DOI] [PubMed] [Google Scholar]
- Clements CS, Kjer-Nielsen L, MacDonald WA, Brooks AG, Purcell AW, McCluskey J, Rossjohn J. The production, purification and crystallization of a soluble heterodimeric form of a highly selected T-cell receptor in its unliganded and liganded state. Acta Crystallogr D Biol Crystallogr. 2002;58:2131–2134. doi: 10.1107/s0907444902015482. [DOI] [PubMed] [Google Scholar]
- Colf LA, Bankovich AJ, Hanick NA, Bowerman NA, Jones LL, Kranz DM, Garcia KC. How a single T cell receptor recognizes both self and foreign MHC. Cell. 2007;129:135–146. doi: 10.1016/j.cell.2007.01.048. [DOI] [PubMed] [Google Scholar]
- Collaborative_Computational_Project_No4. The CCP4 suite: Programs for protein crystallography. Acta Crystallog sect D. 1994;50:760–763. doi: 10.1107/S0907444994003112. [DOI] [PubMed] [Google Scholar]
- Davis MM, Bjorkman PJ. T-cell antigen receptor genes and T-cell recognition. Nature. 1988;334:395–402. doi: 10.1038/334395a0. [DOI] [PubMed] [Google Scholar]
- Feng D, Bond CJ, Ely LK, Maynard J, Garcia KC. Structural evidence for a germline-encoded T cell receptor-major histocompatibility complex interaction ‘codon’. Nat Immunol. 2007;8:975–983. doi: 10.1038/ni1502. [DOI] [PubMed] [Google Scholar]
- Fink PJ, Bevan MJ. H-2 antigens of the thymus determine lymphocyte specificity. J Exp Med. 1978;148:766–775. doi: 10.1084/jem.148.3.766. [DOI] [PMC free article] [PubMed] [Google Scholar]
- Fung-Leung WP, Surh CD, Liljedahl M, Pang J, Leturcq D, Peterson PA, Webb SR, Karlsson L. Antigen presentation and T cell development in H2-M-deficient mice. Science. 1996;271:1278–1281. doi: 10.1126/science.271.5253.1278. [DOI] [PubMed] [Google Scholar]
- Garboczi DN, Biddison WE. Shapes of MHC restriction. Immunity. 1999;10:1–7. doi: 10.1016/s1074-7613(00)80001-1. [DOI] [PubMed] [Google Scholar]
- Garboczi DN, Ghosh P, Utz U, Fan QR, Biddison WE, Wiley DC. Structure of the complex between human T-cell receptor, viral peptide and HLA-A2. Nature. 1996;384:134–141. doi: 10.1038/384134a0. [DOI] [PubMed] [Google Scholar]
- Garcia KC, Degano M, Pease LR, Huang M, Peterson PA, Teyton L, Wilson IA. Structural basis of plasticity in T cell receptor recognition of a self peptide-MHC antigen. Science. 1998;279:1166–1172. doi: 10.1126/science.279.5354.1166. [DOI] [PubMed] [Google Scholar]
- Garcia KC, Degano M, Stanfield RL, Brunmark A, Jackson MR, Peterson PA, Teyton L, Wilson IA. An alphabeta T cell receptor structure at 2.5 A and its orientation in the TCR-MHC complex. Science. 1996;274:209–219. doi: 10.1126/science.274.5285.209. [DOI] [PubMed] [Google Scholar]
- Guex N, Peitsch MC. SWISS-MODEL and the Swiss-PdbViewer: an environment for comparative protein modeling. Electrophoresis. 1997;18:2714–2723. doi: 10.1002/elps.1150181505. [DOI] [PubMed] [Google Scholar]
- Hennecke J, Carfi A, Wiley DC. Structure of a covalently stabilized complex of a human alphabeta T-cell receptor, influenza HA peptide and MHC class II molecule, HLA-DR1. Embo J. 2000;19:5611–5624. doi: 10.1093/emboj/19.21.5611. [DOI] [PMC free article] [PubMed] [Google Scholar]
- Hennecke J, Wiley DC. Structure of a complex of the human alpha/beta T cell receptor (TCR) HA1.7, influenza hemagglutinin peptide, and major histocompatibility complex class II molecule, HLA-DR4 (DRA*0101 and DRB1*0401): insight into TCR cross-restriction and alloreactivity. J Exp Med. 2002;195:571–581. doi: 10.1084/jem.20011194. [DOI] [PMC free article] [PubMed] [Google Scholar]
- Hogquist KA, Jameson SC, Heath WR, Howard JL, Bevan MJ, Carbone FR. T cell receptor antagonist peptides induce positive selection. Cell. 1994;76:17–27. doi: 10.1016/0092-8674(94)90169-4. [DOI] [PubMed] [Google Scholar]
- Huseby ES, Crawford F, White J, Kappler J, Marrack P. Negative selection imparts peptide specificity to the mature T cell repertoire. Proc Natl Acad Sci U S A. 2003;100:11565–11570. doi: 10.1073/pnas.1934636100. [DOI] [PMC free article] [PubMed] [Google Scholar]
- Huseby ES, Crawford F, White J, Marrack P, Kappler JW. Interface-disrupting amino acids establish specificity between T cell receptors and complexes of major histocompatibility complex and peptide. Nat Immunol. 2006;7:1191–1199. doi: 10.1038/ni1401. [DOI] [PubMed] [Google Scholar]
- Huseby ES, White J, Crawford F, Vass T, Becker D, Pinilla C, Marrack P, Kappler JW. How the T cell repertoire becomes peptide and MHC specific. Cell. 2005;122:247–260. doi: 10.1016/j.cell.2005.05.013. [DOI] [PubMed] [Google Scholar]
- Ignatowicz L, Kappler J, Marrack P. The repertoire of T cells shaped by a single MHC/peptide ligand. Cell. 1996;84:521–529. doi: 10.1016/s0092-8674(00)81028-4. [DOI] [PubMed] [Google Scholar]
- Jerne NK. The somatic generation of immune recognition. Eur J Immunol. 1971;1:1–9. doi: 10.1002/eji.1830010102. [DOI] [PubMed] [Google Scholar]
- Jones TA, Kjeldgaard M. Electron-density map interpretation. Methods in Enzymology. 1997;277:173–207. doi: 10.1016/s0076-6879(97)77012-5. [DOI] [PubMed] [Google Scholar]
- Kappler JW, Roehm N, Marrack P. T cell tolerance by clonal elimination in the thymus. Cell. 1987;49:273–280. doi: 10.1016/0092-8674(87)90568-x. [DOI] [PubMed] [Google Scholar]
- Kjer-Nielsen L, Clements CS, Purcell AW, Brooks AG, Whisstock JC, Burrows SR, McCluskey J, Rossjohn J. A structural basis for the selection of dominant alphabeta T cell receptors in antiviral immunity. Immunity. 2003;18:53–64. doi: 10.1016/s1074-7613(02)00513-7. [DOI] [PubMed] [Google Scholar]
- Kleywegt GJ, Jones TA. A super position. CCP4/ESF-EACBM Newsletter on Protein Crystallography. 1994:9–14. [Google Scholar]
- Kleywegt GJ, Zou JY, Kjeldgaard M, Jones TA. Crystallography of Biological Macromolecules. Dordrecht (The Netherlands): Kluwer Academic Publishers; 2001. Around O, In International Tables for Crystallography; pp. 353–367. [Google Scholar]
- Laskowski R, MacArthur M, Moss D, Thorton J. PROCHECK: a program to check the stereochemical quality of protein structures. J Appl Crystallogr. 1993;26:283–291. [Google Scholar]
- Lefranc MP, Pommie C, Ruiz M, Giudicelli V, Foulquier E, Truong L, Thouvenin-Contet V, Lefranc G. IMGT unique numbering for immunoglobulin and T cell receptor variable domains and Ig superfamily V-like domains. Dev Comp Immunol. 2003;27:55–77. doi: 10.1016/s0145-305x(02)00039-3. [DOI] [PubMed] [Google Scholar]
- Li Y, Huang Y, Lue J, Quandt JA, Martin R, Mariuzza RA. Structure of a human autoimmune TCR bound to a myelin basic protein self-peptide and a multiple sclerosis-associated MHC class II molecule. Embo J. 2005;24:2968–2979. doi: 10.1038/sj.emboj.7600771. [DOI] [PMC free article] [PubMed] [Google Scholar]
- Liu X, Dai S, Crawford F, Fruge R, Marrack P, Kappler J. Alternate interactions define the binding of peptides to the MHC molecule IA(b) Proc Natl Acad Sci U S A. 2002;99:8820–8825. doi: 10.1073/pnas.132272099. [DOI] [PMC free article] [PubMed] [Google Scholar]
- Luz JG, Huang M, Garcia KC, Rudolph MG, Apostolopoulos V, Teyton L, Wilson IA. Structural comparison of allogeneic and syngeneic T cell receptor-peptide-major histocompatibility complex complexes: a buried alloreactive mutation subtly alters peptide presentation substantially increasing V(beta) Interactions. J Exp Med. 2002;195:1175–1186. doi: 10.1084/jem.20011644. [DOI] [PMC free article] [PubMed] [Google Scholar]
- Marrack P, Kappler J. The T cell receptor. Science. 1987;238:1073–1079. doi: 10.1126/science.3317824. [DOI] [PubMed] [Google Scholar]
- Marrack P, Scott-Browne JP, Dai S, Gapin L, Kappler JW. Evolutionarily conserved amino acids in TCR V regions and MHC control their interaction. Annual Reviews of Immunology. 2008 doi: 10.1146/annurev.immunol.26.021607.090421. Submitted for publication. [DOI] [PMC free article] [PubMed] [Google Scholar]
- Martin WD, Hicks GG, Mendiratta SK, Leva HI, Ruley HE, Van Kaer L. H2-M mutant mice are defective in the peptide loading of class II molecules, antigen presentation, and T cell repertoire selection. Cell. 1996;84:543–550. doi: 10.1016/s0092-8674(00)81030-2. [DOI] [PubMed] [Google Scholar]
- Maynard J, Petersson K, Wilson DH, Adams EJ, Blondelle SE, Boulanger MJ, Wilson DB, Garcia KC. Structure of an autoimmune T cell receptor complexed with class II peptide-MHC: insights into MHC bias and antigen specificity. Immunity. 2005;22:81–92. doi: 10.1016/j.immuni.2004.11.015. [DOI] [PubMed] [Google Scholar]
- Mazza C, Malissen B. What guides MHC-restricted TCR recognition? Semin Immunol. 2007;19:225–235. doi: 10.1016/j.smim.2007.03.003. [DOI] [PubMed] [Google Scholar]
- McCoy AJ, Grosse-Kunstleve RW, Storoni LC, Read RJ. Likelihood-enhanced fast translation functions. Acta Crystallogr D Biol Crystallogr. 2005;61:458–464. doi: 10.1107/S0907444905001617. [DOI] [PubMed] [Google Scholar]
- Merkenschlager M, Graf D, Lovatt M, Bommhardt U, Zamoyska R, Fisher AG. How many thymocytes audition for selection? J Exp Med. 1997;186:1149–1158. doi: 10.1084/jem.186.7.1149. [DOI] [PMC free article] [PubMed] [Google Scholar]
- Miyazaki T, Wolf P, Tourne S, Waltzinger C, Dierich A, Barois N, Ploegh H, Benoist C, Mathis D. Mice lacking H2-M complexes, enigmatic elements of the MHC class II peptide-loading pathway. Cell. 1996;84:531–541. doi: 10.1016/s0092-8674(00)81029-6. [DOI] [PubMed] [Google Scholar]
- Navaraza J. AMoRe: an automated package for molecular replacement. Acta Crystallog sect A. 1994;50:157–163. [Google Scholar]
- Nicholls A, Sharp KA, Honig B. Protein folding and association: Insights from the interfacial and thermodynamic properties of hydrocarbons. Proteins: Structure, Function, and Genetics. 1991;11:281–296. doi: 10.1002/prot.340110407. [DOI] [PubMed] [Google Scholar]
- Otwinowski Z, Minor W. Processing of X-ray diffraction data dollected in oscillation mode. In: Carter J, Sweet CWRM, editors. Macromolecular Crystallography Part A. Academic Press; 1997. pp. 307–326. [DOI] [PubMed] [Google Scholar]
- Pearce EL, Mullen AC, Martins GA, Krawczyk CM, Hutchins AS, Zediak VP, Banica M, DiCioccio CB, Gross DA, Mao CA, et al. Control of effector CD8+ T cell function by the transcription factor Eomesodermin. Science. 2003;302:1041–1043. doi: 10.1126/science.1090148. [DOI] [PubMed] [Google Scholar]
- Persons DA, Allay JA, Allay ER, Smeyne RJ, Ashmun RA, Sorrentino BP, Nienhuis AW. Retroviral-mediated transfer of the green fluorescent protein gene into murine hematopoietic cells facilitates scoring and selection of transduced progenitors in vitro and identification of genetically modified cells in vivo. Blood. 1997;90:1777–1786. [PubMed] [Google Scholar]
- Rees W, Bender J, Teague TK, Kedl RM, Crawford F, Marrack P, Kappler J. An inverse relationship between T cell receptor affinity and antigen dose during CD4(+) T cell responses in vivo and in vitro. Proc Natl Acad Sci U S A. 1999;96:9781–9786. doi: 10.1073/pnas.96.17.9781. [DOI] [PMC free article] [PubMed] [Google Scholar]
- Reinherz EL, Tan K, Tang L, Kern P, Liu J, Xiong Y, Hussey RE, Smolyar A, Hare B, Zhang R, et al. The crystal structure of a T cell receptor in complex with peptide and MHC class II. Science. 1999;286:1913–1921. doi: 10.1126/science.286.5446.1913. [DOI] [PubMed] [Google Scholar]
- Reiser JB, Darnault C, Gregoire C, Mosser T, Mazza G, Kearney A, van der Merwe PA, Fontecilla-Camps JC, Housset D, Malissen B. CDR3 loop flexibility contributes to the degeneracy of TCR recognition. Nat Immunol. 2003;4:241–247. doi: 10.1038/ni891. [DOI] [PubMed] [Google Scholar]
- Rudolph MG, Stanfield RL, Wilson IA. How TCRs bind MHCs, peptides, and coreceptors. Annu Rev Immunol. 2006;24:419–466. doi: 10.1146/annurev.immunol.23.021704.115658. [DOI] [PubMed] [Google Scholar]
- Sebzda E, Wallace VA, Mayer J, Yeung RS, Mak TW, Ohashi PS. Positive and negative thymocyte selection induced by different concentrations of a single peptide. Science. 1994;263:1615–1618. doi: 10.1126/science.8128249. [DOI] [PubMed] [Google Scholar]
- Siliciano RF, Keegan AD, Dintzis RZ, Dintzis HM, Shin HS. The interaction of nominal antigen with T cell antigen receptors. I. Specific binding of multivalent nominal antigen to cytolytic T cell clones. J Immunol. 1985;135:906–914. [PubMed] [Google Scholar]
- Sprent J, Lo D, Gao EK, Ron Y. T cell selection in the thymus. Immunol Rev. 1988;101:173–190. doi: 10.1111/j.1600-065x.1988.tb00737.x. [DOI] [PubMed] [Google Scholar]
- Stewart-Jones GB, McMichael AJ, Bell JI, Stuart DI, Jones EY. A structural basis for immunodominant human T cell receptor recognition. Nat Immunol. 2003;4:657–663. doi: 10.1038/ni942. [DOI] [PubMed] [Google Scholar]
- Tynan FE, Reid HH, Kjer-Nielsen L, Miles JJ, Wilce MC, Kostenko L, Borg NA, Williamson NA, Beddoe T, Purcell AW, et al. A T cell receptor flattens a bulged antigenic peptide presented by a major histocompatibility complex class I molecule. Nat Immunol. 2007;8:268–276. doi: 10.1038/ni1432. [DOI] [PubMed] [Google Scholar]
- van Laethem F, Sarafova SD, Park J-H, Tai X, Pobezinsky L, Guinter TI, Adoro A, Adams A, Sharrow SO, Feigenbaum L, Singer A. Deletion of CD4 and CD8 coreceptors permits generation of ab T cells that recognize antigens independently of MHC. Immunity. 2007;27 doi: 10.1016/j.immuni.2007.10.007. in press. [DOI] [PubMed] [Google Scholar]
- White J, Pullen A, Choi K, Marrack P, Kappler JW. Antigen recognition properties of mutant V beta 3+ T cell receptors are consistent with an immunoglobulin-like structure for the receptor. J Exp Med. 1993;177:119–125. doi: 10.1084/jem.177.1.119. [DOI] [PMC free article] [PubMed] [Google Scholar]
- Zerrahn J, Held W, Raulet DH. The MHC reactivity of the T cell repertoire prior to positive and negative selection. Cell. 1997;88:627–636. doi: 10.1016/s0092-8674(00)81905-4. [DOI] [PubMed] [Google Scholar]
- Zinkernagel RM, Callahan GN, Althage A, Cooper S, Klein PA, Klein J. On the thymus in the differentiation of “H-2 self-recognition” by T cells: evidence for dual recognition? J Exp Med. 1978;147:882–896. doi: 10.1084/jem.147.3.882. [DOI] [PMC free article] [PubMed] [Google Scholar]
Associated Data
This section collects any data citations, data availability statements, or supplementary materials included in this article.
Supplementary Materials
Supplemental Figure 1. Sequences of the Vα and Vβ Portions of the TCRs (SupFigure 1.doc). This is an MS Word file containing the DNA and protein sequences of the V -region portions of the three TCRs used in this study after cloning in the vectors used for expression as described in the Experimental Methods.
Supplemental Figure 2 – TCR contacts with IAb/3K (Sup Figure 2.xls). This is an MS Excel spreadsheet listing the atom to atom contacts between the three TCRs used in this study and their IAb/3K ligands.
Supplemental Figure 3. Examples of electron density (Sup Figure 3.Tif). 2Fo-Fc electron density maps contoured at 1σ are shown for the A) B3K506 (2.55Å), B) 2W20 (3.40Å) and C) YAe62 (3.05Å) complexes in the area of contact between Vβ 48Y and 54E and the IAb α chain helix. Vβ CDR2 (green) and IAb α1 helix (cyan).
Supplemental Table 1. Data collection and refinement statistics