Abstract
The structure of two Thermotoga maritima proteins, a conserved hypothetical protein (TM0160) and a transcriptional regulator (TM1171), have now been determined at 1.9 Å and 2.3 Å resolution, respectively, as part of a large-scale structural genomics project. Our first efforts to crystallize full-length versions of these targets were unsuccessful. However, analysis of the recombinant purified proteins using the technique of enhanced amide hydrogen/deuterium exchange mass spectroscopy (DXMS) revealed substantial regions of rapid amide deuterium hydrogen exchange, consistent with flexible regions of the structures. Based on these exchange data, truncations were designed to selectively remove the disordered C-terminal regions, and the resulting daughter proteins showed greatly enhanced crystallizability. Comparative DXMS analysis of full-length protein versus truncated forms demonstrated complete and exact preservation of the exchange rate profiles in the retained sequence, indicative of conservation of the native folded structure. This study presents the first structures produced with the aid of the DXMS method for salvaging intractable crystallization targets. The structure of TM0160 represents a new fold and highlights the use of this approach where any prior structural knowledge is absent. The structure of TM1171 represents an example where the lack of a substrate/cofactor may impair crystallization. The details of both structures are presented and discussed.
Keywords: crystallization, mass spectrometry, protein structure, novel fold, sequence complexity
Structural genomics initiatives that attempt to elucidate structures for an entire proteome are currently ongoing (Lesley et al. 2002). Coupled with this endeavor is the determination of structures for which very little biochemical or structural information is known. Such structures are often classified as “hypothetical proteins,” as they have no significant match in sequence comparison searches with proteins of known function. This situation presents a unique problem to structural genomics, as most structures to be analyzed are biochemically characterized. Therefore, crystallographers must rely on structure prediction algorithms for insight into expression construct design and analysis. Problematic proteins may require modification or the addition of a substrate/cofactor to permit crystallization, yet little can be predicted based on existing structural information or primary sequence beyond features like sequence complexity by using programs such as SEG (Wootton and Federhen 1993) or the vast array of secondary structure prediction algorithms (Barton 1995 and references within). It is generally accepted that inherent disorder within proteins can prevent crystallization by inhibiting the formation of stable crystal contacts and thereby reduce the probability of nucleation.
Although predictive algorithms of disorder and domain boundaries are useful in providing a basis for experimental design, an analytical method that is independent of structural prediction is necessary in the case of novel protein folds or weakly conserved structures. One of the most powerful techniques to provide protein dynamics prediction is NMR spectroscopy (Wand 2001). A number of technical obstacles arise in applying this approach in a large-scale structural effort due to sample preparation requirements and the allowable target size. In addition, precise localization of disorder by NMR requires substantial and time-consuming data analysis, which is contrary to the necessity for screening of multiple targets. Limited proteolysis coupled to mass spectrometry is another preferred approach (Cohen et al. 1995). Proteolysis, however, may clip internal loops, leading to destabilization and proteolysis of structured regions. A rapid and nondisruptive method for characterizing protein flexibility with amino acid-level resolution would therefore be desirable.
The DXMS method (Woods Jr. 2001; Woods Jr. and Hamuro 2001; Hamuro et al. 2002a,b, 2003; Englander et al. 2003; Pantazatos et al. 2004) provides an attractive alternative to these approaches by coupling the labeling of flexible and solvent-exposed regions in the native protein with simple and sensitive detection and analysis. By using the DXMS method, we have rapidly and precisely identified regions of disorder and selectively deleted them from constructs, resulting in a marked improvement in crystallization propensity.
The Thermotoga maritima proteome is actively being pursued as a structural genomics target by the Joint Center for Structural Genomics. As part of this effort, screening of the entire proteome for crystallizability was undertaken (Lesley et al. 2002). While the majority of those proteins that were expressed in soluble form could be crystallized using automated nano-scale crystallization screens (Santarsiero et al. 2002), ~20% of the soluble proteins did not produce any significant crystal hits in this initial attempt. Two such proteins are TM0160 and TM1171. The former is classified as a hypothetical protein without any analogous structural or functional data from homologs, while the latter is a transcriptional regulator with some structural homologs and clearly defined domains annotated by databases such as SCOP (Murzin et al. 1995) and Pfam (Bateman et al. 2002). These two proteins, therefore, represent two classes that are readily addressable by DXMS analysis. The first class contains novel proteins with little or no structural information available. For construct design, these proteins are typically analyzed for predicted secondary structure and for regions of low complexity from primary sequence. The second class includes proteins for which structural information is available, but where flexibility induced by the absence of substrates/cofactors or inherent flexibility between domains makes the selection of constructs difficult or ambiguous. We describe here the first use of DXMS analysis to salvage unsuccessful crystallization targets from each of these classes and the successful outcome that resulted in high-resolution crystal structures.
Results
Domain definition in the absence of structural information
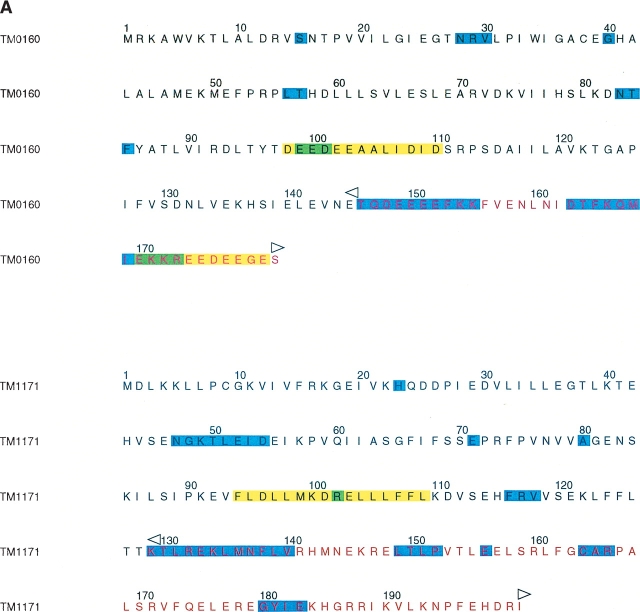
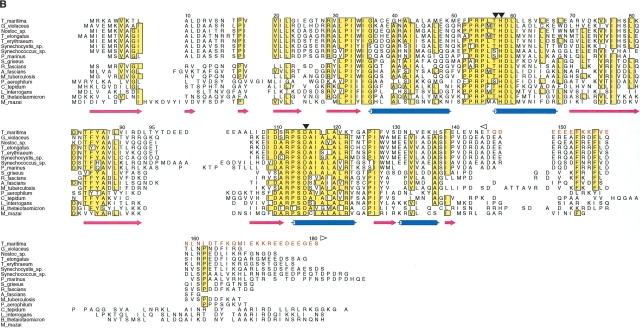
Deuterium exchange maps were generated initially for the full-length TM0160 and TM1171 proteins (Pantazatos et al. 2004). This initial mapping was performed with a 10-sec labeling reaction that was previously demonstrated to be sufficient to allow identification of rapidly exchanging and, therefore, likely disordered regions. The TM0160 map indicates that a region of rapid exchange is located in the C terminus of the protein (residues 146–156 and 163–175). The amino acid complexity of this region is somewhat low, with significant stretches of acidic amino acids. Sequence alignments with 16 of the closest sequence homologs identified three regions of completely conserved amino acids at positions 31–34, 54–61, and 112–127 (Fig. 1B ▶). Then sequence conservation decreases substantially from residue 134, also corresponding to the region of increased exchange rate (Fig. 1A,B ▶). The peptide fragmentation map used to identify rapid-exchange sites also indicated a preferential proteolytic cleavage at residue 141 by the relatively non-sequence-specific protease pepsin. Combining the exchange, sequence alignment, and proteolysis information, we chose position 145 to define the C terminus of our TM0160 daughter construct. The N terminus was left intact, as there was a general absence of DXMS data for this region. This could indicate that this region is particularly sensitive to proteolysis; however, this region was visible in the final electron density map and appears to be well-ordered.
Figure 1.
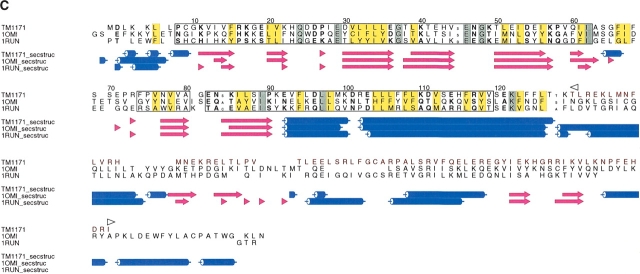
DXMS time exchange data and sequence alignments. (A) Amino acid sequences for truncated TM0160 and TM1171 constructs. Amino acids indicated to be flexible by DXMS are shaded in cyan, those indicated by SEG are shaded in yellow, and those predicted to be disordered by both programs are shaded green. Residues removed from the wild-type sequence are colored red; the beginning and the end of the excision is labeled with a left and a right arrow, respectively. (B) Sequence alignment of TM1060 and its closest homologs (those with an e score <1.e-10). Secondary structure elements are defined below, α-helices are represented as blue tubes and β-strands as magenta arrows. Residues that are identical in over half of the sequences are shaded yellow. The region not included in the construct has been colored red and labeled with a left and right arrow to define the excision. The alignment was produced by T_COFFEE (Notredame et al. 2000) and the figure produced with ALSCRIPT (Barton 1993). (C) Structure alignment of TM1171 and its two closest structural homologs from L. monocytogenes (1OMI) and E. coli (1RUN). The sequences are numbered with reference to TM1171. Conserved structural regions are contained within boxes, conserved hydrophobic residues are masked in yellow, while totally conserved residues are shaded grey. Residues beyond 126 that were not in the construct are colored red and are aligned only by sequence. Secondary structure elements are defined as in Figure 1B ▶. Figures were produced with STAMP (Russell and Barton 1992) and ALSCRIPT (Barton 1993).
The coding region from positions 1 to 145 was cloned and expressed. The resulting purified protein was re-evaluated by DXMS to determine if there were any substantial changes in the exchange pattern indicative of any gross structural changes as a result of the truncation. Parent TM0160, and its daughter truncation, were on-exchanged variously for 10, 100, 1000, and 10,000 sec at 0°C. The exchange pattern for both the parental full-length TM0160 and the daughter construct are virtually identical in the homologous regions (Pantazatos et al. 2004). Furthermore, both parental TM0160 and the daughter construct behaved as dimers when evaluated by size-exclusion chromatography (data not shown). These results indicate that the DXMS-defined deletion appears to be properly folded.
Unlike TM0160, TM1171 has homologs with known three-dimensional structures, and its domain definitions (Fig. 1C ▶), using the Pfam database (Bateman et al. 2002), enable the sequence to be split into two subdomains: a cyclic-nucleotide binding domain (residues 17–111) and a bacterial transcriptional regulatory CRP (cAMP receptor protein) domain (residues 165–196), binding DNA via a helix-turn-helix HTH motif. The DXMS data predict substantial disorder in the region linking the nucleotide binding domain to the CRP, helix-turn-helix DNA binding domain based on sequence alignments (Figure 1B ▶). This disorder may be suggestive of interdomain flexibility between the DNA and nucleotide binding domains. Such flexibility may disappear on binding to a regulatory sequence or may allow interaction with RNA polymerase.
TM0160 and TM1171 deletion constructs show marked improvement in crystallization efficiency
The TM0160 full-length parent has been extensively evaluated for crystallization. Despite multiple screening attempts of 480 crystallization conditions, only three marginal hits were obtained from 2400 individual crystallization tests. In contrast, for the TM0160 deletion mutant, 78 hits were obtained from 1920 individual tests including numerous crystals of sufficient size and quality for diffraction studies. An almost identical result was experienced with TM1171, where only five marginal crystal hits were observed from 2400 individual crystallization tests. The DXMS guided construct produced three different crystal forms from 19 crystallization conditions that resulted in mountable crystals (Pantazatos et al. 2004).
The structure of TM0160
The dimer of TM0160 forms a wedge, each monomer being of basic triangular shape of size 70 Å × 40 Å × 40 Å (Fig. 2B,C ▶). From a Dali search (Holm and Sander 1993), no significant matches were found for TM0160, suggesting that it possesses a new fold. The topology diagram of the protein (Westhead et al. 1999; Bond 2003) is shown in Figure 2A ▶. The monomer is composed of an eight-stranded, distorted β-sheet consisting of a four-stranded, antiparallel β-sheet (B1, B2, B3, B8), and a four-stranded mixed β-sheet (B4, B5, B6, B7). The sheets are intercalated by three short α-helices (H1, H3, H4), while a longer 11-residue α-helix (H2) forms the central core of the dimer interface. A short helix (H5) at the C terminus of monomer A is formed largely from the C-terminal epitope tag and marks the beginning of the highly flexible C terminus removed from the wild-type protein (Fig. 1A,B ▶). This helix is somewhat stabilized by crystal contacts absent from its equivalent location in molecule B.
Figure 2.
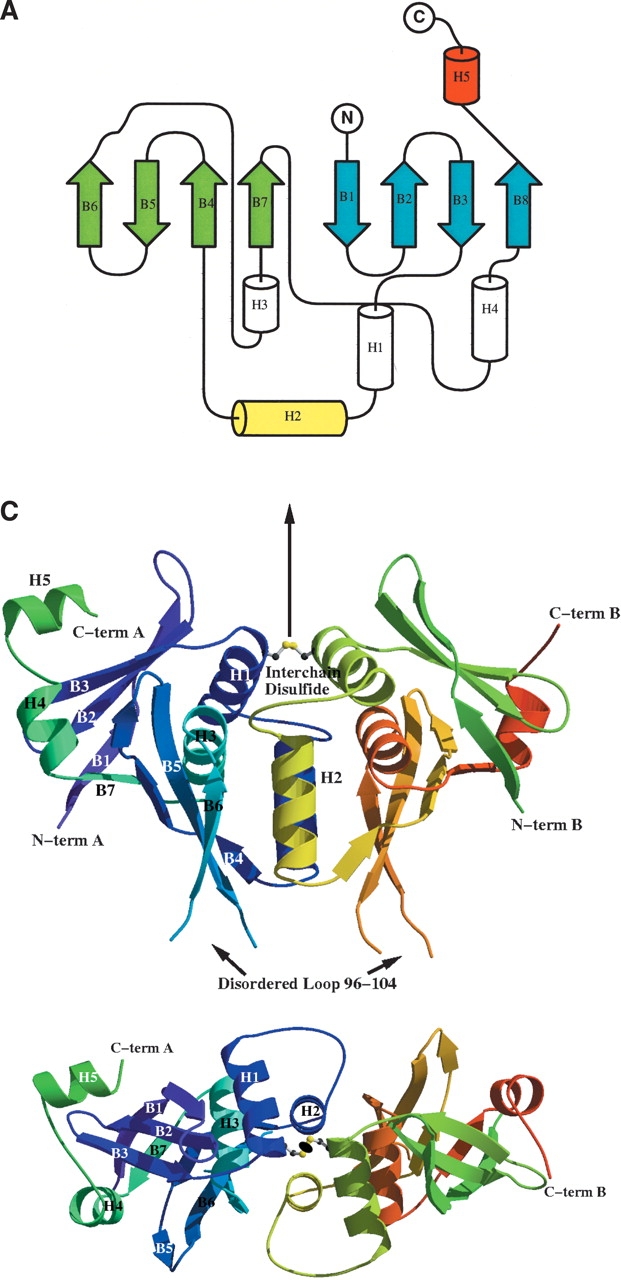
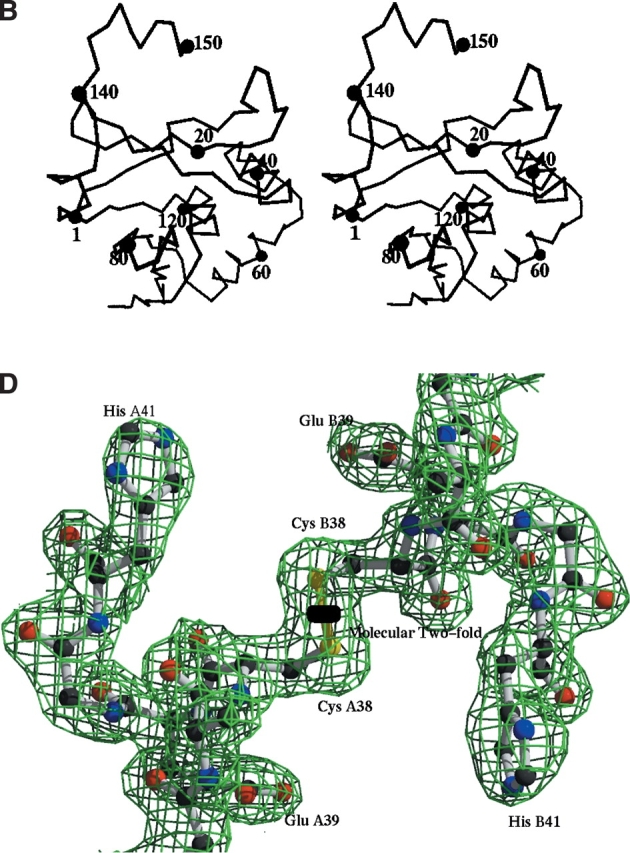
Structure of TM0160. (A) Topology diagram of the overall fold of TM0160. The long mixed β-sheet is shaded cyan. The dimerization helix (H2) is shaded yellow, while the highly mobile C-terminal epitope tag helix (H5) in molecule A is shaded red; all other helices are shaded green. The picture was generated by TOPS (Westhead et al. 1999) and Topdraw (Bond 2003). (B) Stereo diagram of the TM0160 monomer generated by VMD (Humphrey et al. 1996). Cα atom numbering is every 20 residues. (C) Two orthogonal ribbon diagram representation of the TM0160 dimer. The interchain disulfide is depicted in a ball-and-stick representation and sits on the molecular twofold displayed as an arrow in the top diagram and as an oval in the bottom. The ribbon is colored from blue to green in subunit A and green to red in subunit B. The figure was generated using Bobscript (Kraulis 1991; Esnouf 1997) and Raster3d (Meritt and Murphy 1994). (D) Representative 2Fo-Fc electron density. The electron density of the region around the molecular twofold axis details the interchain disulfide bond. The electron density map is contoured at 1.5 standard deviations above the mean.
Interchain disulfide and binding interface
Of interest is the interchain disulfide bridge between the two units in the dimer. In nature, the reducing environment of T. maritima would not seem to allow this arrangement. The monomers occlude a surface area of ~2400 Å2 (calculated using the Lee and Richards algorithm [Richards 1977] with a probe radius of 1.4 Å) on binding, which is one-quarter of the surface area of each individual monomer. The binding interface itself is primarily formed around the molecular twofold axis from three leucine residues and one valine residue. This, combined with the lack of conservation of this cysteine residue in related sequences (Fig. 1B ▶), suggests that this disulfide may have arisen by genetic drift. However, a recent study has suggested that disulfide bonds may be much more common than expected for some prokaryotic microbes (Mallick et al. 2002). To investigate this phenomenon, we constructed a Cys50-Ala mutant (see Materials and Methods). Crystals were obtained from essentially the same conditions and a data set was collected to 2.9 Å on an in-house rotating anode source. The crystals were isomorphous and the resultant dimer structure was essentially identical apart from the missing sulfur atoms at the position of the disulfide bridge. This would suggest that the covalent interaction is not necessary for the formation of the TM0160 dimer but does not exclude the possibility that it provides additional stability to the oligomer of the thermophilic protein.
Genomic information
TM0160 is located in a region of the chromosome containing several proteins of unknown function. However, one proximal gene, TM0161, is annotated as a geranyl transferase enzyme (Nelson et al. 1999). An examination of the sterol biosynthesis pathway for T. maritima indicates that many of the enzymatic activities surrounding geranyl transferase do not have gene assignments. We evaluated the neighboring genes for TM0160 homologs from 19 other genomes. Annotated activities from proximal genes that are potentially cotranscribed included oxido reductases (Nostoc, Thermosynechococcus), endonuclease III (Aquifex), DNA helicase II (Synechocystis), glycine dehydrogenase (Mycobacterium), glycine cleavage P (Mycobacterium), un-characterized ACR cofactors (Thermoanaerobacter), phosphoribosyl AMP cyclohydrolase and imidazole glycerol-phosphate synthase (Halobacterium), protein-L-isoaspartate (D-aspartate) O-methyltransferase (Methanosarcina), ribose-5-phosphate isomerase, and glutamate-1-semialde-hyde 2,1, aminomutase. The preponderance of enzymes involved in amino acid metabolism may indicate a putative role in this process for TM0160.
DXMS analysis shows the C-terminal region of full-length TM0160 to be disordered, which may account for its apparent interference in crystallization. One potential reason for this disorder is the lack of a protein binding partner. We attempted to identify such a potential interaction through a two-hybrid protein interaction screen (Fields et al. 1999). Full-length, truncated, and the deleted C terminus were evaluated; in each case, the fusion constructs demonstrated self-activation in the two-hybrid screen and could not be pursued for novel interactions.
Putative active site
In an attempt to locate similar active site geometries in the protein, a rigorous search was performed of all clusters of three and four putative active site residues in the TM0160 dimer. A cluster of active residues was defined as the subset of all nonhydrophobic residues grouped within 15 Å of each other. The co-ordinates of the putative “active sites” were then submitted to SPASM (Kleywegt 1999). Of the 1849 combinations of three-residues and 2090 combinations of four-residues searched, none produced any hits reminiscent of a known active site. Submission of the coordinates to the PINTS server (Stark et al. 2003) also produced no hits of any significance. This analysis suggests that, if TM0160 is an enzyme, then it will likely possess a novel enzymatic activity and mechanism.
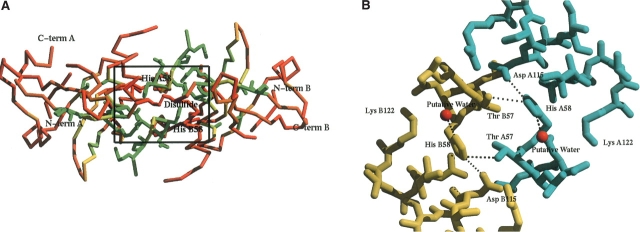
The TM0160 structure, when combined with a sequence alignment of homologous sequences, however, can give considerable insight into the possible location of its active site (Figs. 1B ▶, 3A,B ▶). A high degree of sequence conservation (Fig. 3A ▶) occurs around a large groove situated at the thick end of the wedge, which represents the largest cavity in the molecule. This area is centered around the molecular twofold axis, which may in part account for its sequence conservation. However, it also extends far into the pocket, suggesting evolutionary conservation independent of the formation of a dimeric structure. This pocket contains some unaccounted for electron density, too ambiguous to trace but clearly not a network of water molecules. Of particular note in the pocket is His58 centered around the twofold axis that is coupled to Asp 115 via a possible proton shuttling mechanism, allowing the histidine to co-ordinate a putative water molecule (Fig. 3B ▶). This sort of chemistry may indicate a region of possible active site chemistry. The only other potential proton donor would be Thr57 from the other subunit in the dimer, which is a highly conserved residue (Fig. 1B ▶). In cases where a substitution of this residue occurs, it is most often replaced with an equally viable serine residue (Fig. 1B ▶), which could then produce a putative catalytic triad.
Figure 3.
Putative active site region for TM0160. (A) Regions of residue conservation as determined by the sequence alignment in Figure 1B ▶. Residues are colored from red representing 0% conservation to green at 100%. Those residues that are 100% conserved are also displayed as a ball-and-stick representation. Conservation is calculated as the percent of conserved residues among the 17 sequences displayed in Figure 1B ▶. The figure was generated with Bobscript (Kraulis 1991; Esnouf 1997) and Raster3d (Meritt and Murphy 1994). (B) Close-up of putative active site region of TM0160 as defined in A. Molecule A is colored cyan, while molecule B is colored yellow. The putative water molecules coordinated to His 58 are colored red. Interactions <4.0 Å are represented as dashed black lines. The picture was generated by Bobscript (Kraulis 1991; Esnouf 1997) and Raster3d (Meritt and Murphy 1994).
This putative active site may also be indicated by the DXMS data, where Leu56 and Thr57 are indicated as regions of high exchange, indicating considerable solvent accessibility, which could also be indicative of an active site, as seen for another T. maritima protein (TM0449), where ligand binding stabilizes the active site (Mathews et al. 2003; Pantazatos et al. 2004).
The structure of TM1171 cNTP domain
TM1171 belongs to the CRP family and is believed to be a transcriptional regulator. As representatives of this family have been previously determined, the structure was not expected to have a novel fold but was distant enough from other sequence homologs (highest sequence identity 19%; PDB code 1O3S) to expect that structure determination would be more successful by MAD/SAD. In other members of the CRP family, the structure consists of two domains: a cyclic nucleotide binding domain (cNTP), situated at the N terminus, responsible for dimerization and binding cNTP’s and a C-terminal HTH (HTH_CRP) cAMP regulatory domain responsible for DNA binding. The connection between the two domains is defined by a long α-helix (20–30 residues), which could be assigned to either of the two domains but in itself is structurally disparate to each. The fold of the truncated version of TM1171 consists of two four-stranded antiparallel β-sheets (B1, B8, B3, B6, and B2, B7, B4, B5), forming a jelly-roll sandwich topology (Fig. 4A,B ▶), and is classified as a double-stranded β-helix by SCOP (Murzin et al. 1995). This sandwich is terminated by two C-terminal α-helices, the latter being a 25-residue helix that forms the dimerization interface for the molecule (H4). Two other helical turns are formed, the first being a five-residue helix at the N terminus (H1) and the second a three-residue α-helical turn bridging β-strands 6 and 7 (H2) (Fig. 4A,B ▶). In comparison to its two closest structural homologs, the E. coli catabolite gene activator (PDB code 1RUN; Parkinson et al. 1996) and Listeria monocytogenes Listeriolysin regulatory protein (PDB code 1OMI) TM1171 has a root mean square deviation of 1.74 Aring; and 1.92 Å on 111 and 97 aligned Cα atoms, respectively (calculation performed with STAMP [Russell and Barton 1992]).
Figure 4.
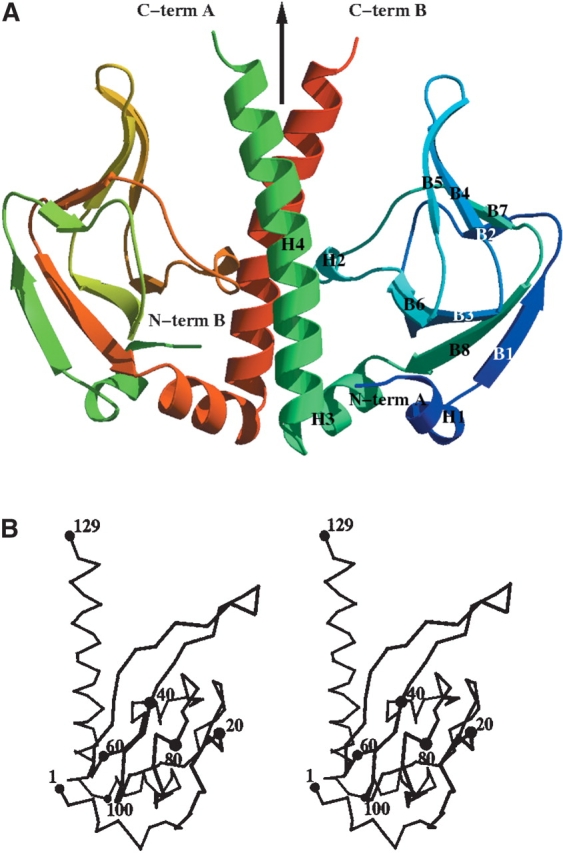
Overall structure of TM1171. (A) Ribbon representation of the dimer of TM1171 cNTP domain. Molecule A is colored from blue to green from the N terminus to the C terminus, while molecule B is represented from green to red over the same range. The dimer was produced by rotating one subunit around a crystallographic twofold axis, which is represented by an arrow. (B) Stereo trace of TM1171 dimer. Residues are labeled every 20 residues. The figures were generated with VMD (Humphrey et al. 1996).
TM1171 dimer
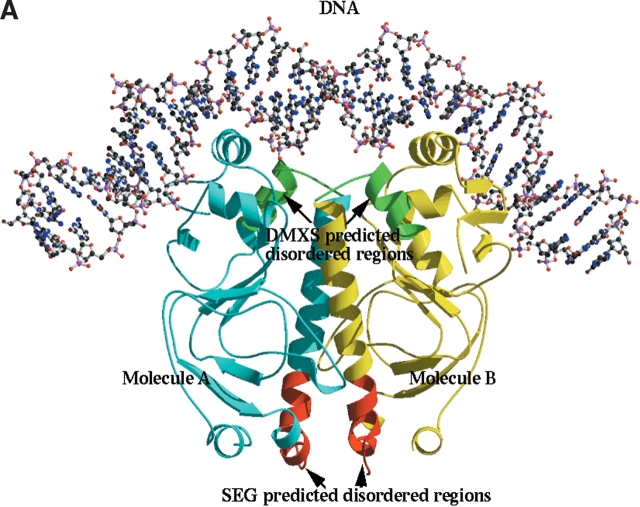
As a putative transcription regulator, TM1171 is expected to bind to a specific sequence of DNA as a dimer, through its two C-terminal domains that are absent in the truncated TM1171 and are characteristic of the CRP family (Fig. 5 ▶; Parkinson et al. 1996). The dimer interface is provided by the interaction of the twofold symmetric H4 helices (Fig. 4 ▶). On binding, the interface occludes a surface area of 3708 Å2 (calculated using the Lee and Richards algorithm and a probe radius of 1.4 Å [Richards 1977]), representing 28% of the available surface area, and is formed from a cluster of nine hydrophobic residues pairing up with their equivalent counterparts around the molecular/crystallographic twofold axis.
Figure 5.
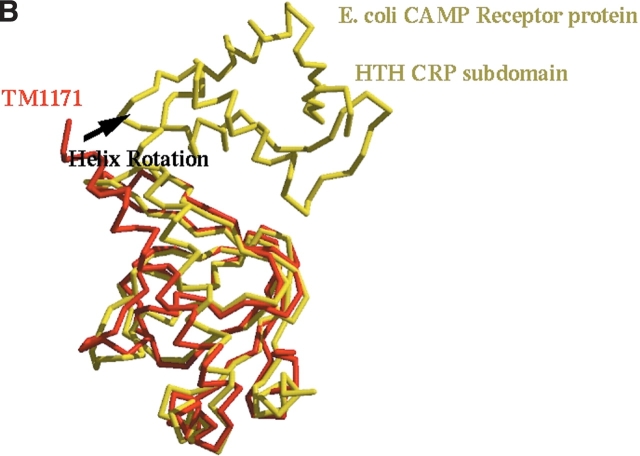
Comparison of TM1171 with E. coli transcription regulator. (A) Ribbon diagram of E. coli transcription regulator in complex with its DNA substrate (Parkinson et al. 1996). CRP domain bound to DNA molecule A of the dimer is colored cyan and the other is colored yellow. Regions defined by SEG to be disordered are shaded red, while those for DXMS are shaded green (Fig. 1 ▶). DNA is represented by ball-and-stick. The figure was generated with Bobscript (Kraulis 1991; Esnouf 1997) and Raster3d (Meritt and Murphy 1994). (B) Superposition of TM1171 cNTP domain with its counterpart in E. coli (PDB code 1RUN). TM1171 is colored red and 1RUN is colored yellow. The overall rmsd between the two domains is 1.74 Å over 111 aligned Cα residues; the dimerization helix is rotated relative to its counterpart in 1RUN by about 20°.
cNTP binding region
The cyclic nucleotide binding site, situated between the two β-sheets, helix 2 and helix 4, is structurally conserved relative to homologous structures (Fig. 1B ▶). The long helix (H4), is rotated by ~20° in TM1171 relative to the other C-NTP structures that contain both domains (Fig. 5B ▶). However, superposition of TM1171 with other cAMP binding proteins cocrystallized with bound cAMP shows that a movement of the loop containing residues 63–66 occludes the volume occupied by cAMP in the other crystal structures, suggesting that in TM1171 either cAMP binds in a different conformation or the binding of cAMP is accompanied by a conformational change. Some residual electron density is present in the TM1171 electron density maps, indicating the acquisition of a bound nucleotide during expression. The exact identity of this electron density could not be unambiguously assigned due to its poor quality, and therefore the nucleotide was not modeled.
Interpreting the TM1171 DXMS data in light of the structure
TM1171 is involved in DNA binding, the primary interactions for which reside in the C-terminal domain, while the N-terminal domain is responsible for binding cAMP or other cyclic nucleotides. The long coiled-coil helix between the two domains forms the dimer interface. It is interesting to note that the closest sequence homologs to TM1171 (Fig. 5 ▶) were crystallized in the presence of DNA, which presumably stabilizes the dimer by bridging the two monomers. The exception is the structure from L. monocytogenes (PDB code 1OMI), where the entire protein was crystallized and the structure determined without a DNA substrate, although the average B-values were relatively high (~78.0 Å2).
Combining these homolog structural data with the DXMS data suggests that the C-terminal CRP HTH domain is intrinsically flexible relative to the N-terminal domain until stabilized by the binding of a specific DNA sequence. It seems reasonable that the presence of DNA decreases the number of conformational degrees of freedom between the two domains, thus increasing the chance of forming a crystal lattice (Fig. 5 ▶).
Comparison with SEG analysis
It is important to compare the DXMS experimental results with those obtained by primary sequence computational analysis. We used the SEG program to look at low-complexity regions of the primary sequence (Wootton and Federhen 1993). From analysis of the sequences presented in Figure 1, B and C ▶, the low-complexity regions have been shaded red in sequence 2, while the DXMS comparisons are shaded green in sequence 1. For TM1171, the regions of low complexity given by SEG represent the loop regions between the turn regions of the penultimate helix and the long C-terminal helix residues 94–109, which forms the dimer interface. This region connects the dimerization helix (H5) to domain 1 and is ordered in the crystal, as indicated by the electron density. This would suggest that, if SEG was used in the absence of structural homology information in preparing the constructs, the designed domain would be smaller and possibly more compact but would remove the dimerization helix. The DXMS analysis indicated that the region to initiate the cut would be the loop connecting the dimerization helix and domain 2 of the molecule (Fig. 5 ▶), a region likely to be flexible in the absence of its DNA substrate.
On the other hand, the computational prediction from TM0160 is relatively accurate (Fig. 1B ▶), where SEG predicts that there is a disordered region in the C terminus but places the start at residue 169, rather than the residue (162) that DXMS predicts (Fig. 1B ▶). SEG also suggests the position of the disordered loop 106–112, which exhibits no discernible electron density and indicates that the start of this region is only one residue from that suggested by DXMS (Fig. 1B ▶).
Discussion
DXMS provides an experimental means to analyze local protein flexibility and a specific means to design more “crystallizable constructs.” Here, two proteins that, in their full-length states, were resistant to crystallization attempts are used to demonstrate the DXMS utility. The first, TM0160, is a novel fold and was truncated at its C terminus to yield viable crystals. The second, TM1171, is a transcriptional regulator protein that probably requires its DNA substrate to form a stable structure. The designed construct for TM1171 excised a subdomain from the C terminus that would probably inhibit crystallization. These results demonstrate that DXMS can provide a simple and rapid means to give meaningful data as to where to terminate/separate domains to provide more stable and ordered constructs in cases where little is known of the protein structure or function.
The structure of TM0160 reveals another unique fold that displays a bacterial interchain disulfide bond that is now being found in other examples of bacterial proteins (Mallick et al. 2002). The structure has not revealed the exact function of the gene primarily because so little is known about the host organism and this protein or its homologs. The position of a putative active site can nevertheless by proposed from conserved residues in homologous family members, some unaccountable electron density in the large putative binding cavity that contains residues that could exhibit some interesting chemistry, such as protease activity. The DXMS technique may also lend itself to predicting areas of ligand binding. Although the exact position and function of the protein’s active site will only be unambiguously determined by experimental verification, which is now ongoing, this approach has narrowed down the search.
Materials and methods
Cloning and mutations
Full-length DNA fragments encoding amino acids 1–181 of TM0160 and amino acids 1–201 of TM1171 were cloned in-frame into the expression vectors pMH2T7 and pMH1, respectively, between restriction sites Pml I and Psi I. Truncated DNA fragments encoding amino acids 1–141, 1–145, 8–141, and 8–145 of TM0160 and incorporating a small seven-residue C-terminal epitope tag and amino acids 1–125, 1–129, 11–125, and 11–129 of TM1171 were cloned in-frame into the expression vector pMH4 between the restriction sites Pml I and Pac I. All DNA fragments were created by PCR amplification from genomic T. maritima DNA (ATCC) using pfuTurbo polymerase (Stratagene). The full-length TM0160 amplicon used 5′ primer (5′-ttgaggaaggcatgggt gaa-3′) and 3′ primer (5′-actttctccttcttcatcttcttc-3′). The full-length TM1171 amplicon used 5′ primer (5′-gtggatctgaaaaaactgcttcc-3′) and 3′ primer (5′- gattctatcatgttcgaaaggattt-3′). The four primers used for the TM0160 truncations were (1) 5′-atgaggaaggcatgggt gaa-3′, (8) 5′-actctggcgctcgatagag-3′, (141) 5′-ctcttaattaagtcgcg caactcgatagagtgtttctcc-3′, and (145) 5′-ctcttaattaagtcgcgttcgttt acttccaactcgataga-3′. The four primers used for the TM1171 truncations were (1) 5′-atggatctgaaaaaactgcttcca-3′, (11) 5′-aaagtgatcg tgttcagaaaaggt-3′, (125) 5′-ctcttaattaagtcgcggaaaaagagcttctcagaa actac-3′, and (129) 5′-ctcttaattaagtcgcgctttgtggtgaggaaaaagagc-3′. All cloning junctions were confirmed by sequencing.
Protein expression and purification
Full-length and truncated TM0160 and TM1171clones were expressed in E. coli DL41 from plasmids based on the expression vectors pMH2T7 and pMH4, respectively. These vectors encode a 12-amino-acid tag consisting of the first six amino acids of thioredoxin and six histidine residues placed at the N terminus to enhance expression and to allow for rapid affinity purification. Protein expression was performed in a defined medium containing 150 mg/L selenomethionine (for crystallization trials). Expression was induced by the addition of 0.15% arabinose for 3 h, and lysozyme was added at the end of fermentation to a final concentration of 250 μg/mL. Bacteria were lysed by sonication after a freeze–thaw procedure in lysis buffer (50 mM Tris at pH 7.9, 50 mM NaCl, 10 mM imidazole, 0.25 mM Tris(2-carboxyethyl)phosphine hydrochloride [TCEP]), and cell debris was pelleted by centrifugation at 3600g for 60 min. The soluble fraction was applied to a nickel chelate resin (Amersham Biosciences) previously equilibrated with lysis buffer. The resin was washed with wash buffer (50 mM potassium phosphate at pH 7.8, 0.25 mM TCEP, 10% v/v glycerol, 0.3 M NaCl, 40 mM imidazole) and protein was eluted with elution buffer (20 mM Tris at pH 7.9, 10% (v/v) glycerol, 0.25 mM TCEP, 300 mM imidazole). Buffer exchange was performed to remove imidazole from the eluate, and the protein in Buffer Q (20 mM Tris at pH 7.9, 5% (v/v) glycerol, 0.25 mM TCEP) containing 50 mM NaCl was applied to a Resource Q column (Amersham Biosciences) previously equilibrated with the same buffer. Protein was eluted using a linear gradient of 50–500 mM NaCl in Buffer Q, and appropriate fractions were pooled. Protein was buffer exchanged into crystal buffer (20 mM Tris at pH 7.9, 150 mM NaCl, 0.25 mM TCEP) and concentrated for crystallization assays to 20 mg/mL by centrifugal ultrafiltration (Millipore).
Protein fragmentation probe maps
Aliquots of each protein were adjusted to a concentration of 10 mg/mL in Tris-buffered saline (5 mM Tris, 150 mM NaCl at pH 7.0, TBS), and all subsequent steps were performed at 0°C, on melting ice. In a 4°C cold room, 5 μL of each solution was further diluted with 15 μL of TBS in a microtiter plate using multichannel pipetters for simultaneous manipulation. Thirty microliters of a stock “exchange quench” solution (0.8% formic acid, 1.6 M GuHCl) was then added to each sample (final concentration 0.5% formic acid, 1.0 M GuHCl), and the samples were transferred to auto-sampler vials and frozen on dry ice within 1 min after addition of quench solution, as previously described (Woods Jr. and Hamuro 2001; Hamuro et al. 2002a,b; Mathews et al. 2003). Vials with frozen samples were stored at −80° C until transferred to the dry ice-containing sample basin of the cryogenic auto-sampler module of the DXMS apparatus. Samples were individually melted at 0°C, and then injected (45 μL) and pumped through protease columns (0.05% TFA, 250 μL/min, 16 sec exposure to protease). Proteolysis used immobilized pepsin (66-μL column bed volume, coupled to 20AL support from PerSeptive Biosystems at 30 mg/mL). Protease-generated fragments were collected on a C18 HPLC column, eluted by a linear acetonitrile gradient (5%–45% B in 30 min; 50 μL/min; solvent A, 0.05% TFA; solvent B, 80% acetonitrile, 20% water, 0.01% TFA) and the effluent directed to the mass spectrometer with data acquisition in either MS1 profile mode or data-dependent MS2 mode. Mass spectrometric analyses used a Thermo Finnigan LCQ electrospray ion trap type mass spectrometer operated with capillary temperature at 200°C or an electrospray micromass Q-Tof mass spectrometer, as previously described (Woods Jr. and Hamuro 2001; Hamuro et al. 2002a,b; Mathews et al. 2003). The Sequest software program (Thermo Finnigan Inc.) identified the likely sequence of the parent peptide ions. Tentative identifications were tested with specialized DXMS data reduction software developed in collaboration with Sierra Analytics, LLC. This software searches MS1 data for scans containing each of the peptides, selects scans with optimal signal-to-noise, averages the selected scans, calculates centroids of isotopic envelopes, screens for peptide misidentification by comparing calculated and known centroids, and then facilitates visual review of each averaged isotopic envelope allowing an assessment of “quality” (yield, signal/noise, resolution) and confirms or corrects the peptide identity and calculated centroid (Woods Jr. and Hamuro 2001; Hamuro et al. 2002a,b; Mathews et al. 2003).
On-exchange deuteration of proteins
After establishment of fragmentation maps for each protein, amide hydrogen exchange-deuterated samples of each of the 24 proteins were prepared and processed exactly as described earlier, except that 5 μL of each protein stock solution was diluted with 15 μL of deuterium oxide (D2O), containing 5 mM Tris, 150 mM NaCl, pD (read) 7.0, and incubated for 10 sec at 0°C before quench and further processing. Data on the deuterated sample set were acquired in a single automated 30-h run and subsequent data reduction performed on the DXMS software, as previously described (Woods Jr. and Hamuro 2001; Hamuro et al. 2002a,b; Mathews et al. 2003). Corrections for loss of deuterium-label by individual fragments during DXMS analysis (after “quench”) were made through measurement of loss of deuterium from reference protein samples that had been equilibrium-exchange-deuterated under denaturing conditions, as previously described (Woods Jr. and Hamuro 2001; Hamuro et al. 2002a,b; Mathews et al. 2003). The total time elapsed for data acquisition and analysis (both fragmentation maps and deuteration study) was 2 wk, and a total of 100 μg of each protein was used to complete the study. The personnel performing the data acquisition and reduction part of the study were unaware of the identity or crystallization histories of the proteins while data were being acquired and processed. For subsequent comparative analysis of the exchange rates of amide hydrogens within protein constructs versus their full-length parental forms, both proteins were contemporaneously on-exchanged as described earlier but quenched at varying times (10 sec, 30 sec, 100 sec, 300 sec, 1000 sec, 3000 sec, 10,000 sec, and 30,000 sec) and further processed as described earlier, using the fragmentation maps established for the protein.
Equipment configuration
The equipment configuration consisted of electrically actuated, high-pressure switching valves (Rheodyne) connected to two position actuators from Tar Designs Inc., as described previously (Woods Jr. and Hamuro 2001; Hamuro et al. 2002a,b; Mathews et al. 2003). A highly modified Spectraphysics AS3000 autosampler, partially under external PC control, used a robotic arm to lift the desired frozen sample from the sample well, then automatically and rapidly melted and injected it under precise temperature control (Woods Jr. and Hamuro 2001; Hamuro et al. 2002a,b; Mathews et al. 2003). The autosampler basin was further thermally insulated and all but 20 vial positions were filled with powdered dry ice sufficient to keep samples colder than −45°C for 18 h. Four HPLC pumps (Shimadzu LC-10AD) were operated by a Shimadzu SCL-10A pump controller. One produced forward flow over the protease columns, another back-flushed the protease pepsin column after sample digestion (0.05% aqueous TFA), and two delivered solvents to a downstream HPLC column for gradient elution (A: 0.05% aqueous TFA; B: 80% acetonitrile, 20% water, 0.01% TFA; 1 × 50 mm C18 Vydac # 218MS5105 [pH 2.3]). Valves, tubing, columns, and autosampler were contained within a refrigerator at 2.8°C, with protease and HPLC columns immersed in melting ice. The timing and sequence of operation of the DXMS apparatus fluidics were controlled by a personal computer running an in-house written LabView-based program, interfaced to solid-state relays (digital input/output boards, National Instruments), controlling pumps, valve actuators, and MS data acquisition (Woods Jr. and Hamuro 2001; Hamuro et al. 2002a,b; Mathews et al. 2003).
Crystallization
Crystals of both proteins were screened for in a 96-well, sitting drop vapor diffusion format, using 480 commercially available crystallization conditions (Hampton Research, Emerald Biostructures) at 20°C and 4°C. Two hundred nanoliters of protein was added to an equal volume of crystallization reagent. Subsequently, 25 of the 960 conditions produced mountable crystals for TM0160, which grew from both high and low molecular weight PEGs at pH’s centered around 7.0. Those crystals used to determine the structure and collect higher resolution data were obtained with Hampton crystal screen #41: 10% isopropanol, 20% PEG 4000; 0.1 M HEPES (pH 7.5) at 4°C and 20°C, while mutant Cys50Ala crystals were grown from the Hampton PEG/ion screen #06: 0.2 M sodium chloride, 20% w/v/ PEG 3350 (pH 6.9) at 4°C; all crystals screened were isomorphous and indexed in a primitive monoclinic crystal system. The crystals were cryocooled in liquid nitrogen after adding 20% glycerol to the mother liquor as a cryoprotectant.
Three crystal forms of TM1171 were obtained. The crystal form used to determine and refine the structure belonged to spacegroup P6122 and was crystallized from 2.0 M ammonium sulfate in a sodium citrate buffer (pH 5.5) at a temperature of 4°C. Crystals were also cooled to liquid nitrogen temperature with a cryoprotectant of 15% PEG 200. Two other crystal forms were screened for diffraction, in spacegroups I4/I41 and P21, but they diffracted poorly (to ~4.0 Å) and were not used in any further experiments. Full-length TM0160 and TM1171 proteins that had been freshly expressed and purified were subjected to crystallization trials contemporaneously with the truncation constructs and again demonstrated very poor crystallizability (data not shown).
Data collection and structure solution
Data for a TM0160 SAD experiment were collected at beamline 5.0.2 of the Advanced Light Source (ALS Berkeley) to a resolution of 2.4 Å, at a wavelength of 0.97635 Å, corresponding to the selenium edge as determined by an X-ray fluorescent scan (Table 1). In all, 240° of data were collected using an inverse beam strategy so that Friedel mates were collected in 15° wedges close in time. Further, higher resolution data were collected at beamline 5.0.3 of the ALS at a wavelength of 1.0 Å to a maximum Bragg spacing of 1.9 Å (Table 1).
Table 1.
Summary of data collection and refinement statistics for TM0160 and TM1171
| Protein | TM0160 (phasing) | TM0160 (refining) | TM0160 (C38A) | TM1171 (SeMet) |
| Space group | P21 | P21 | P21 | P6122 |
| Unit cell parameters (Å) | a =43.82Å | a = 43.51Å | a = 44.00Å | a = b = 62.62Å |
| b = 51.87Å | b = 51.07Å | b = 52.14Å | c = 166.78Å | |
| c = 73.62Å | c = 73.97Å | c = 73.62Å | ||
| β = 97.31° | β = 97.39° | β = 97.64° | ||
| Wavelength (Å) | 0.97635 | 1.0 | 1.54 | 0.97972 |
| Resolution range (Å) | 50.0−2.3 | 50.0−1.9 | 50.0−2.8 | 50.0−2.3 |
| Rsymm (in highest resolution shell) | 0.046 (0.32) | 0.067 (0.34) | 0.079 (0.65) | 0.082 (0.32) |
| No. unique refs. (observed) | 19,573 (351,594) | 24,410 (398,636) | 8171 (24,075) | 9367 (73,376) |
| Completeness (%) (highest shell) | 98.1 (95.7) | 95.0 (92.4) | 98.2 (98.9) | 99.4 (99.2) |
| Highest resolution shell (Å) | 2.43−2.31 | 1.97−1.9 | 2.9−2.8 | 2.43−2.31 |
| Mean I/σ I) | 25.2 (2.9) | 19.6 (1.5) | 12.0 (3.1) | 22.3 (4.2) |
| No. of Se sites | 4 | — | — | 2 |
| Model and refinement statistics | ||||
| No. of reflections (total) | — | 23,110 | 7762 | 8737 |
| No. of reflections (test) | — | 1214 | 378 | 443 |
| Rcryst (Rfreea)b | — | 0.198 (0.253) | 0.238 (0.295) | 0.197 (0.253) |
| No. protein atoms | — | 2175 | 2173 | 2135 |
| No. water atoms | — | 242 | 0 | 252 |
| Stereochemical parameters | ||||
| rmsd bonds (Å) | — | 0.019 | 0.017 | 0.017 |
| rmsd angles (°) | — | 1.67 | 1.57 | 1.503 |
| Average isotropic B-value (Å2) | — | 41.4 | 24.8 | 47.4 |
| ESU based on Rfree(Å)c | 0.157 | 0.448 | 0.215 | |
a Rfree = as for Rcryst, but for 5.0% of the total reflections chosen at random and omitted from refinement.
b Rfactor = ∑| Ii−<Ii>| |/∑| Ii| where Ii is the scaled intensity of the ith measurement, and <Ii> is the mean intensity for that reflection.
c Estimated overall coordinate error (Otwinowski and Minor 1997; Tickle et al. 1998).
All data were reduced and scaled using the HKL2000 package (Otwinowski and Minor 1997). The substructure of four seleniums (two per molecule in the asymmetric unit) were found with Solve (Terwilliger and Berendzen 1999), which was also used to derive initial phases and along with Resolve to refine the phases via solvent flattening, averaging, and automated model building (Table 1; Terwilliger 1999 Terwilliger 2001a,b), followed by manual rebuilding and refinement with ‘O’ (Jones et al. 1991) and Refmac (Murshudov et al. 1997). After incorporation of the higher resolution data, automated water building with ARP/wARP (Lamzin and Wilson 1993) was carried out. All other crystallographic manipulations were carried out with the CCP4 program suite (Collaborative Computational Project Number 4, 1994). The final model has an Rcryst and Rfree of 19.8% and 25.3%, respectively, with no residues in disallowed regions of the Ramachandran plot (Table 1). The C terminus was traced to residue 150 in molecule A and 141 in molecule B. A number of regions were disordered and did not have significant electron density; 11 residues at the N terminus could not be interpreted, constituting all but one of the N-terminal tag residues, as well as loop regions between 107 and 115 in molecule A and 108 to 113 in molecule B. All of these regions corresponded to regions of high mobility in DXMS.
The Cys50Ala mutant data were collected on an in-house RUH3R (Rigaku, MSC) source incorporating Osmic mirrors and a RaxisIV4++ image plate detector to a resolution of 2.8 Å. As the crystal was isomorphous to the wild type, after modifying the mutated cysteine residues, the model was positioned into the crystal by rigid body refinement with Refmac5 (Murshudov et al. 1997) and followed by two rounds of refinement and manual model building with ‘O’ (Table 1; Jones et al. 1991).
Data for TM1171 were also collected at beamline 5.02 of the ALS to a resolution of 2.4 Å at a wavelength of 0.97972 Å corresponding to the selenium edge, as determined by an X-ray fluorescent scan. One hundred twenty degrees of data were collected using an inverse beam strategy collecting wedges of 10° close in time. Data were processed and the structure determined by similar procedures to that of TM0160 (Table 1). The resultant structure had excellent stereochemical properties with all residues in favored regions of the Ramachandran plot; the final Rcryst and Rfree for the model converged at 19.7% and 25.3%, respectively (Table 1). With the exception of the 12 residues of the N-terminal tag, all residues of the construct could be traced in the electron density map (Table 1).
Coordinates for TM0160 wild type have been deposited in the PDB database as 1VJL, and the TM0160 Cys mutant as PDB entry 1SJ5 and the TM1171 entry as 1O5L.
Competing interests
See Acknowledgments section.
Acknowledgments
We thank Walter Englander, David Wemmer, and Philip Bourne for their support and guidance in this DXMS application; Dan McMullan, Kevin Rodrigues, Juli Vincent, and Eileen Ambing for protein purification and crystallization studies; and Peter Schultz for continued support. The work in this paper is based on experiments conducted at beamline 5.0.3 and 5.0.2 of the advanced light source (ALS). The ALS is supported by the Director, Office of Science, Office of Basic Energy Sciences, Material Sciences Division of the U.S. Department of Energy under contract no. DE-AC03–76SF00098 at Lawrence Berkeley National Laboratory. We would like to thank all of the staff of these beamlines for their continued support.
This work was supported by NIH grant CA099835 (V.L.W.) and NIH Protein Structure Initiative grant P50 GM62411 from the National Institute of General Medical Sciences (www.nigms.nih.gov), GM 062411 (I.A.W.), and by grants from the University of California BioStar and LSI programs, grants S97–90, S99–44, and L98–30 (V.L.W.), with the matching corporate sponsor for these grants being ExSAR Corporation, Monmouth Junction, NJ. V.L.W. has an equity interest in ExSAR Corporation.
Abbreviations
DXMS, deuterium exchange mass spectroscopy
Article and publication are at http://www.proteinscience.org/cgi/doi/10.1110/ps.04939904.
References
- Barton, G.J. 1993. ALSCRIPT: A tool to format multiple sequence alignments. Protein Eng. 6 37–40. [DOI] [PubMed] [Google Scholar]
- ———. 1995. Protein secondary structure prediction. Curr. Opin. Struct. Biol. 5 372–376. [DOI] [PubMed] [Google Scholar]
- Bateman, A., Birney, E., Cerruti, L., Durbin, R., Etwiller, L., Eddy, S.R., Griffiths-Jones, S., Howe, K.L., Marshall, M., and Sonnhammer, E.L. 2002. The Pfam protein families database. Nucleic Acids Res. 30 276–280. [DOI] [PMC free article] [PubMed] [Google Scholar]
- Bond, C.S. 2003. TopDraw: A sketchpad for protein structure topology cartoons. Bioinformatics 19 311–312. [DOI] [PubMed] [Google Scholar]
- Cohen, S.L., Ferre-D’Amare, A.R., Burley, S.K., and Chait, B.T. 1995. Probing the solution structure of the DNA-binding protein Max by a combination of proteolysis and mass spectrometry. Protein Sci. 4 1088–1099. [DOI] [PMC free article] [PubMed] [Google Scholar]
- Collaborative Computational Project Number 4. 1994. The CCP4 suite: Programs for protein crystallography, version 3.1. Acta Crystallogr. D Biol. Crystallogr. 50 760–763. [DOI] [PubMed] [Google Scholar]
- Englander, J.J., DelMar, C., Li, W., Englander, S.W., Kim, J.S., Stranz, D.D., Hamuro, Y., and Woods Jr., V.L. 2003. Protein structure change studied by hydrogen-deuterium exchange, functional labeling, and mass spectrometry. Proc. Natl. Acad. Sci. 100 7057–7062. [DOI] [PMC free article] [PubMed] [Google Scholar]
- Esnouf, R.M. 1997. An extensively modified version of Molscript which includes greatly enhanced colouring capabilities. J. Mol. Graph. 15 132–134. [DOI] [PubMed] [Google Scholar]
- Fields, S., Kohara, Y., and Lockhart, D.J. 1999. Functional genomics. Proc. Natl. Acad. Sci. 96 8825–8826. [DOI] [PMC free article] [PubMed] [Google Scholar]
- Hamuro, Y., Burns, L.L., Canaves, J.M., Hoffman, R.C., Taylor, S.S., and Woods Jr., V.L. 2002a. Domain organization of D-AKAP2 revealed by deuterium exchange-mass spectrometry (DXMS). J. Mol. Biol. 4 703–714. [DOI] [PubMed] [Google Scholar]
- Hamuro, Y., Wong, L., Shaffer, J., Kim, J.S., Jennings, P.A., Adams, J.A., and Woods Jr., V.L. 2002b. Phosphorylation-driven motion in the COOH-terminal Src Kinase, Csk, revealed through enhanced hydrogen-deuterium exchange and mass spectrometry (DXMS). J. Mol. Biol. 323 871–881. [DOI] [PubMed] [Google Scholar]
- Hamuro, Y., Zawadzki, K.M., Kim, J.S., Stranz, D., Taylor, S.S., and Woods Jr., V.L. 2003. Dynamics of cAPK type IIb activation revealed by enhanced amide H/2H exchange mass spectrometry (DXMS). J. Mol. Biol. 327 1065–1076. [DOI] [PubMed] [Google Scholar]
- Holm, L. and Sander, C. 1993. Protein structure comparison by alignment of distance matrices. J. Mol. Biol. 233 123–138. [DOI] [PubMed] [Google Scholar]
- Humphrey, W., Dalke, A., and Schulten, K. 1996. VMD—Visual molecular dynamics. J. Mol. Graph. 14 33–38. [DOI] [PubMed] [Google Scholar]
- Jones, T.A., Zou, J.Y., Cowan, S.W., and Kjeldgaard, M. 1991. Improved methods for building protein models in electron density maps and the location of errors in these models. Acta Crystallogr. A 47 110–119. [DOI] [PubMed] [Google Scholar]
- Kleywegt, G.J. 1999. Recognition of spatial motifs in protein structures. J. Mol. Biol. 285 1887–1897. [DOI] [PubMed] [Google Scholar]
- Kraulis, P.J. 1991. MOLSCRIPT: A program to produce both detailed and schematic plots of protein structures. J. Appl. Crystallogr. 24 946–950. [Google Scholar]
- Lamzin, V.S. 1993. Automated refinement of protein models. Acta Crystallogr. D Biol. Crystallogr. 49 129–147. [DOI] [PubMed] [Google Scholar]
- Lesley, S.A., Kuhn, P., Godzik, A., Deacon, A.M., Mathews, I., Kreusch, A., Spraggon, G., Klock, H.E., McMullan, D., Shin, T., et al. 2002. Structural genomics of the Thermatoga maritima proteome implemented in a high-throughput structure determination pipeline. Proc. Natl. Acad. Sci. 99 11664–11669. [DOI] [PMC free article] [PubMed] [Google Scholar]
- Mallick, P., Boutz, D.R., Eisenberg, D., and Yeates, T.O. 2002. Genomic evidence that the intracellular proteins of archaeal microbes contain disulfide bonds. Proc. Natl. Acad. Sci. 99 9679–9684. [DOI] [PMC free article] [PubMed] [Google Scholar]
- Mathews, I.I., Deacon, A.M., Canaves, J.M., McMullan, D., Lesley, S.A., Agarwalla, S., and Kuhn, P. 2003. Functional analysis of substrate and cofactor complex structures of a thymidylate synthetase complementing protein. Structure 11 677–690. [DOI] [PubMed] [Google Scholar]
- Meritt, E.A. 1994. Raster3D version 2.0: A program for photorealistic molecular graphics. Acta. Crystallogr. D Biol. Crystallogr. 50 869–873. [DOI] [PubMed] [Google Scholar]
- Murshudov, G.N. 1997. Refinement of macromolecular structures by the maximum-likelihood method. Acta Crystallogr. D Biol. Crystallogr. 53 240–255. [DOI] [PubMed] [Google Scholar]
- Murzin, A.G., Brenner, S.E., Hubbard, T., and Chothia, C. 1995. SCOP: A structural classification of proteins database for the investigation of sequences and structures. J. Mol. Biol. 247 536–540. [DOI] [PubMed] [Google Scholar]
- Nelson, K.E., Clayton, R.A., Gill, S.R., Gwinn, M.L., Dodson, R.J., Haft, D.H., Hickey, E.K., Peterson, J.D., Nelson, W.C., Ketchum, K.A., et al. 1999. Evidence for lateral gene transfer between Archaea and bacteria from genome sequence of Thermotoga maritima. Nature 399 323–329. [DOI] [PubMed] [Google Scholar]
- Notredame, C., Higgins, D., and Heringa, J. 2000. T-Coffee: A novel method for multiple sequence alignments. J. Mol. Biol. 302 205–217. [DOI] [PubMed] [Google Scholar]
- Otwinowski, Z. and Minor, W. 1997. Processing of X-ray diffraction data collected in oscillation mode. Methods Enzymol. 276 307–326. [DOI] [PubMed] [Google Scholar]
- Pantazatos, D., Kim, J.S., Klock, H.E., Stevens, R.C., Wilson, I.A., Lesley, S.A., and Woods Jr., V.L. 2004. Rapid refinement of crystallographic protein construct definition employing enhanced hydrogren/deuterium exchange mass spectrometry. Proc. Natl. Acad. Sci. 101 751–756. [DOI] [PMC free article] [PubMed] [Google Scholar]
- Parkinson, G., Gunasekera, A., Vojtechovsky, J., Zhang, X., Kunkel, T.A., Berman, H., and Ebright, R.H. 1996. Aromatic hydrogen bond in sequence-specific protein DNA recognition. Nat. Struct. Biol. 3 837–841. [DOI] [PubMed] [Google Scholar]
- Richards, F.M. 1977. Areas, volumes, packing and protein structure. Annu. Rev. Biophys. Bioeng. 6 151–176. [DOI] [PubMed] [Google Scholar]
- Russell, R.B. and Barton, G.J. 1992. Multiple protein sequence alignment from tertiary structure comparison. Proteins 14 309–323. [DOI] [PubMed] [Google Scholar]
- Santarsiero, B.D., Yegian, D.T., Lee, C.C., Spraggon, G., Gu, J., Scheibe, D., Uber, D.C., Cornell, E.W., Nordmeyer, R.A., Kolbe, W.F., et al. 2002. An approach to rapid protein crystallization using nanodroplets. J. Appl. Cryst. 35 278–281. [Google Scholar]
- Stark, A., Sunyaev, S., and Russell, R.B. 2003. A model for statistical significance of local similarities in structure. J. Mol. Biol. 326 1307–1316. [DOI] [PubMed] [Google Scholar]
- Terwilliger, T.C. 1999. Reciprocal-space solvent flattening. Acta Crystallogr. D Biol. Crystallogr. 55 1863–1871. [DOI] [PMC free article] [PubMed] [Google Scholar]
- ———. 2001a. Map-likelihood phasing. Acta Crystallogr. D Biol. Crystallogr. 57 1763–1775. [DOI] [PMC free article] [PubMed] [Google Scholar]
- ———. 2001b. Maximum-likelihood density modification using pattern recognition of structural motifs. Acta Crystallogr. D Biol. Crystallogr. 57 1755–1762. [DOI] [PMC free article] [PubMed] [Google Scholar]
- Terwilliger, T.C. and Berendzen, J. 1999. Automated MAD and MIR structure solution. Acta Crystallogr. D Biol. Crystallogr. 55 849–861. [DOI] [PMC free article] [PubMed] [Google Scholar]
- Tickle, I.J., Laskowski, R.A., and Moss, D.S. 1998. Error estimates of protein structure coordinates and deviations from standard geometry by full-matrix refinement of γB- and βB2-crystallin. Acta Crystallogr. D Biol. Crystal-logr. 54 243–252. [DOI] [PubMed] [Google Scholar]
- Wand, A.J. 2001. Dynamic activation of protein function: A view emerging from NMR spectroscopy. Nat. Struct. Biol. 8 926–931. [DOI] [PubMed] [Google Scholar]
- Westhead, D.R., Slidel, T.W.F., Flores, T.P.J., and Thornton, J.M. 1999. Protein structural topology: Automated analysis, diagrammatic representation and database searching. Protein Sci. 8 897–904. [DOI] [PMC free article] [PubMed] [Google Scholar]
- Woods Jr., V.L. 2001. Method for characterization of the fine structure of protein binding sites using amide hydrogen exchange. US patent no. 6,331,400.
- Woods Jr., V.L. and Hamuro, Y. 2001. High resolution, high-throughput amide deuterium exchange-mass spectrometry (DXMS) determination of protein binding site structure and dynamics: Utility in pharmaceutical design. J. Cell. Biochem. Suppl. 37 89–98. [DOI] [PubMed] [Google Scholar]
- Wootton, J.C. and Federhen, S. 1993. Statistics of local complexity in amino acid sequences and sequence databases. Comput. Chem. 17 149–163. [Google Scholar]


