

Abstract
Experimental evidence is beginning to converge on an important role for dysregulation of glutamate carboxypeptidase II (GCPII) in schizophrenia. The goal of this study was to determine GCPII levels in postmortem brain specimens of patients with schizophrenia, bipolar disorder or unipolar depression and age-matched control subjects. We used N-[N(S)-1,3-dicarboxypropyl]carbamoyl]-S-3-[125I]iodo-l-tyrosine ([125I]DCIT), a high-affinity radioligand for GCPII, to probe for GCPII expression in prefrontal cortex (PFC) and mesial temporal lobe, two brain regions implicated in the pathophysiology of schizophrenia. We found that GCPII levels measured by [125I]DCIT quantitative autoradiography were significantly lower in the PFC and entorhinal cortex in patients with schizophrenia compared to age-matched controls. Patients with bipolar disorder also expressed significantly lower GCPII levels in PFC than controls. The decrease in [125I]DCIT binding in schizophrenia and bipolar disorder remained significant after adjusting for drug abuse. A significant difference in GCPII levels were also observed between schizophrenia relative to bipolar disorder and depressed subjects in the hippocampus-stratum lucidum and between schizophrenia and bipolar in the CA2 region of the hippocampus with bipolar and depressed subjects expressing higher levels of GCPII than subjects with schizophrenia. These differences in hippocampal GCPII levels may implicate differences in the etiologies of these mental disorders. In summary, this study demonstrates a regional dysregulation of GCPII expression in the brain of patients with schizophrenia and other psychiatric disorders and supports a hypoglutamatergic state of the former illness. GCPII may represent a viable therapeutic target for intervention in psychiatric disease. (241 words)
Keywords: Schizophrenia; bipolar disorder; depression; NAALADase; GCPII - [125I]DCIT, human brain; imaging
INTRODUCTION
1.1
Pharmacological and anatomical evidence suggests abnormal glutamatergic neurotransmission in schizophrenia and psychiatric disorders (Beneyto et al., 2007). An emerging hypothesis in the pathophysiology of schizophrenia is that it represents a hypoglutamatergic state (Lewis and Gonzalez-Burgos, 2006), (Coyle, 2006), (Coyle, 2004), (Olney et al., 1999). That hypothesis originated with the demonstration of decreased levels of glutamate in the cerebrospinal fluid (Kim et al., 1980) and, perhaps more significantly, from classic studies that showed the schizophrenogenic effects of administration of dissociative anesthetics such as ketamine and phencyclidine (PCP) in animal models and human subjects with the disease, (Javitt and Zukin, 1991), (Luby et al., 1959). The origins of the putative hypoglutamatergic state of schizophrenia remain unclear, however, several lines of evidence implicate dysregulation of the enzyme glutamate carboxypeptidase II (GCPII, EC 3.4.17.21). GCPII, also known as the prostate-specific membrane antigen (PSMA), is a peptidase expressed within prostate ≫ brain > kidney, liver, small intestine, spleen, trachea and spinal cord (Lambert and Mitchell, 2007). It is a known marker for prostate cancer, in which it is upregulated, and is a viable in vivo imaging target for this disease in both experimental animals and man (Pomper et al., 2002), (Foss et al., 2005), (Zhou et al., 2005).
GCPII is a type II integral membrane protein that, within the brain, resides primarily within glia, hydrolyzes extracellular N-acetylaspartylglutamate (NAAG) to N-acetylaspartate (NAA) and glutamate, and therefore impacts on glutamatergic transmission (Riveros and Orrego, 1984), (Blakely et al., 1988), (Luthi-Carter et al., 1998), (Neale et al., 2005).
NAAG is a glutamate cotransmitter, and glia-to-neuron as well as neuron-to-neuron signaling molecule (Urazaev et al., 2005). It is also the most abundant peptide neurotransmitter in the brain (Neale et al., 2005). Decreased GCPII transcript levels and activity in various brain subregions such as the prefrontal cortex (PFC) and hippocampus have been demonstrated in the brains of patients with schizophrenia, although some increases, particularly within the CA3-polymorphic hippocampal subregion, have also been reported (Tsai et al., 1995), (Ghose et al., 2004). A genome-wide expression analysis indicated decreased expression of the prostate-specific membrane antigen in dorsolateral PFC relative to controls (Hakak et al., 2001). Further, a translocation associated with an increased risk of schizophrenia has been identified at a locus in close proximity to that encoding GCPII (Coyle, 2004). Data from MR spectroscopy (MRS) in human subjects have shown a decrease in NAA levels, which may result from decreased GCPII activity in prefrontal cortex, temporal cortex and hippocampus, although only a portion of this NAA deficit may reflect changes in the neurotransmitter pool of glutamate. More likely, that deficit derives from a decrease in proliferation of dendrites and synaptic connections as well as a loss of glial integrity (Callicott et al., 2000), (Bertolino et al., 1996), (Maier et al., 1995), (Stanley et al., 2007).
Toward our efforts to probe glutamatergic transmission in vivo, we have synthesized a radiolabeled urea analog, N-[N-(S)-1,3-dicarboxypropyl]carbamoyl]-S-3-[125I]iodo-l-tyrosine ([125I]DCIT), that binds with high specificity to GCPII in rodent brain (Guilarte et al., 2005). In this report we describe the regional binding selectivity of [125I]DCIT in postmortem brain specimens of individuals with schizophrenia, bipolar disorder, unipolar depression and age-matched controls. We demonstrate a regional decrease in [125I]DCIT binding to GCPII, primarily within the PFC and entorhinal cortex (EC) in patients with schizophrenia. Subjects with bipolar disorder also demonstrate a significant decrease in GCPII levels in the PFC. Differences in GCPII levels between schizophrenia and bipolar and depressed subjects were also observed in hippocampal subregions. These findings represent the first study of GCPII protein expression in human brain pathology and lend further support to the importance of GCPII in the pathophysiology of psychiatric disease.
MATERIALS AND METHODS
2.1. Reagents
2-(Phosphonomethyl)-pentanedioic acid (PMPA) was purchased from Alexis Biochemicals (San Diego, CA, USA). [125I]DCIT, Ki = 1.5 nM, was synthesized as previously described (Guilarte et al., 2005), (Foss et al., 2005).
2.2. Brain tissue specimens from subject groups
Coronal slices (14 μm thick) of prefrontal lobe and hippocampus were provided by the Stanley Medical Research Institute brain bank (Torrey et al., 2000), (Webster, 2006). The prefrontal sections have primarily middle frontal gyrus, Brodmann area 46. The subject population consisted of tissue specimens from four groups (normal, bipolar disorder, unipolar depression and schizophrenia), each consisting of six females and nine males (total of 15 in each). Three brain slice samples from the PFC from the control group were either damaged or not present at arrival. Therefore, for the PFC, data was generated from n = 15 for schizophrenia, bipolar disorder and unipolar depression and n = 12 for normal controls. Specimens from the hippocampus did not always contain all of the hippocampal subregions and thus a significant degree of variability in the total number of specimens containing different hippocampal subregions is provided. Table 1 details the demographics of each group, including the average age at death, age range at death, duration of disease before death, the postmortem interval between death and processing of the brain specimens, the tissue pH, the lifetime medication exposure (where available, represented in fluphenazine units), number of subjects with a history of psychotic episodes, and the number of patients who committed suicide.
Table 1.
Subject demographics
| Normal | Bipolar | Depression | Schizophrenia | P-value† | F or Chi-squared value (df) | Exact P-value | |
|---|---|---|---|---|---|---|---|
| N* | 13 | 15 | 14 | 15 | n/a | n/a | n/a |
| F/M | 6/9 | 6/9 | 6/9 | 6/9 | n/a | n/a | n/a |
| Ave. age at death | 48 ± 11 | 42.3 ± 11.7 | 46.5 ± 9.3 | 44.5 ± 13.1 | 0.520 | 0.76 (53) | 0.608 |
| Age range at death | 29–68 | 30–61 | 30–65 | 25–62 | n/a | n/a | n/a |
| Ave. duration of disease | n/a | 20.1 ± 9.7 | 12.4 ± 11.4 | 21.3 ± 11.4 | 0.112 | 2.30 (42) | 0.067 |
| Postmortem interval | 23.7 ± 9.9 | 32.5 ± 16.1 | 27.5 ± 10.7 | 33.7 ± 14.6 | 0.147 | 1.86 (56) | 0.513 |
| Tissue pH | 6.27 ± 0.24 | 6.18 ± 0.23 | 6.18 ± 0.22 | 6.16 ± 0.26 | 0.616†† | 0.60 (55) | 0.611 |
| Fluphenazine (in 1,000 mg)** | n/a | 7.5 (0–60) | 0.0 | 35.0 (0–200) | 0.299 | 1.12 (28) | 0.124 |
| Psychosis | n/a | 11/15 | 0/14 | 15/15 | 0.107††† | 2.60 (1) | 0.100 |
| Suicide | 0/15 | 9/15 | 7/15 | 4/15 | 0.181††† | 2.17 (1) | 0.220 |
N = number of samples obtained from Stanley Foundation; values are mean ± sem
Fluphenazine equivalent, an indicator of exposure to medication; median (range)
Comparisons between all groups, except for duration (excluding normal), fluphenazine units (comparison between bipolar and schizophrenia only), psychosis (comparison between bipolar and schizophrenia only) and suicide (omitting normal)
The F-test was computed for pH varying by diagnosis
A chi-squared test was used for psychosis and suicide.
2.3. Quantitative autoradiography of [125I]DCIT binding to GCPII in the human brain
Quantitative autoradiography was performed in vitro using [125I]DCIT as previously described (Guilarte et al., 2005). Briefly, coronal sections of human frontal lobe and hippocampus, provided pre-mounted on slides, were stored at −80oC until use. Adjacent sections were used for total and nonspecific binding. After warming to room temperature and washing for 1 hr with 50 mM Tris-HCl buffer pH 7.4, slides were rinsed with same buffer twice for 3 min each and incubated for 2 h in 50 mM Tris-HCl buffer, 60 mM NaCl (pH 7.4) containing 1 nM [125I]DCIT to determine total binding. Adjacent sections to those used for total binding were used to determine nonspecific binding. Nonspecific binding was determined in the presence of 1 μM PMPA using the same conditions as for total binding with the addition of 1 mM PMPA. Slides were then washed four times in buffer at 4oC for 3 min and dipped briefly in dH2O at 4°C. Slides were dried under a stream of cool air and apposed to Kodak BioMax-MR film (Kodak Molecular Imaging, New Haven, CT) for approximately 4 h at room temperature. Iodine-125 labeled microscales (Amersham) were included in each film. Images of [125I]DCIT binding to GCPII in human brain were acquired using the Inquiry system (Loats Associates, Westminster, MD) and regional distribution was measured using NIH Image version 1.62. Anatomic identification of brain structures was performed by consensus of two neuroradiologists (D.A.H. and M.G.P.) with the aid of a brain atlas (Duvernoy and Bourgouin, 1998). Brain regions outlined for region-of-interest analysis included: PFC (n = 55), frontal white matter (FC-WM, n = 58), entorhinal cortex (EC, n = 27), stratum lucidum (SL, n = 43), and hippocampal subregions CA1 (n = 37), CA2 (n = 31), CA3 (n = 22) and CA4 (n = 28). Regions were excluded if absent from the tissue specimen. Specific binding was determined by subtracdting nonspecific binding from total binding in adjacent sections for each brain sample.
2.4. Statistical analysis
Exploratory analysis was performed to investigate missing data patterns and to eliminate observations with unsupportable values. Dot plots (analogous to boxplots) were created to compare diagnosis groups. Hypothesis tests, including t-tests and Fisher’s exact test, were employed to consider potential relationships between possible confounding variables, such as drug or alcohol use, and diagnosis group. Group level differences in GCPII were evaluated using ANOVA models and, subsequently, linear models that included relevant potential confounders. Residuals were examined to diagnose outliers and normality assumptions. Quantile/quantile plots of residuals were used to evaluate normality of errors while Kruskal/Wallace non-parametric tests were also employed to validate the ANOVA model based results. Models that included drug abuse were considered, though we note that it was largely independent of diagnosis (Fisher’s exact test P-value of 0.3415). A complementary analysis was performed that considered the severity of alcohol abuse, which yielded similar conclusions. In addition, models that included a term for fluphenazine equivalent were considered, however, we note that no control subjects received medication. Subgroup models of only bipolar and schizophrenic subjects, who had similar fluphenazine equivalent, were evaluated. Similar aliasing existed between diagnosis group and whether or not the subject had committed suicide with no suicidal control subjects compared to over half of the bipolar subjects. Subgroup analysis considering only nonsuicidal subjects were evaluated, though there were too few such bipolar and depressed subjects for the comparisons to be meaningful. We note that one possible limitation of these data includes multiplicity concerns, since multiple regions and comparisons were simultaneously considered.
RESULTS
3.1
We recognize that in a postmortem study such as this there are many potential confounding factors. The most significant confounds include different histories of medication use and/or drug abuse between the groups undergoing comparison. We have done our best to account for such differences, and have found the subject groups of the specimens provided to us by the Stanley Medical Research Institute brain bank to be comparable. On investigating subject demographics we determined that there was no difference across groups for age, duration of disease (for diseased groups only), postmortem interval, psychosis (between bipolar and schizophrenia), specimen tissue pH, (for all groups) medication exposure (between bipolar and schizophrenia) and suicide (for diseased groups only) (Table 1). In summary, apart from the occurrence of suicide, the normal and depressed groups are very comparable. The bipolar and schizophrenia groups are very comparable in every sense.
Figure 1 shows representative autoradiographic images of [125I]DCIT total and non-specific binding in the PFC to demonstrate binding specificity. We found that the amount and distribution of [125I]DCIT binding to GCPII in the brain followed a similar pattern as demonstrated for GCPII mRNA levels in the PFC, hippocampus and EC (Ghose et al., 2004). [125I]DCIT specific binding to GCPII was expressed at higher levels in white matter than gray matter as previously shown for transcript levels and activity (Figure 1 and Table 2) (Ghose et al., 2004), (Sacha et al., 2006). These findings confirm the specificity and utility of [125I]DCIT to assess GCPII levels in the human brain using quantitative autoradiography.
Figure 1.
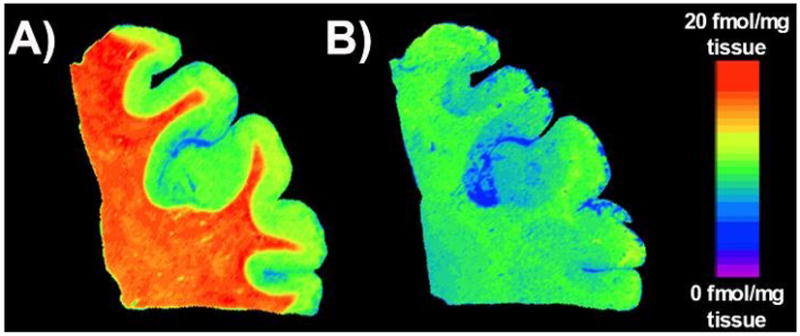
Representative pseudocolor autoradiographic images of [125I]DCIT binding to frontal cortex brain tissue. A) Image represents levels of [125I]DCIT total binding and B) is representative of [125I]DCIT nonspecific binding using 2-PMPA as a selective blocker of [125I]DCIT binding to GCPII.
Table 2.
GCPII levels – [125I]DCIT binding (fmol/mg tissue)
| Normal | Schizophrenia | Bipolar | Depression | |
|---|---|---|---|---|
| Frontal cortex | ||||
| FC-GM | 5.6 ± 0.7 (12) | 2.7 ± 0.6 (15) | 3.5 ± 0.6 (15) | 3.7 ± 0.7 (15) |
| FC-WM | 20.1 ± 1.6 (12) | 15.6 ± 0.8 (15) | 17.0 ± 2.2 (15) | 18.5 ± 1.3 (15) |
| Hippocampus | ||||
| CA1 | 1.57 ± 0.36 (10) | 1.07 ± 0.36 (11) | 1.06 ± 0.10 (6) | 1.42 ± 0.43 (10) |
| CA2 | 2.84 ± 0.49 (9) | 1.64 ± 0.36 (9) | 4.29 ± 0.95 (6) | 3.02 ± 0.49 (7) |
| CA3 | 2.95 ± 0.64 (6) | 1.76 ± 0.24 (4) | 3.50 ± 0.27 (5) | 2.70 ± 0.61 (7) |
| CA4 | 2.49 ± 0.43 (8) | 1.07 ± 0.28 (5) | 1.67 ± 0.32 (7) | 2.07 ± 0.75 (8) |
| SL | 7.10 ± 0.47 (12) | 6.43 ± 0.70 (11) | 8.80 ± 0.57 (9) | 8.96 ± 0.55 (11) |
| EC | 3.78 ± 0.53 (8) | 1.10 ± 0.45 (6) | 3.24 ± 0.80 (6) | 2.69 ± 0.50 (7) |
Values are mean ± sem; Numbers in parentheses are the number of individuals analyzed for that region. Abbreviations are as follows: FC-GM = frontal cortex gray matter; FC-WM = frontal cortex white matter; CA1-CA4 = Cornus Amonis subfields; SL = stratum lucidum; EC = entorhinal cortex.
Table 2 provides levels of [125I]DCIT specific binding to GCPII in the various brain regions from the different groups of subjects. In the brain of normal subjects, [125I]DCIT specific binding to GCPII was greatest in frontal white matter (Table 2 and Figure 1). The level of binding in frontal white matter was approximately four times the level of binding in frontal gray matter. This is consistent with the glial localization of GCPII and the high number of glial cells in subcortical white matter. In the hippocampus, the SL contained the highest level of binding followed by the EC (Table 2).
Figure 2 depicts the distribution of [125I]DCIT total binding in the PFC and hippocampus of a schizophrenia patient and a normal subject. Group comparisons revealed a significant change in [125I]DCIT specific binding to GCPII between schizophrenics and controls in the EC, with an estimated decrease of −2.7 fmol/mg tissue (P < 0.05) (Table 3). This difference persisted after adjustment for drug abuse. Similarly, a decrease of −2.8 fmol/mg tissue (P < 0.05) within the schizophrenic population when compared to controls was seen in the PFC (grey matter), and remained significant after adjustment for drug abuse. A significant decrease in [125I]DCIT specific binding was also observed in the PFC of bipolar subjects relative to controls (−2.1 fmol/mg tissue, P < 0.05) and this difference remained significant after adjusting for drug abuse.
Figure 2.
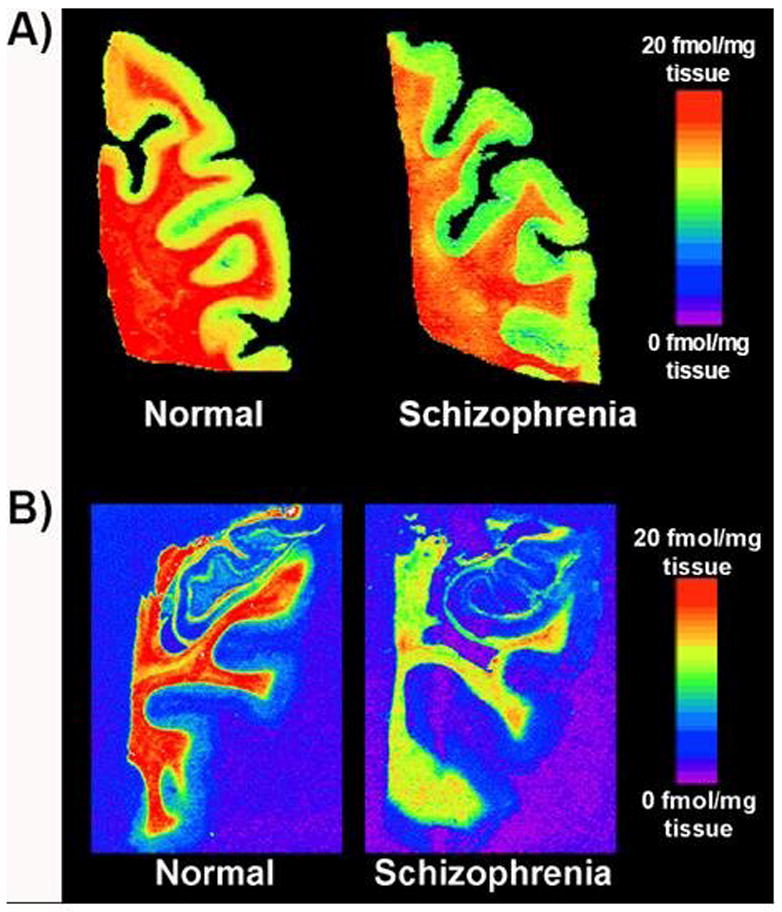
Representative pseudocolor autoradiographic images of [125I]DCIT binding to A) frontal cortex and B) hippocampus from a normal subject and patient with schizophrenia.
Finally, we observed a significant difference between bipolar and depressed subjects and schizophrenia patients in the SL, with bipolar and depressed subjects expressing a much higher level of [125I]DCIT specific binding (Figure 3). This same effect was also present in the CA2 region between bipolar and schizophrenia patients (Figure 3). Lastly, a significant increase in mean [125I]DCIT specific binding was observed in bipolar disorder and depressed subjects compared to controls in the SL of the hippocampal formation (1.7 and 1.9 fmol/mg tissue, respectively; data not shown). However, both of these effects became statistically non-significant (at the P = 0.05 level) after adjusting for drug abuse.
Figure 3.
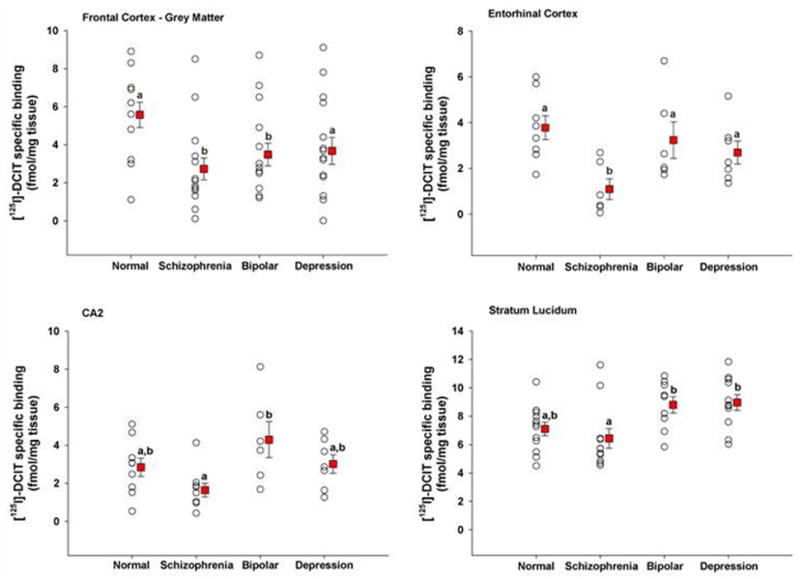
Scatter plots of [125I]DCIT specific binding to brain regions in which significant differences were noted amongst patient groups. Within a brain region, groups with different letters are significantly different from each other at p < 0.05. Values are expressed as mean ± s.e.m.
DISCUSSION
4.1
Schizophrenia affects about one percent of the world population yet its pathophysiology remains unresolved. The morphological correlates of schizophrenia are subtle and it is likely that a greater understanding of its underlying pathophysiology may derive from the study of functional rather than anatomic markers (Weinberger, 2005). Because reliable postmortem specimens are difficult to obtain, in vivo imaging of individuals with schizophrenia may provide a fruitful route of investigation (Ohnuma et al., 2005). There have been many functional and molecular imaging studies of schizophrenia interrogating a variety of phenomena including blood flow and a number of neurotransmitter systems and their interactions. One neurotransmitter system that has remained elusive with respect to in vivo imaging, however, is the glutamatergic system (Laruelle et al., 2005). This report represents an intermediate step in our efforts to image glutamatergic transmission in vivo, that is, to test a high affinity and specific radioligand for GCPII in well-characterized postmortem brain specimens of patients with psychiatric disease and normal, age-matched controls.
Our results indicate decreased levels of GCPII in the PFC and EC of schizophrenia patients supporting previous findings demonstrated by GCPII activity assay (Tsai et al., 1995), (Tsai, 2005), (Hakak et al., 2001). However, we differ from Ghose et al. who demonstrated no difference in GCPII mRNA levels in dorsolateral PFC between controls and patients with schizophrenia but did demonstrate higher levels in the hippocampal CA3 subregion. We were unable to generate significant differences between controls and patients with psychiatric disease within specific hippocampal subregions once the confounding factor of drug abuse was included in the analysis. However, a higher level of [125I]DCIT specific binding was observed between bipolar and depressed subjects relative to schizophrenia in the hippocampus (CA2 subregion and stratum lucidum). The reasons for the discrepancy between protein levels determined by us and the regional mRNA levels of Ghose et al. are not clear, but suggest that the lower GCPII protein levels are not due to decreased expression of the GCPII transcript, (Ghose et al., 2004). Alternatively, only a subset of patients with schizophrenia may demonstrate low levels of GCPII, and antipsychotic medications may alter regional GCPII expression in a subpopulation of patients. Although no definite pH or postmortem interval exists below which (for pH) or above which (for PMI) specimens should be discarded, specimens –and measurements in these parameters – do differ between laboratories suggesting that technical difference may also account for the differences noted by Ghose et al. and us (Webster, 2006). Nudmamud et al. did not show differences in NAA or NAAG levels in frontal cortex between normal controls and patients with psychiatric disease, however, they sampled Brodmann area 10 (polar prefrontal) rather than dorsolateral prefrontal, as in our case (Nudmamud et al., 2003). The regionally lower levels of GCPII expression we demonstrated in schizophrenia are not likely due to atrophy within the frontal or mesial temporal lobe since schizophrenia is not likely a neurodegenerative disease – the composition of neurons and glia remain largely intact (Lim et al., 1998), particularly in dorsolateral PFC (Molina et al., 2006), although there is a demonstrable decrease in hippocampal volume that is diagnostically specific (Harrison, 2004). However, some MRS-based studies posit that regionally low NAA levels may indeed be due to neuron loss or at least dysfunction (Delamillieure et al., 2002).
GCPII has widespread expression within the human brain, particularly within astrocytes (Ghose et al., 2004), (Sacha et al., 2006). Importantly, we did not see differences in [125I]DCIT specific binding to GCPII in frontal lobe white matter between controls and any of the psychiatric conditions. A small, non-significant trend toward decreased [125I]DCIT specific binding in frontal white matter from schizophrenic patients was noted relative to the other groups. That lack of significance could be due to the relatively small sample size of this study.
The majority of evidence for regional neuropathology/pathophysiology in schizophrenia has been found in the hippocampus, PFC and superior temporal cortex (Harrison, 2004). Glutamatergic pyramidal cells interconnect prefrontal cortex, temporal cortex/hippocampus and thalamus, all of which have been shown to be disrupted in schizophrenia in brain imaging studies (Coyle, 2004). Our findings and those of others point toward decreased GCPII activity, broadly meaning protein level as well as enzymatic activity, in these structures in patients with schizophrenia. However, the ability to link this GCPII decrease to the pathogenesis of schizophrenia remains challenging. Recent evidence suggests that it may be the agonist activity of NAAG at presynaptic group II metabotropic glutamate (mGlu) receptors, primarily mGluR3, that produces a decrease in glutamate release and accounts for the influence of GCPII activity on glutamatergic transmission in schizophrenia (Neale et al., 2005). Another site at which NAAG can affect glutamatergic synapses is its action as an N-methyl-d-aspartate (NMDA) receptor antagonist (Coyle, 2004), (Coyle, 2006). In hippocampal neurons, NAAG inhibits NMDA receptor currents and impairs the induction of NMDA receptor dependent long-term potentiation (Bergeron et al., 2005), (Bergeron et al., 2007). However, one study has demonstrated that NAAG does not inhibit NMDA receptors in cerebellar granule neurons (Losi et al., 2004) and another shows a similar result in hippocampus (Lea et al., 2001). These conflicting results suggest that the inhibitory effects of NAAG on NMDA receptors may be dependent upon brain region and subunit composition. Alternatively, the effect of increasing NAAG concentrations from decreased GCPII activity or levels in brain regions relevant to schizophrenia may produce both an inhibition of glutamate release by activation of mGluR3 presynaptic receptors and inhibition of NMDA receptors resulting in a marked hypofunction of the glutamatergic system.
We observed decreased GCPII levels in the PFC of patients with bipolar disorder relative to controls, and GCPII levels were significantly increased in the hippocampus of bipolar and depressed subjects relative to schizophrenia patients (Figure 3). Although the neurobiological bases for such effects is not currently known, glutamatergic transmission is increasingly recognized as being dysregulated in depression (Belsham, 2001), (Choudary et al., 2005), with certain antiseizure agents known to decrease glutamate levels having a salutary effect in the disease (Abelli et al., 2005), and in bipolar disorders. That we demonstrated a similar trend in GCPII levels in PFC in patients with schizophrenia, depression and bipolar disorder is in keeping with the recent finding that these disorders may share common genetic mechanisms (Clapcote et al., 2007). To our knowledge, this is the first report to implicate dysregulation of GCPII levels in the pathogenesis of bipolar or major depressive disorder.
Despite a decrease in GCPII levels in postmortem specimens of individuals with schizophrenia, reductions in GCPII activity in vivo by administration of novel GCPII inhibitors have proved to ameliorate the symptoms of PCP-induced psychosis in an animal model (Olszewski et al., 2004). Neale and colleagues have proposed that a PCP-induced reduction in GABA-mediated inhibitory tone stimulates the co-release of NAAG and glutamate in prefrontal cortex, with this elevated extracellular NAAG – potentiated by GCPII inhibition – contributing further to increased group II mGlu receptor activation and decreased glutamate release in prefrontal cortex (Neale et al., 2005). So it would appear that increased NAAG, as can be affected by attenuation of GCPII activity, would provide a viable therapeutic option for schizophrenia. However, it should be noted that it is merely the psychotic symptoms of the PCP rodent model of schizophrenia that are improved by treatment with GCPII inhibitors – compounds of precisely the same class as that of [125I]DCIT – not the psychosis demonstrated in schizophrenia patients. For that reason the quest for viable radioligands for in vivo GCPII imaging that are fully quantifiable, enable longitudinal studies and are not subject to sampling error remains an important endeavor to understand glutamatergic transmission in health and disease.
Acknowledgments
ROLE OF FUNDING SOURCE
Funding was provided by grants from the NCI (U24 CA92871 and CA114111 to M.G.P.), from NIBIB (EB005324 to M.G.P.) and NIEHS (ES06189 to T.R.G.). The NIH had no further role in study design, analysis of data, writing of this report or in deciding when to publish.
This work was supported by U24 CA92871, CA114111, EB005324 to MGP and ES06189 to TRG. We also thank Dr. Joseph Neale for helpful discussions.
Footnotes
CONTRIBUTORS
T.R.G. designed the study, analyzed the data and wrote the manuscript.
D.A.H. analyzed the data.
G.L.M. performed autoradiography.
B.S.C. performed statistical analysis and wrote the manuscript.
C.A.F. synthesized and purified the radiopharmaceutical.
A.P.K. provided synthetic oversight and guidance.
M.G.P. conceived and designed the study, analyzed the data, performed literature searches and wrote the manuscript.
DISCLOSURE/CONFLICTS OF INTEREST
None
Publisher's Disclaimer: This is a PDF file of an unedited manuscript that has been accepted for publication. As a service to our customers we are providing this early version of the manuscript. The manuscript will undergo copyediting, typesetting, and review of the resulting proof before it is published in its final citable form. Please note that during the production process errors may be discovered which could affect the content, and all legal disclaimers that apply to the journal pertain.
References
- Abelli M, Martini C, Pini S, Gesi C, Cassano GB. The role of newer antiglutamatergic agents as mood-stabilizers in bipolar disorder. Curr Drug Targets. 2005;6:607–14. doi: 10.2174/1389450054546015. [DOI] [PubMed] [Google Scholar]
- Belsham B. Glutamate and its role in psychiatric illness. Hum Psychopharmacol. 2001;16:139–146. doi: 10.1002/hup.279. [DOI] [PubMed] [Google Scholar]
- Beneyto M, Kristiansen LV, Oni-Orisan A, McCullumsmith RE, Meador-Woodruff JH. Abnormal Glutamate Receptor Expression in the Medial Temporal Lobe in Schizophrenia and Mood Disorders. Neuropsychopharmacology. 2007 doi: 10.1038/sj.npp.1301312. Epub. [DOI] [PubMed] [Google Scholar]
- Bergeron R, Coyle JT, Tsai G, Greene RW. NAAG reduces NMDA receptor current in CA1 hippocampal pyramidal neurons of acute slices and dissociated neurons. Neuropsychopharmacology. 2005;30:7–16. doi: 10.1038/sj.npp.1300559. [DOI] [PubMed] [Google Scholar]
- Bergeron R, Imamura Y, Frangioni JV, Greene RW, Coyle JT. Endogenous N-acetylaspartylglutamate reduced NMDA receptor-dependent current neurotransmission in the CA1 area of the hippocampus. J Neurochem. 2007;100:346–57. doi: 10.1111/j.1471-4159.2006.04253.x. [DOI] [PubMed] [Google Scholar]
- Bertolino A, Nawroz S, Mattay VS, Barnett AS, Duyn JH, Moonen CT, et al. Regionally specific pattern of neurochemical pathology in schizophrenia as assessed by multislice proton magnetic resonance spectroscopic imaging. Am J Psychiatry. 1996;153:1554–63. doi: 10.1176/ajp.153.12.1554. [DOI] [PubMed] [Google Scholar]
- Blakely RD, Robinson MB, Thompson RC, Coyle JT. Hydrolysis of the brain dipeptide N-acetyl-L-aspartyl-L-glutamate: subcellular and regional distribution, ontogeny, and the effect of lesions on N-acetylated-alpha-linked acidic dipeptidase activity. J Neurochem. 1988;50:1200–9. doi: 10.1111/j.1471-4159.1988.tb10593.x. [DOI] [PubMed] [Google Scholar]
- Callicott JH, Bertolino A, Mattay VS, Langheim FJ, Duyn J, Coppola R, et al. Physiological dysfunction of the dorsolateral prefrontal cortex in schizophrenia revisited. Cereb Cortex. 2000;10:1078–92. doi: 10.1093/cercor/10.11.1078. [DOI] [PubMed] [Google Scholar]
- Choudary PV, Molnar M, Evans SJ, Tomita H, Li JZ, Vawter MP, et al. Altered cortical glutamatergic and GABAergic signal transmission with glial involvement in depression. Proc Natl Acad Sci U S A. 2005;102:15653–8. doi: 10.1073/pnas.0507901102. [DOI] [PMC free article] [PubMed] [Google Scholar]
- Clapcote SJ, Lipina TV, Millar JK, Mackie S, Christie S, Ogawa F, et al. Behavioral phenotypes of Disc1 missense mutations in mice. Neuron. 2007;54:387–402. doi: 10.1016/j.neuron.2007.04.015. [DOI] [PubMed] [Google Scholar]
- Coyle JT. The GABA-glutamate connection in schizophrenia: which is the proximate cause? Biochem Pharmacol. 2004;68:1507–14. doi: 10.1016/j.bcp.2004.07.034. [DOI] [PubMed] [Google Scholar]
- Coyle JT. Glutamate and Schizophrenia: Beyond the Dopamine Hypothesis. Cell Mol Neurobiol. 2006;26:365–84. doi: 10.1007/s10571-006-9062-8. [DOI] [PMC free article] [PubMed] [Google Scholar]
- Delamillieure P, Constans JM, Fernandez J, Brazo P, Benali K, Courtheoux P, et al. Proton magnetic resonance spectroscopy (1H MRS) in schizophrenia: investigation of the right and left hippocampus, thalamus, and prefrontal cortex. Schizophr Bull. 2002;28:329–39. doi: 10.1093/oxfordjournals.schbul.a006942. [DOI] [PubMed] [Google Scholar]
- Duvernoy HM, Bourgouin P. The human hippocampus: functional anatomy, vascularization and serial sections with MRI. New York, NY: Springer-Verlag; 1998. [Google Scholar]
- Foss CA, Mease RC, Fan H, Wang Y, Ravert HT, Dannals RF, et al. Radiolabeled Small Molecule Ligands for Prostate-specific Membrane Antigen: In Vivo Imaging in Experimental Models of Prostate Cancer. Clin Cancer Res. 2005;11:4022–4028. doi: 10.1158/1078-0432.CCR-04-2690. [DOI] [PubMed] [Google Scholar]
- Ghose S, Weickert CS, Colvin SM, Coyle JT, Herman MM, Hyde TM, et al. Glutamate carboxypeptidase II gene expression in the human frontal and temporal lobe in schizophrenia. Neuropsychopharmacology. 2004;29:117–25. doi: 10.1038/sj.npp.1300304. [DOI] [PubMed] [Google Scholar]
- Guilarte TR, McGlothan JL, Foss CA, Zhou J, Heston WD, Kozikowski AP, et al. Glutamate carboxypeptidase II levels in rodent brain using [125I]DCIT quantitative autoradiography. Neurosci Lett. 2005;387:141–4. doi: 10.1016/j.neulet.2005.06.015. [DOI] [PubMed] [Google Scholar]
- Hakak Y, Walker JR, Li C, Wong WH, Davis KL, Buxbaum JD, et al. Genome-wide expression analysis reveals dysregulation of myelination-related genes in chronic schizophrenia. Proc Natl Acad Sci U S A. 2001;98:4746–51. doi: 10.1073/pnas.081071198. [DOI] [PMC free article] [PubMed] [Google Scholar]
- Harrison PJ. The hippocampus in schizophrenia: a review of the neuropathological evidence and its pathophysiological implications. Psychopharmacology (Berl) 2004;174:151–62. doi: 10.1007/s00213-003-1761-y. [DOI] [PubMed] [Google Scholar]
- Javitt DC, Zukin SR. Recent advances in the phencyclidine model of schizophrenia. Am J Psychiatry. 1991;148:1301–8. doi: 10.1176/ajp.148.10.1301. [DOI] [PubMed] [Google Scholar]
- Kim JS, Kornhuber HH, Schmid-Burgk W, Holzmuller B. Low cerebrospinal fluid glutamate in schizophrenic patients and a new hypothesis on schizophrenia. Neurosci Lett. 1980;20:379–82. doi: 10.1016/0304-3940(80)90178-0. [DOI] [PubMed] [Google Scholar]
- Lambert LA, Mitchell SL. Molecular Evolution of the Transferrin Receptor/Glutamate Carboxypeptidase II Family. J Mol Evol. 2007;64:113–28. doi: 10.1007/s00239-006-0137-4. [DOI] [PubMed] [Google Scholar]
- Laruelle M, Frankle WG, Narendran R, Kegeles LS, Abi-Dargham A. Mechanism of action of antipsychotic drugs: from dopamine D(2) receptor antagonism to glutamate NMDA facilitation. Clin Ther. 2005;27(Suppl A):S16–24. doi: 10.1016/j.clinthera.2005.07.017. [DOI] [PubMed] [Google Scholar]
- Lea PMt, Wroblewska B, Sarvey JM, Neale JH. beta-NAAG rescues LTP from blockade by NAAG in rat dentate gyrus via the type 3 metabotropic glutamate receptor. J Neurophysiol. 2001;85:1097–106. doi: 10.1152/jn.2001.85.3.1097. [DOI] [PubMed] [Google Scholar]
- Lewis DA, Gonzalez-Burgos G. Pathophysiologically based treatment interventions in schizophrenia. Nat Med. 2006;12:1016–22. doi: 10.1038/nm1478. [DOI] [PubMed] [Google Scholar]
- Lim KO, Adalsteinsson E, Spielman D, Sullivan EV, Rosenbloom MJ, Pfefferbaum A. Proton magnetic resonance spectroscopic imaging of cortical gray and white matter in schizophrenia. Arch Gen Psychiatry. 1998;55:346–52. doi: 10.1001/archpsyc.55.4.346. [DOI] [PubMed] [Google Scholar]
- Losi G, Vicini S, Neale J. NAAG fails to antagonize synaptic and extrasynaptic NMDA receptors in cerebellar granule neurons. Neuropharmacology. 2004;46:490–6. doi: 10.1016/j.neuropharm.2003.10.007. [DOI] [PubMed] [Google Scholar]
- Luby ED, Cohen BD, Rosenbaum G, Gottlieb JS, Kelley R. Study of a new schizophrenomimetic drug; sernyl. AMA Arch Neurol Psychiatry. 1959;81:363–9. doi: 10.1001/archneurpsyc.1959.02340150095011. [DOI] [PubMed] [Google Scholar]
- Luthi-Carter R, Barczak AK, Speno H, Coyle JT. Molecular characterization of human brain N-acetylated alpha-linked acidic dipeptidase (NAALADase) J Pharmacol Exp Ther. 1998;286:1020–5. [PubMed] [Google Scholar]
- Maier M, Ron MA, Barker GJ, Tofts PS. Proton magnetic resonance spectroscopy: an in vivo method of estimating hippocampal neuronal depletion in schizophrenia. Psychol Med. 1995;25:1201–9. doi: 10.1017/s0033291700033171. [DOI] [PubMed] [Google Scholar]
- Molina V, Sanz J, Sarramea F, Luque R, Benito C, Palomo T. No association between dorsolateral prefrontal gray matter deficit and N-acetyl aspartate ratios in schizophrenia. Neuropsychobiology. 2006;54:171–8. doi: 10.1159/000098653. [DOI] [PubMed] [Google Scholar]
- Neale JH, Olszewski RT, Gehl LM, Wroblewska B, Bzdega T. The neurotransmitter N-acetylaspartylglutamate in models of pain, ALS, diabetic neuropathy, CNS injury and schizophrenia. Trends Pharmacol Sci. 2005;26:477–84. doi: 10.1016/j.tips.2005.07.004. [DOI] [PubMed] [Google Scholar]
- Nudmamud S, Reynolds LM, Reynolds GP. N-acetylaspartate and N-Acetylaspartylglutamate deficits in superior temporal cortex in schizophrenia and bipolar disorder: a postmortem study. Biol Psychiatry. 2003;53:1138–41. doi: 10.1016/s0006-3223(02)01742-0. [DOI] [PubMed] [Google Scholar]
- Ohnuma T, Suzuki T, Arai H. Hypothesis: minimal changes in neural transmission in schizophrenia: decreased glutamatergic and GABAergic functions in the prefrontal cortex. Prog Neuropsychopharmacol Biol Psychiatry. 2005;29:889–94. doi: 10.1016/j.pnpbp.2005.04.038. [DOI] [PubMed] [Google Scholar]
- Olney JW, Newcomer JW, Farber NB. NMDA receptor hypofunction model of schizophrenia. J Psychiatr Res. 1999;33:523–33. doi: 10.1016/s0022-3956(99)00029-1. [DOI] [PubMed] [Google Scholar]
- Olszewski RT, Bukhari N, Zhou J, Kozikowski AP, Wroblewski JT, Shamimi-Noori S, et al. NAAG peptidase inhibition reduces locomotor activity and some stereotypes in the PCP model of schizophrenia via group II mGluR. J Neurochem. 2004;89:876–85. doi: 10.1111/j.1471-4159.2004.02358.x. [DOI] [PubMed] [Google Scholar]
- Pomper MG, Musachio JL, Zhang J, Scheffel U, Zhou Y, Hilton J, et al. 11C-MCG: synthesis, uptake selectivity, and primate PET of a probe for glutamate carboxypeptidase II (NAALADase) Mol Imaging. 2002;1:96–101. doi: 10.1162/15353500200202109. [DOI] [PubMed] [Google Scholar]
- Riveros N, Orrego F. A study of possible excitatory effects of N-acetylaspartylglutamate in different in vivo and in vitro brain preparations. Brain Res. 1984;299:393–5. doi: 10.1016/0006-8993(84)90727-3. [DOI] [PubMed] [Google Scholar]
- Sacha P, Zamecnik J, Barinka C, Hlouchova K, Vicha A, Mlcochova P, et al. Expression of glutamate carboxypeptidase II in human brain. Neuroscience. 2006;144:1361–1372. doi: 10.1016/j.neuroscience.2006.10.022. [DOI] [PubMed] [Google Scholar]
- Stanley JA, Vemulapalli M, Nutche J, Montrose DM, Sweeney JA, Pettegrew JW, et al. Reduced N-acetyl-aspartate levels in schizophrenia patients with a younger onset age: A single-voxel (1)H spectroscopy study. Schizophr Res. 2007;93:23–32. doi: 10.1016/j.schres.2007.03.028. [DOI] [PMC free article] [PubMed] [Google Scholar]
- Torrey EF, Webster M, Knable M, Johnston N, Yolken RH. The stanley foundation brain collection and neuropathology consortium. Schizophr Res. 2000;44:151–5. doi: 10.1016/S0920-9964(99)00192-9. [DOI] [PubMed] [Google Scholar]
- Tsai G, Passani LA, Slusher BS, Carter R, Baer L, Kleinman JE, et al. Abnormal excitatory neurotransmitter metabolism in schizophrenic brains. Arch Gen Psychiatry. 1995;52:829–36. doi: 10.1001/archpsyc.1995.03950220039008. [DOI] [PubMed] [Google Scholar]
- Tsai SJ. Central N-acetyl aspartylglutamate deficit: a possible pathogenesis of schizophrenia. Med Sci Monit. 2005;11:HY39–45. [PubMed] [Google Scholar]
- Urazaev AK, Grossfeld RM, Lieberman EM. Regulation of glutamate carboxypeptidase II hydrolysis of N-acetylaspartylglutamate (NAAG) in crayfish nervous tissue is mediated by glial glutamate and acetylcholine receptors. J Neurochem. 2005;93:605–10. doi: 10.1111/j.1471-4159.2005.03041.x. [DOI] [PubMed] [Google Scholar]
- Webster MJ. Tissue preparation and banking. Prog Brain Res. 2006;158:3–14. doi: 10.1016/S0079-6123(06)58001-X. [DOI] [PubMed] [Google Scholar]
- Weinberger DR. Genetic mechanisms of psychosis: in vivo and postmortem genomics. Clin Ther. 2005;27 Suppl A:S8–15. doi: 10.1016/j.clinthera.2005.07.016. [DOI] [PubMed] [Google Scholar]
- Zhou J, Neale JH, Pomper MG, Kozikowski AP. NAAG peptidase inhibitors and their potential for diagnosis and therapy. Nat Rev Drug Discov. 2005;4:1015–1026. doi: 10.1038/nrd1903. [DOI] [PubMed] [Google Scholar]