

Abstract
Transient Receptor Potential (TRP) channels are involved in sensing chemical and physical changes inside and outside of cells. TRPV3 is highly expressed in skin keratinocytes, where it forms a non-selective cation channel activated by hot temperatures in the innocuous and noxious range. The channel has also been implicated in flavor sensation in oral and nasal cavities as well as being a molecular target of some allergens and skin sensitizers. TRPV3 is unique in that its activity is sensitized upon repetitive stimulations. Here, we investigated the role of calcium ions in the sensitization of TRPV3 to repetitive stimulations. We show that the sensitization is accompanied with a decrease of Ca2+-dependent channel inhibition mediated by calmodulin acting at an N-terminal site (aa 108-130) and by an acidic residue (Asp641) at the pore loop of TRPV3. These sites also contribute to the voltage dependence of TRPV3. During sensitization, the channel displayed a gradual shift of the voltage dependence to more negative potentials as well as uncoupling from voltage sensing. The initial response to ligand stimulation was increased and sensitization to repetitive stimulations was decreased by increasing the intracellular Ca2+ buffering strength, inhibiting calmodulin, or disrupting the calmodulin-binding site. Mutation of Asp641 to Asn abolished the high affinity extracellular Ca2+-mediated inhibition and greatly facilitated the activation of TRPV3. We conclude that Ca2+ inhibits TRPV3 from both the extracellular and intracellular sides. The inhibition is sequentially reduced, appearing as sensitization to repetitive stimulations.
Keywords: TRP channels, calmodulin, temperature sensing, ion channel regulation, voltage-dependence
Members of the Transient Receptor Potential (TRP) superfamily of cation channels have been recognized to play important roles in sensing various environmental changes inside and outside of cells as well as the whole organisms (1). In mammals, temperature sensing is thought to be accomplished through concerted actions of a minimum of six TRP channels, i.e. TRPA1, M8, V4, V3, V1, and V2, each covering a defined temperature range from below 17°C to above 52°C (2,3). However, it remains debated whether some of these channels, e.g. TRPA1, are really temperature sensitive (4). In addition, TRPM2, M4, and M5 have shown temperature sensing in the presence of second messenger coafactors, such as ADP-ribose and Ca2+ (5,6). While some of the thermosensitive TRP channels are clearly expressed and functional in sensory neurons, indicative of their actions in primary afferents, others have been localized in the non-nervous tissues, for example, TRPV3 and V4 are expressed in skin keratinocytes (7,8) and TRPV3 is, in addition, expressed in the epithelium of tongue and nose (9). The TRPV3 null mice showed some deficits in sensing hot temperatures in the innocuous and noxious range but no other obvious sensory impairment (10). On the other hand, constitutively active mutations of TRPV3 have been linked to hair loss and atopic dermatitis-like skin lesions in rodents (11,12).
In addition to temperature, the thermosensitive TRP channels are activated by a large number of structurally unrelated chemical ligands from exogenous as well as endogenous sources (13). This polymodal nature has become a common feature of the TRP channel family, implicating that multiple mechanisms and external stimuli may be involved in the activation and regulation of these channels. TRPV3 was first shown to be activated by 2-aminoethoxydiphenyl borate (2APB), a synthetic compound known to inhibit inositol 1,4,5-trisphosphate receptors and store-operated channels as well as many TRP channels (14,15). It was soon discovered that a number of natural anti-irritants and flavor enhancers such as camphor, carvacrol, thymol, and eugenol, also use TRPV3 as one of their targets (9,10). More importantly, cell signaling events leading to the activation of phospholipase C, phosphorylation by protein kinase C, and the release of unsaturated, especially polyunsaturated, fatty acids are known to enhance the function of the TRPV3 channel (9,16).
One of the unique properties of TRPV3 is that its activity is enhanced during repetitive stimulations (17,18). This sensitization upon repetitive stimulations is in contrast to many other channels including those that share similar structure, function and mechanism of activation with TRPV3. For instance, TRPV1 and TRPV4 are both desensitized upon repetitive stimulations (8,19,20). Although TRPV1 and TRPV2 occasionally displayed enhanced responses to repeated heat stimulations when expressed in Xenopus oocytes (21), the sensitization of TRPV3 appears to be independent of the stimuli, showing not only sensitizing responses to the same stimulus regardless whether it is heat, 2APB, or other chemical ligands but also cross sensitization to stimuli of different nature, for example, the heat response is sensitized by camphor (10).
The sensitization property of TRPV3 may be important for the body’s response to skin sensitizers and allergens as well as inflammation. Here we show that sensitization of the TRPV3 channel involves an activity-dependent relief of Ca2+ block from both the cytoplasmic side via calmodulin (CaM) binding and the extracellular side through interaction at the pore. We identified a critical CaM-binding site at the N-terminus and an essential aspartic acid at the pore-loop that contribute to the sensitization of TRPV3.
Experimental Procedures
DNA constructs and mutagenesis
Murine TRPV3 cDNA in the pcDNA3 (Invitrogen, Carlsbad, CA) and pIRES2EGFP (Clontech, Palo Alto, CA) vectors were obtained as previously described (15). To change Asp641 to Asn, two oligonucleotides, 5′-ATGTTCAGGTTACCCAGGCCTATGGTGAG and 5′-GGCCTGGGTAACCTGAACATCCAGCAG were synthesized (Integrated DNA Technologies, Inc. Coralville, IA) and then paired with oligo 5′-TGTCCTCATCTGGGCCAC and the SP6 primer, respectively, in separate polymerase chain reactions (PCR) using the wild type TRPV3 as the template. All PCR conditions were standard as described before (22) using Pfu polymerase and an annealing temperature of 56°C. One of the PCR products was digested with BsrGI/BstEII and the other with BstEII/XbaI. The purified fragments were subcloned back to TRPV3/pcDNA3 opened with BsrGI/XbaI. To disrupt the N-terminal CaM-binding site, two oligonucleotides, 5′-TCTGAAGCTTCTGCCTGACTCTGTTCTTCC and 5′-GCAGAAGCTTCAGATGCAGAGGGCATCTTCGCGGC were paired with primers 5′-ATATCCATGGCCCACTCCAAGGATATG and 5′-CTACTTGGCAAATTTCTTC, respectively, for PCR as above and the products were digested with BglII/HindIII and HindIII/BspEI. The two fragments were then subcloned back to TRPV3/pIRES2EGFP opened with BglII/BspEI. Mutant clones were selected based on the creation of a BstEII site for D641N and a HindIII site for TRPV3RK- (R113QKKKRLKKR122 changed to SQAEASDAEG). The mutated sequences were confirmed by DNA sequencing performed at a sequencing facility at the Ohio State University. The D641N-RK- double mutant was created by subcloning the BglII/BspEI fragment from TRPV3RK- to D641N opened by the same pair of enzymes.
Cells and transfections
HEK293 cells were grown at 37°C, 5% CO2 in Dulbecco’s minimal essential medium containing 4.5 mg/ml glucose, 10% heat-inactivated fetal bovine serum, 50 units/ml penicillin, and 50 μg/ml streptomycin. Transfections were performed in wells of a 96-well plate using Lipofectamine 2000 as previously described (15). The pIRES2EGFP vector was used throughout for the bicistronic expression of TRPV3 (or one of its mutants) and the green fluorescence protein to facilitate the identification of transfected cells for patch clamp experiments. One day after transfection, cells were reseeded in 35 mm dishes at low densities and used within one or two days.
Intracellular Ca2+ measurement
HEK293 cells transiently transfected in wells of 96-well plates with TRPV3 in pcDNA3 vector or pcDNA3 alone were loaded with Fluo4 and assayed for 2APB-induced fluorescence changes using a fluorescence plate reader as described (15). To study internal Ca2+ release, the cells were washed three times in a Ca2+-free bath (omitting CaCl2 with the addition of 0.1 mM EGTA) and then assayed in the same bath.
Electrophysiological studies
Recording pipettes were pulled from micropipette glass (World Precision Instruments Inc, Sarasota, FL) and fire polished. The resistance was 2-4 MΩ when filled with an internal solution and placed in a bath solution listed in Table 1. Isolated cells were voltage-clamped in the whole-cell mode using an EPC9 amplifier (HEKA Instruments Inc, Southboro, MA). Voltage commands were made from the Pulse+Pulse Fit program (version 8.53, HEKA) and currents recorded at 5 kHz. Cells were held at 0 mV. Two protocols were used. The voltage ramp protocol was composed of repeated applications (at 2 Hz) of 100-ms ramps to +100 mV after a brief step to -100 mV for 20 ms. The step protocol was composed of 16 episodes of 300-ms step pulses with a 20-mV increment starting from -100 mV. Each step pulse was followed by a 250-ms step to -100 mV, giving rise to tail currents. Cells were continuously perfused with bath solution through a gravity-driven multi-outlet device with the desired outlet placed about 50 μm away from the cell being recorded. 2APB and other drugs were diluted in appropriate external solutions to the desired final concentrations and applied to the cell through perfusion. To ensure the dialysis of Ca2+ buffers and CaM antagonists, cells were equilibrated for >4 min after break-in before first stimulation was applied. All recordings were performed at the room temperature, 22-24°C.
Table 1.
Solutions used for whole-cell experiments
| Monovalent | Divalents | Ca2+ buffer | Glucose | pH |
|||
|---|---|---|---|---|---|---|---|
| buffer | value | adjusted by | |||||
| Internal solutions: | |||||||
| 1 EGTA | 140 CsCl | 0.6 MgCl2 | 1 Cs-EGTA | 10 Hepes | 7.2 | CsOH | |
| 10 EGTA | 108 CsCl | 0.6 MgCl2 | 10 Cs-EGTA | 10 Hepes | 7.2 | CsOH | |
| 1 BAPTA | 140 CsCl | 0.3 Mg-ATP | 1 K-BAPTA | 10 Hepes | 7.2 | CsOH | |
| 10 BAPTA | 108 CsCl | 0.6 MgCl2 | 10 Cs-BAPTA | 10 Hepes | 7.2 | CsOH | |
| 1.6 μM Ca2+ | 90 CsCl | 8.87 CaCl2/0.6 MgCl2 | 10 Cs-BAPTA | 10 Hepes | 7.2 | CsOH | |
| External solutions: | |||||||
| Normal | 145 NaCl | 2 CaCl2/1 MgCl2 | 10 | 10 Hepes | 7.4 | NaOH | |
| NMDG | 150 NMDG-Cl | 10 | 10 Hepes | 7.4 | NMDG+ | ||
| Ca2+-free | 145 NaCl | 1 MgCl2 | 0.1 Na-EGTA | 10 | 10 Hepes | 7.4 | NaOH |
| pCa >8 | 145 NaCl | 1 MgCl2 | 1 Na-EGTA | 10 | 10 Hepes | 7.4 | NaOH |
| 10-4 Ca2+ | 145 NaCl | 0.59 CaCl2/1 MgCl2 | 1 Na-EGTA | 10 | 10 Hepes | 7.4 | NaOH |
| 3×10⁻⁴ Ca2+ | 145 NaCl | 0.81 CaCl2/1 MgCl2 | 1 Na-EGTA | 10 | 10 Hepes | 7.4 | NaOH |
| 0.001 Ca2+ | 145 NaCl | 0.94 CaCl2/1 MgCl2 | 1 Na-EGTA | 10 | 10 Hepes | 7.4 | NaOH |
| 0.003 Ca2+ | 145 NaCl | 0.42 CaCl2/1 MgCl2 | 1 Na-HEDTA | 10 | 10 Hepes | 7.4 | NaOH |
| 0.01 Ca2+ | 145 NaCl | 0.72 CaCl2/1 MgCl2 | 1 Na-HEDTA | 10 | 10 Hepes | 7.4 | NaOH |
| 0.03 Ca2+ | 145 NaCl | 0.91 CaCl2/1 MgCl2 | 1 Na-HEDTA | 10 | 10 Hepes | 7.4 | NaOH |
| 0.1 Ca2+ | 145 NaCl | 0.1 CaCl2/1 MgCl2 | 10 | 10 Hepes | 7.4 | NaOH | |
| 0.3 Ca2+ | 145 NaCl | 0.3 CaCl2/1 MgCl2 | 10 | 10 Hepes | 7.4 | NaOH | |
| 1 Ca2+ | 145 NaCl | 1 CaCl2/1 MgCl2 | 10 | 10 Hepes | 7.4 | NaOH | |
| 3 Ca2+ | 145 NaCl | 3 CaCl2/1 MgCl2 | 10 | 10 Hepes | 7.4 | NaOH | |
| 10 Ca2+ | 133 NaCl | 10 CaCl2/1 MgCl2 | 10 | 10 Hepes | 7.4 | NaOH | |
| 30 Ca2+ | 103 NaCl | 30 CaCl2/1 MgCl2 | 10 | 10 Hepes | 7.4 | NaOH | |
All concentrations are in mM. Osmolarities of all solutions range from 288 to 305 mOsm/kg. For Ca2+-buffered external solutions, total Ca2+ concentrations were determined using the MaxChelator program (http://www.stanford.edu/~cpatton/maxc.html).
CaM binding assay
Constructs for TRPV3 fragments fused to the C-terminus of maltose-binding protein (MBP), in vitro synthesis of 35S-labeled MBP fusion proteins, and assay conditions for their binding to CaM were essentially the same as described previously (23,24). Briefly, segments of TRPV3 cDNA were generated by restriction digests or PCR. The encoded peptides were synthesized in vitro in the presence of [35S]methionine and then incubated with CaM-agarose in the absence or presence of 50 μM free Ca2+ buffered with 10 mM HEDTA. The amount of peptide retained by CaM-agarose was revealed by autoradiography after separation of the washed products by SDS-polyacrylamide gel electrophoresis.
Data analyses
Tail currents were normalized to the maximal current and fitted using a modified Boltzmann equation:
where the constants are explained in the result section. For current that did not reach steady state at the end of the step pulse, the steady-state current was estimated from the exponential fit of the recorded activation curve and then used to calculate the conductance.
Activation kinetics were fitted with one exponential:
where a is the peak current amplitude and τact is the activation time constant.
Dose dependence of extracellular Ca2+-mediated inhibition was fitted with the two-site formula:
where fH is the fraction of the high affinity state, kH and kL are IC50 values of the high and low affinity state, respectively.
Statistical analyses were performed by Student’s t test using Microcal Origin. p < 0.05 is considered statistically significant. Summary data are expressed as means ± SEM.
Chemicals
2APB was from Cayman Chemical Co (Ann Arbor, MI). TNT coupled rabbit reticulocyte system was from Promega (Madison, WI). BAPTA, EGTA, HEDTA, W-7, calmidazolium, and ophiobolin A were from Sigma-Aldrich (St. Louis, MO). Fluo4-AM, thapsigargin, Lipofectamine 2000 and all cell culture medium and reagents were from Invitrogen.
Results
1. Sensitization to repetitive stimulations results from the relief of cytoplasmic Ca2+-mediated inhibition on the voltage dependence of TRPV3 activation
Repeated temperature challenges and 2APB applications are both well known to cause sensitization of the native channel in skin keratinocytes and ectopically expressed TRPV3 in HEK293 cells (14,17). We noticed a strong effect of intracellular Ca2+ buffering on the current development of TRPV3 expressed in HEK293 cells both at the level of maximal current density and the process of sensitization to repetitive applications of 2APB. Figs. 1A and 1B show that under whole-cell conditions, a continued application of 100 μM 2APB activated TRPV3 expressed in HEK293 cells very slowly. The currents recorded by voltage ramps show double rectifications at both negative and positive potentials and a reversal potential at 0 mV. The inward currents at negative potential were completely abolished and the reversal potential shifted to < -70 mV by replacing cations in the extracellular solution with N-methyl-D-glucamine (NMDG+), indicative of cation conductance. Interestingly, following a transient upshot upon switching to the NMDG+ solution, which is due to the removal of external Ca2+ (see later Fig. 8A), the currents at positive potentials were also largely blocked by NMDG+ and the reversal potential returned to near 0 mV, suggesting that NMDG+ may be able to enter and plug the TRPV3 pore.
Figure 1. Effect of intracellular Ca2+ buffering strength on the activation of TRPV3 by 2APB.

TRPV3-transfected HEK293 cells were held in whole cell mode at 0 mV with pipette solution containing either 10 mM BAPTA (A) or 1 mM EGTA (B). Voltage ramps were applied from -100 to +100 mV in 100 ms after a 20-ms step pulse to -100 mV every 0.5 s. 2APB (100 μM) was applied continuously as indicated by the bars above the current traces, which represent current development at -100 mV (below dashed lines) and +100 mV (above dashed lines). Dashed lines show zero current. Insets show current-voltage (I-V) relationships obtained from the voltage ramp at the time points indicated in the current traces. C and D show summary data (n = 5 for EGTA, n=16 for BAPTA) of current densities at 100 sec after 2APB application (C) and time constants (τact) obtained from exponential fits (D) of current developed at -100 and +100 mV using pipettes that contained either 1 mM EGTA (open bars) or 10 mM BAPTA (filled bars). Note, logarithmic scale is used in D to accommodate the large difference between data values. * p < 0.05, † p < 0.001, different from EGTA.
Figure 8. Activation of TRPV3 in Ca2+-free bath solution.

A, removal of extracellular Ca2+ strongly increased the 2APB-evoked currents. The pipette solution contained 10 mM BAPTA. A TRPV3 expressing cell was stimulated with 2APB in the normal bath (2 mM Ca2+) while the solution was switched to a Ca2+-free bath containing 0.1 mM EGTA and the same concentration of 2APB. Note the sudden increase of the current size at both the positive (+100 mV) and negative (-100 mV) potentials and linear I-V (right plot) upon Ca2+ removal and the quick reinhibition when extracellular Ca2+ was reintroduced. B and C, response of TRPV3 to repetitive 2APB applications in the Ca2+-free bath. The pipette solution contained either 10 mM BAPTA (B) or 1 mM EGTA (C). D and E, summary data for peak current densities at +100 (filled symbols) and -100 mV (open symbols) for repetitive 2APB stimulations with pipette solutions that contained 10 mM BAPTA (circles), 1 mM EGTA (triangles), or 10 mM BAPTA with free Ca2+ buffered at 1.6 μM (E) supplemented (squares) or not (diamonds) with 20 μM ophiobolin A. F, 2APB-evoked [Ca2+]i changes in HEK293 cells that expressed TRPV3 (black) or the vector control (gray). Cells were loaded with fluo4 20 hrs post transfection, washed with either normal or the Ca2+-free bath, and then stimulated with 166 μM 2APB in the corresponding solutions. Note the significant fluorescence increase in the Ca2+-free bath and the lack of response in the control.
Currents developed faster and reached higher amplitudes when intracellular Ca2+ was buffered by 10 mM BAPTA (Fig. 1A) than by 1 mM EGTA (Fig. 1B, also see summary in Figs. 1C and 1D). The current plateau was achieved with the BAPTA internal solution after about 6 min stimulation by 2APB but was not reached with the EGTA solution even after more than 10 min.
Sensitization occurred when 2APB was applied repeatedly with short (∼30 sec) intervals as illustrated in Figs. 2A and 2B, but not when it was applied 30 sec twice with a 10 min interval (Fig. 2C). The latter example indicates that sensitization is not due to the loss of cellular content or other changes during the long period of whole-cell dialysis. With the EGTA-buffered internal solution, the first few responses were very small and sometimes undetectable. Sensitization occurred slowly and did not reach the maximum until the cells were repeatedly stimulated for more than 17 times (Figs. 2B and 2D). By contrast, with 10 mM BAPTA in the internal Ca2+ buffer, the initial responses were larger than with 1 mM EGTA and the response approached the maximum after about 6 stimulations (Figs. 2A and 2D). Because of the very low initial response, the extent of sensitization was more prominent with EGTA-buffered than with BAPTA-buffered internal solution. The rate of sensitization, however, was slower with EGTA than with BAPTA.
Figure 2. Effect of intracellular Ca2+ buffering strength on sensitization of TRPV3 to repetitive 2APB stimulations.

A and B, similar to Fig. 1 but 2APB was applied repetitively with short intervals. The pipette contained 10 mM BAPTA (A) or 1 mM EGTA (B). C, two consecutive 2APB stimulations were spaced with a 10-min interval when the cell was held continuously at 0 mV. The pipette contained 1 mM EGTA. D, peak current densities developed at -100 (open symbols) and +100 mV (filled symbols) for repetitive 2APB stimulations with pipette solutions that contained 10 mM BAPTA (circles), 10 mM EGTA (squares) and 1 mM EGTA (triangles). n = 6-9. E, simulation of Ca2+ diffusion from the source in solutions that contain 1 and 10 mM EGTA or 10 mM BAPTA. The diffusion coefficient for Ca2+ (0.22 μm2/msec), dissociation constants for Ca2+/EGTA (1.8 × 10⁻⁷ fmole/μm3) and Ca2+/BAPTA (2.2 × 10⁻⁷ fmole/μm3), on rates for Ca2+ binding to EGTA (2.5 × 103 μm3/fmole.msec) and to BAPTA (4 × 105 μm3/fmole.msec) were adopted from Naraghi and Neher (26). The initial [Ca2+] at the source of generation, e.g. inner mouth of the pore, is arbitrarily assigned to 1 mM. F, fast deactivation detected during the 20-ms step pulse from 0 to -100 mV in the EGTA (gray) and BAPTA (black) buffered internal solutions. Representative traces at the peak of 2APB-evoked response from two fully sensitized cells were scaled to show the difference in the rate of deactivation.
Despite having similar affinities, EGTA binds to Ca2+ about 100-1,000 times more slowly than BAPTA (25,26) and thus allows Ca2+ to rise longer and diffuse further. Fig. 2E shows a simulation of Ca2+ diffusion in the BAPTA and EGTA internal solutions using the PORE program (Kenton, J. http://www.physio.unr.edu/faculty/kenyon/Pore/default.htm). The free Ca2+ concentration in 10 mM BAPTA dissipates to less than 0.1% of the initial concentration at the source (e.g. 1 mM) within a distance of 10 nm whereas in 1 mM EGTA, this distance is more than 33 nm. The simulation also revealed that the diffusion patterns are rather similar between 1 mM and 10 mM EGTA. Consistently, the patterns of sensitization of TRPV3 to repeated 2APB stimulations are also very similar between the two EGTA solutions (Fig. 2D).
According to the above simulation, intracellular Ca2+ concentration ([Ca2+]i) increases, which occur as a result of TRPV3 activation, should be more pronounced and longer lasted in the EGTA than in the BAPTA internal solution. Therefore, the results in Figs. 1 and 2 suggest that Ca2+ rise at the cytoplasmic side is inhibitory to TRPV3 activity. This intracellular Ca2+-dependent inhibition appears to be strong during the initial stimulations and is gradually relieved after repeated channel activation. Consistent with this interpretation, when free Ca2+ concentration in the 10 mM BAPTA internal solution was increased to ∼1.6 μM, the initial responses of TRPV3 to 2APB also became small and the rate of sensitization was slowed (see Fig. 4A). Furthermore, the inward current, which mediates Ca2+ entry and hence contributes to cytoplasmic Ca2+ fluctuations, deactivated more in the EGTA than in the BAPTA solution as revealed by the voltage step from 0 mV to -100 mV (Fig. 2F).
Figure 4. The intracellular Ca2+ effect is mediated by CaM.
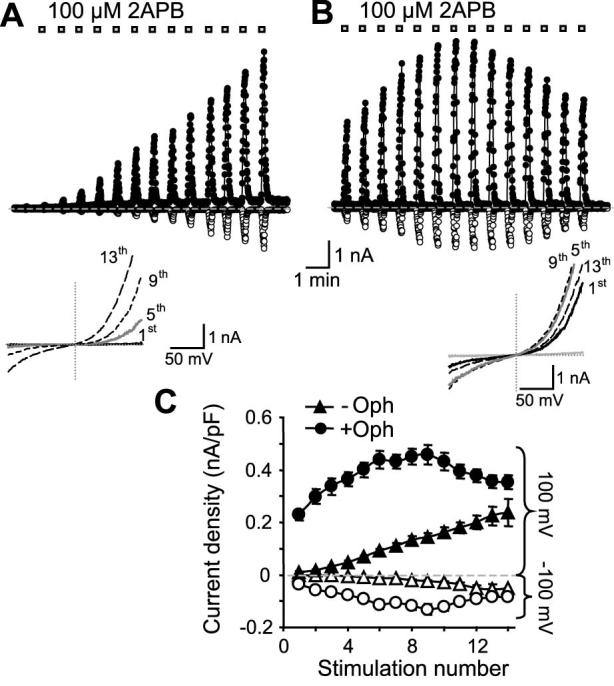
A, similar to Fig. 2A, TRPV3-expressing cells were repetitively stimulated with 2APB but the pipette solution contained 10 mM BAPTA with free Ca2+ buffered to ∼1.6 μM without (A) or with a CaM antagonist ophiobolin A (20 μM) (B). C, summary of peak current densities obtained at -100 and +100 mV for individual responses with (circles, n=11) or without ophiobolin A (Oph, triangles, n=5).
For some thermoTRPs, e.g. TRPV1 and TRPM8, changes in voltage dependence may underlie the main mechanism of channel activation in response to temperature changes as well as chemical ligands (27,28). The 2APB-evoked TRPV3 activity also displayed voltage dependence (14). In order to examine the voltage dependence of the TRPV3 channel during repetitive stimulations by 2APB, we measured the currents at -100 mV immediately following voltage steps (300 ms) to different potentials from -100 to +200 mV with a 20-mV increment. This series of “tail” currents reflect the relative open probability of the channel at the potential before stepping to -100 mV. Plotting these open probabilities as a function of membrane potentials applied through the pre-step pulses gives rise to conductance-voltage (G-V) relationships that can be fitted by a modified Boltzmann equation with constants describing the potential for half-maximal channel activation (V1/2), voltage-dependent fraction (VDF, a) and voltage-independent fraction (b) of the total activity, and the slope factor s = RT/zF with z being the valence of the gating charge.
As shown in Fig. 3, TRPV3-expressing cells were repeatedly stimulated with 2APB. The step protocol was used for the 1st, 10th, 17th, 24th, 31st, and 38th stimulations while voltage ramps were used to record the currents during other stimulations. The pipette solution contained either 1 mM EGTA (Fig. 3A) or 10 mM BAPTA (Fig. 3B). With repetitive stimulations, the G-V curves shifted gradually to the left (Fig. 3C). This shift was larger but also occurred more slowly with the EGTA than with the BAPTA internal solution. The V1/2 in the EGTA solution decreased nearly 100 mV from 144 ± 12 mV during the 1st stimulation to 47 ± 11 mV in the 24th stimulation and stabilized afterwards. By comparison, the V1/2 in the BAPTA solution decreased from 77 ± 14 to 13 ± 4 mV after 24 stimulations and the voltage dependence stabilized after about 10 stimulations (Fig. 3D, top). With the EGTA internal solution, nearly all activities were voltage-dependent. A small fraction (< 3%) of voltage-independent activity only appeared after 20 repetitive stimulations (Fig. 3D, lower). By contrast, the voltage-independent activity was more pronounced with the BAPTA solution, reaching 12 ± 5 % at the 24th stimulation. The valence of the gating charge, however, was not changed with both internal solutions (Fig. 3D, middle).
Figure 3. Changes in the voltage dependence of TRPV3 during repetitive stimulations.

A, a TRPV3-expressing cells was voltage-clamped using the 1 mM EGTA internal solution and repetitively stimulated with 100 μM 2APB. Currents were recorded by voltage ramps as in Fig. 1. A step protocol was applied intermittently as indicated. Top traces show currents at -100 mV (open circles) and +100 mV (filled circles) obtained from voltage ramps. The up and down deflections from the dashed line (zero current) represent the response to a brief (∼12 s) stimulation of 2APB. Lower traces are currents obtained from the step protocol with those from -100, 0, 100, 200 mV highlighted in black. B, a similar experiment as in A, but the pipette solution contained 10 mM BAPTA. C and D, tail currents from the step protocol were normalized and plotted as a function of the prepulse potentials, showing conductance-voltage (G-V) relationships. In the first and 10th stimulations, some currents did not reach steady state during step pulses (e.g. see representative traces in A). For them, steady-state currents were projected by fitting the entire current trace with an exponential function and then used to determine the conductance at each pulse potential. The conductance values were then normalized. Note, a more pronounced left-shift is evident with 1 mM EGTA (upper) than with 10 mM BAPTA (lower) in the internal solution (C). The continued lines represent fits to the Boltzmann equation, which give rise to V1/2, z (the valence of the gating charge), and voltage-dependent fraction (VDF) of the total activity. These values are plotted as a function of the stimulation number (D). n = 3-12 cells. * p < 0.05, ** p < 0.01, *** p < 0.001 different from BAPTA; # p < 0.05, ## p < 0.01, ### p < 0.01 different from the first stimulation.
Consistent with the changes in voltage dependence, the step protocol also revealed a steady increase in kinetics of current development at positive potentials and a gradual increase of the instantaneous currents at negative potentials during repetitive stimulations by 2APB (Figs. 3A and 3B). Compared with the BAPTA solution, these changes are more pronounced with the EGTA internal solution because of the very slow current development at positive potentials and nearly undetectable inward currents at negative potentials during the initial stimulation by 2APB. The above results demonstrate that cytoplasmic Ca2+ fluctuations inhibit TRPV3 by maintaining the voltage dependence of channel activation at more positive potentials and this inhibition is gradually decreased during repetitive stimulations.
2. An N-terminal CaM-binding site is responsible for the cytoplasmic Ca2+-mediated inhibition
CaM has been shown to mediate intracellular Ca2+-dependent regulations of many TRP channels (29). To examine whether CaM plays a role in the intracellular Ca2+-induced inhibition, we included a CaM antagonist, ophiobolin A, in the pipette solution that contained ∼1.6 μM free Ca2+ buffered by 10 mM BAPTA. The micromolar free Ca2+ was included to facilitate the inhibitory action of ophiobolin A on CaM. As described already, the responses to repetitive 2APB applications with this pipette solution were weak at the beginning and sensitized gradually in subsequent stimulations (Fig. 4A). By contrast, the inclusion of 20 μM ophiobolin A significantly enhanced the initial responses and the sensitization was greatly reduced, with many cells showing desensitization after 6-9 2APB applications (Figs. 4B and 4C). Similar results were obtained with W-7 (100 μM) and, to a lesser extent, calmidazolium (10 μM) (data not shown). These results demonstrate that CaM is indeed involved in the sensitization of TRPV3 to repetitive stimulations by mediating Ca2+-dependent initial channel inhibition.
We have screened the murine TRPV3 sequence for CaM-binding sites using in vitro binding assays. Segments of TRPV3 were labeled with [35S]methionine and tested for binding to CaM-agarose in the absence or presence of 50 μM free Ca2+. These assays revealed multiple potential CaM-binding sites at the cytoplasmic N- and C-termini of TRPV3 (Figs. 5A and 5B). We have mapped out an N-terminal site (TRPV3l, A108-G130) that shows the strongest binding in the presence of Ca2+. Mutations of all positively charged residues to neutral and negatively charged ones within this sequence (R113QKKKRLKKR122 to SQAEASDAEG) abolished the binding to CaM (Fig. 5C).
Figure 5. Identification of a CaM-binding site from the N-terminus of TRPV3.

A, diagram of murine TRPV3 and maltose-binding protein (MBP)-TRPV3 fusion proteins tested. Fragments of TRPV3 were prepared as MBP-fusion proteins and tested for binding to CaM in the presence of 50 μM Ca2+. The fusion proteins were designated as a, b, c, etc. and their positions in the full-length TRPV3 are indicated in parentheses. Black, gray, and open bars represent positive, weakly positive, and negative binding to CaM, respectively. The borders of the identified N-terminal CaM-binding site are shown by dashed lines. Gray bars in the full-length TRPV3 indicate transmembrane segments and the pore loop. B, representative binding results showing the sizes and the amounts of 35S-labeled MBP-TRPV3 fusion proteins added to the binding reactions (upper graph) and the amounts of the fusion proteins retained by CaM-agarose in the presence of 50 μM Ca2+ (lower graph). MBP was included alone as a negative control (lane 1). C, R113QKKKRLKKR122 was mutated to SQAEASDAEG as described in Materials and Methods. The mutated l fragment was fused to MBP and tested for binding to CaM under the same condition as in B. The graphs show that the mutant (RK-) does not bind to CaM.
In order to examine the function of the N-terminal CaM-binding site, the above amino acid substitutions were introduced to the full-length TRPV3 for a CaM-binding deficient mutant, designated as TRPV3RK-. Upon expression in HEK293 cells, the TRPV3RK- mutant gave rise to a channel that showed very little sensitization to repetitive stimulations by 2APB (Fig. 6A). The step protocol revealed that the G-V curves shifted slight to the left (<20 mV after 24 stimulations) but the changes in V1/2 were not statistically significant (Figs. 6B and 6C). More importantly, there was no significant difference in the V1/2 values between the EGTA- and BAPTA-buffered internal solutions at all times during the repetitive stimulations, demonstrating that the mutated site is responsible for the initial inhibitory effect of cytoplasmic Ca2+ on TRPV3 activation and for maintaining the voltage dependence at very positive potentials.
Figure 6. Voltage dependence of TRPV3RK- mutant in response to repetitive 2APB stimulations.

A, a representative experiment performed as in Fig. 3A except that the cell expressed TRPV3RK-. B and C, G-V relationships for TRPV3RK- were obtained from tail currents as in Figs. 3C and 3D. No significant change was found between the EGTA and BAPTA internal solutions except for some small changes in VDF. * p < 0.05 different from BAPTA; # p < 0.05 different from the first stimulation. D and E, peak current densities (D) and τact (E) at -100 and +100 mV elicited by the first (left panels) and 23rd (right panels) applications of 100 μM 2APB to HEK293 cells that expressed TRPV3RK- (RK-). Data obtained from wild type TRPV3 (WT) for the 23rd stimulation are included for comparison. The internal solution contained either 1 mM EGTA (open bars) or 10 mM BAPTA (filled bars). Currents were recorded using the voltage ramp protocol. τact was obtained by fitting the data points from 0.5 to 12 sec (or the time at the peak current) following 2APB application. n = 5-11 cells. * p < 0.01 different from WT/EGTA, † p < 0.05 different from WT/BAPTA.
In agreement with the above conclusion, the peak current densities of TRPV3RK- were similar between the EGTA and BAPTA solutions and they did not increase significantly in subsequent stimulations (Fig. 6D). The time constants of current activation (τact) at -100 and +100 mV in response to the first and later (23rd) 2APB applications were not different between EGTA and BAPTA internal solutions, but they were reduced in later responses as compared to the first response (Fig. 6E), suggesting that additional sensitization mechanism independent of cytoplasmic Ca2+ and CaM binding to the N-terminal site may also exist. Nonetheless, the mutant channel had consistently lower τact than the wild type under all conditions and the wild type TRPV3 displayed slower activation kinetics with the EGTA than with the BAPTA solution both at the beginning and in the later stimulations (compare Figs. 1D and 6E right), indicating that Ca2+-CaM binding at the N-terminal site is a major contributor, if not the only one, to channel sensitization to repetitive stimulations.
3. Extracellular Ca2+ inhibits TRPV3 with two affinity states
Interestingly, not all Ca2+-dependent regulations were affected by the mutation. The fast deactivation, occurring in milliseconds at negative potentials as exemplified in Fig. 2F, remained intact in the TRPV3RK- mutant (Fig. 7). The mutant also showed a double rectifying I-V relationship and time-dependent activation of outward currents at positive potentials and deactivation of inward currents at negative potentials (Fig. 6A).
Figure 7. Fast inactivation of the wild-type TRPV3 and the RK- mutant.
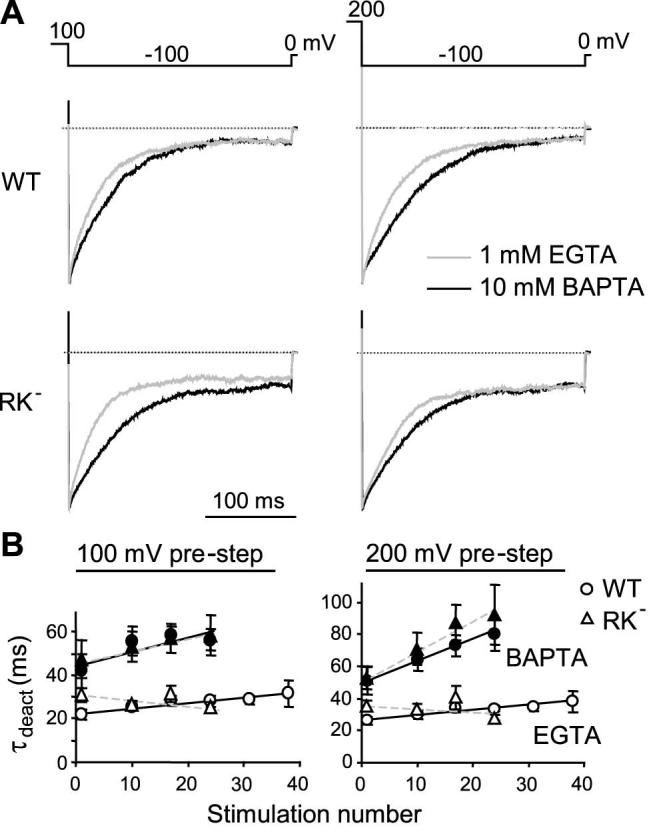
Data were collected from the same experiments shown in Figs. 3 and 6. A, tail currents at -100 mV after pre-steps to +100 (left panels) and +200 mV (right panels) were scaled to the peak current for cells infused with 1 mM EGTA (gray lines) or 10 mM BAPTA (black lines). Shown are representative results for the wild-type (WT, upper) and the mutant (RK-, lower). B, deactivation kinetics were fitted with the equation: It = y0 + a*(1-exp(-t/τinact)), where y0 is the peak current, a is the maximal deactivation and τinact is the deactivation time constant. Shown are summary data of τinact at -100 mV following pre-steps to +100 (left) and +200 mV (right) during repetitive stimulations. Open and filled symbols are data for the EGTA and BAPTA internal solutions, respectively. No significant difference is found between WT (circles) and RK- (triangles).
For both the wild type and TRPV3RK- (not shown), 2APB-evoked currents were greatly increased by the removal of extracellular Ca2+ with a Ca2+-free bath containing 0.1 mM EGTA (Fig. 8A). There was essentially no delay for the current increase and the re-blockage after returning to the Ca2+-containing bath was also instantaneous. More importantly, the channel lost the rectification in the Ca2+-free bath, displaying a linear I-V relationship. Interestingly, in the Ca2+-free bath the strength of internal Ca2+ buffer still had a strong effect on the initial responses of wild type TRPV3, with the currents being much smaller in EGTA than in BAPTA solution. Sensitization to repetitive 2APB stimulations was nearly abolished with 10 mM BAPTA but still persisted with 1 mM EGTA or the 10 mM BAPTA solution with Ca2+ buffered to ∼1.6 μM (Figs. 8B-8E). Again, the sensitization was blocked by ophiobolin A (Fig. 8E) and was not detected for TRPV3RK- under all conditions with the Ca2+-free bath (not shown).
To explain why in the Ca2+-free bath, Ca2+-CaM still caused the initial inhibition of TRPV3, we tested the possibility that some expressed TRPV3 channels might reside on intracellular membrane and cause Ca2+ release from internal stores in response to 2APB. A similar scenario is well-known for both heterologously as well as endogenously expressed TRPV1 channels, to which capsaicin induces [Ca2+]i rise in the absence of any Ca2+ influx (30,31). As shown in Fig. 8F, this is indeed true for TRPV3. In fluo4-loaded cells that expressed TRPV3, 2APB caused [Ca2+]i increases both in the presence and absence of extracellular Ca2+. The smaller [Ca2+]i increase in the Ca2+-free solution than in 2 mM Ca2+ was expected as in the latter case, significant portion of cytosolic Ca2+ should have come from Ca2+ influx from extracellular space.
The specific Ca2+ store involved in Ca2+ release mediated by the intracellularly localized TRPV1 has been shown to be insensitive to thapsigargin, an inhibitor of endoplasmic reticulum Ca2+-ATPases. In addition, the store was efficiently refilled in the continued presence of thapsigargin and absence of Ca2+ entry (30). This may be similar for TRPV3 as treatment with thapsigargin (1 μM) did not prevent the initial inhibition of TRPV3 activation. The response to the first 2APB application was even smaller for thapsigargin-treated than for untreated cells (current density at 100 mV was 24.8 ± 6.0 pA/pF with thapsigargin and 79.8 ± 4.8 pA/pF without thapsigargin treatment, p = 0.004, n = 5-6), which may be attributed to the additional Ca2+ increase resulting from Ca2+ leakage from thapsigargin-sensitive stores. Moreover, the finding that 2APB-induced [Ca2+]i increase in the Ca2+-free bath did not dissipate with time (Fig. 8F) also agrees with the conclusion reached for the intracellularly localized TRPV1 that the store is efficiently refilled in the absence of Ca2+ entry (30).
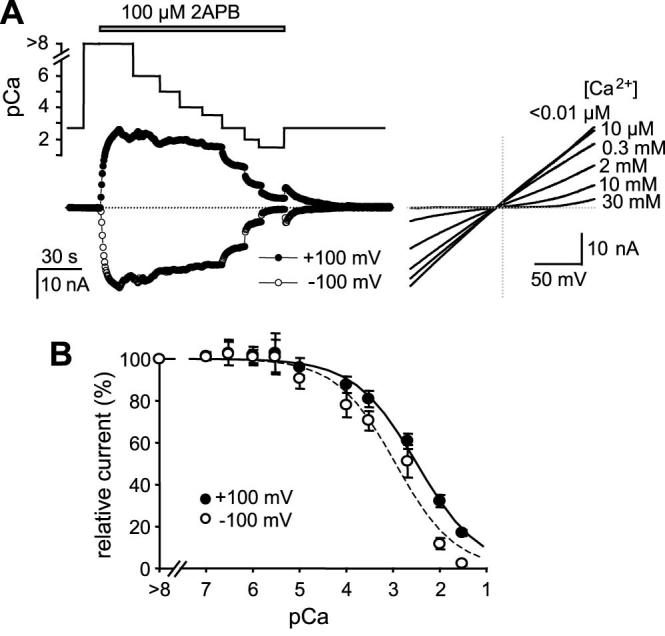
While the intracellular Ca2+ buffer effect can be explained by Ca2+-CaM binding at the cytoplasmic side, the extracellular Ca2+ effect is most likely a direct action of the ion on the channel. To examine the inhibition by extracellular Ca2+, the TRPV3-expressing cells were exposed to solutions containing different free Ca2+ concentrations after applying 2APB in the Ca2+-free bath. In order to learn how the extracellular Ca2+ block changes during repetitive stimulations, these treatments were repeated several times for the same cell as exemplified in Fig. 9A. Selected I-V curves obtained from voltage ramps are shown in Fig. 9B to highlight changes in rectification behavior of the channel. Fig. 9C shows the summary of these experiments. For both the inward and outward currents at -100 and +100 mV, respectively, the dose-dependent inhibition by extracellular Ca2+ extends over a broad concentration range of more than four orders of magnitude. These data points were best fitted with a two-site formula, indicative of two affinity states: a higher one in low micromolar ranges and a lower one in millimolars. More interestingly, a right shift in the high affinity state was observed with the repetitive stimulations. The IC50 values increased from 1.42 ± 0.26 and 1.50 ± 0.21 μM to 9.0 ± 1.2, and 8.0 ± 1.1 μM at -100 and +100 mV, respectively (Fig. 9D). The proportions of the high affinity state were also decreased (Fig. 9E). Therefore, extracellular Ca2+ blocks the TRPV3 channel with two affinity states. The high affinity state, displaying IC50 values in low micromolar ranges, appears to contribute to the sensitization of TRPV3 to repetitive stimulations by decreasing its affinity and lowering its overall involvement in the total inhibition.
Figure 9. Inhibitory effect of extracellular Ca2+ on TRPV3 channel activity.

A, changes in extracellular Ca2+-dependent inhibition during repetitive stimulations. Upper panel shows changes in Ca2+ concentrations in perfusates during six successive applications of 100 μM 2APB as indicated. Traces below show currents at -100 (open circles) and +100 mV (filled circles) recorded using voltage ramps. The internal solution contained 1 mM BAPTA (see Table 1). B, I-V curves obtained at indicated external Ca2+ concentrations during the first, third and sixth 2APB applications for the same representative cell shown in A. C, summary of dose-dependent inhibition of TRPV3 current by external Ca2+ during six consecutive stimulations. Currents at +100 mV (upper) and -100 mV (lower) are normalized to that obtained in the Ca2+-free solution for each stimulation. n = 4-17 cells. Solid lines are fits to a two-site formula as described in Experimental Procedures. A right shift in the dose response curves in response to successive stimulations is detected at both potentials. D, the IC50 value of the high affinity state is gradually increased due to successive stimulations. E, the fraction of the high affinity state is decreased. Note: the IC50 values of the low affinity state have big errors because of the limited data points and large measurement errors at higher Ca2+ concentrations resulting from the very low current amplitudes. The mean values ranged from 0.6 to 2.1 mM, but no clear trend is detected with successive stimulations.
4. Asp641 at the pore-loop is involved in the high affinity inhibition of TRPV3 by extracellular Ca2+
An aspartate residue at the pore-loop, Asp641, has been implicated in the inhibition of TRPV3 by divalent cations. Neutralization of Asp641 to asparagine (D641N) decreased the divalent cation-mediated inhibition and accelerated the transition of TRPV3 conductance from a stimulation-dependent phase (I1) to a stimulation-independent one (I2) (32). To examine the role of Asp641 in the extracellular Ca2+-mediated inhibition, increasing Ca2+ concentrations were introduced in the presence of 100 μM 2APB to D641N-expressing cells after stimulation was initiated in the Ca2+-free bath solution (Figs. 10A). No significant inhibition was observed at <10 μM Ca2+ for currents at -100 and +100 mV, indicating that the high affinity Ca2+ inhibition was completely eliminated by the single amino acid substitution. The low affinity Ca2+ inhibition, however, remains in the D641N mutant, giving IC50 values of 1.12 ± 0.25 and 3.21 ± 0.32 mM for -100 and +100 mV, respectively (Fig. 10B). Thus, Asp641 of TRPV3 is involved in the high affinity, but not the low affinity, inhibition by extracellular Ca2+.
Figure 10. Effect of extracellular Ca2+ on the activity of TRPV3D641N mutant.
Asp641 at the pore loop of murine TRPV3 was changed to Asn and the mutant was expressed in HEK293 cells for whole-cell experiments. Similar to Fig. 9 except that D641N was used and only the first stimulation is shown. For many cells, the seal did not last for more than one stimulation and for others, the second and later responses displayed pronounced desensitization. A, representative result. The inset to the left shows I-V curves at selected Ca2+ concentrations. Note: low concentrations of Ca2+ did not inhibit and rectification of I-V only appeared at >2 mM Ca2+. C, summary data show that the dose-response curves only have one (the lower) affinity state.
Similar to the wild type channel, D641N still displayed sensitization in response to repeated challenges with 2APB, especially when the EGTA internal solution was used (compare Figs. 11A and 11B). However, despite the presence of 2 mM Ca2+ in the bath, the current densities and changes of I-V relationships during the process of sensitization were similar to the wild type TRPV3 under the Ca2+-free condition, consistent with the idea that Asp641 at the pore-loop is a major site for extracellular Ca2+ block. For the first 2APB response, the current densities at +100 and -100 mV are significantly lower (Fig. 11E) and the kinetics of current development are significantly slower (Figs. 11C and 11F) with the EGTA than with the BAPTA internal solution. However, when combined with the RK- mutation at the N-terminal CaM-binding site, the D641N-RK- double mutant no longer displayed any significant difference between the EGTA and BAPTA internal solutions in terms of activation kinetics and current densities in response to the first 2APB stimulation (Figs. 11D-11F). The I-V relationship of the double mutant was linear. In step protocols, there was no time-dependent activation and deactivation at all potentials. The G-V curves revealed that there was very little voltage dependence (∼11%) regardless whether EGTA or BAPTA was used to buffer the internal Ca2+ (Fig. 11G). This state is typical for wild type TRPV3 stimulated with 2APB for > 4 times in the Ca2+-free bath and internal Ca2+ buffered by 10 mM BAPTA and for D641N under the similar condition but with 2 mM Ca2+ in the bath. Therefore, the double mutant represents the fully sensitized channel, which has lost most of its voltage dependence along with the Ca2+-mediated inhibition at the pore loop and the N-terminal CaM-binding site.
Figure 11. Effect of intracellular Ca2+-CaM binding on the activation of D641N mutant.

A and B, effect of intracellular Ca2+-buffering strength on sensitization of D641N. Internal solution contained either 10 mM BAPTA (A) or 1 mM EGTA (B). Similar to the wild type (Figs. 2A and 2B), voltage ramps revealed that currents developed more slowly and sensitization was more prominent with EGTA than with BAPTA internal solution. C, comparison of activation kinetics in response to the first 2APB (100 μM) application between BAPTA (black circles) and EGTA (gray triangles) buffered cells that expressed D641N. Currents at -100 (open symbols) and +100 mV (filled symbols) obtained from the voltage ramp protocol are scaled to highlight the kinetic difference. In the EGTA-buffered cell, 2APB was applied longer as indicated by the bar on the top to allow currents to peak. Note desensitization before 2APB washout in the BAPTA-buffered cell. D-G, agonist-evoked activation of D641N-RK- double mutant. D, similar to C except the double mutant was used. E and F, current densities (E) and activation time constants (F) at -100 and +100 mV elicited by the first 2APB application to cells that expressed D641N (open bars) or the double mutant (filled bars). Voltage ramps were used. The internal solution contained either 1 mM EGTA or 10 mM BAPTA as indicated. The current density represents the maximum within 12 sec of the stimulation and τact was obtained by fitting the data points from 0.5 to 12 sec (or the time at the peak current) following 2APB application. n = 9-13 cells. * p < 0.05, ** p < 0.001. G, the step protocol was used to compare the voltage dependence of the double mutant in EGTA (open symbols) and BAPTA (filled symbols) internal solutions. Shown are representative traces (left) and the instantaneous (I1, left panel) and steady-state (I300, left panel) I-V, which are currents at the beginning (1 ms) and the end (300 ms) of the voltage steps, as well as the G-V relationship (right).
Discussion
Sensitization to repeated heat challenges was one of the unique features discovered for the TRPV3 channel when the cDNA was first cloned and expressed (17,18). This phenomenon has been confirmed for the native TRPV3 expressed in mouse skin keratinocytes (8;10). With the recent identification of chemical TRPV3 ligands, sensitization to repetitive stimulations was also recapitulated in the activation of TRPV3 by all ligands, including 2APB, diphenylboronic anhydride, camphor, carvacrol, thymol, ethyl vanillin, and eugenol (9,10,14,32), indicating that the sensitization is a common property that governs the activation process of this TRP channel. As new evidence for the involvement of TRP channels in chemesthesis is mounting, it is highly likely that the sensitization property of the TRPV3 channel may underlie the mechanism of enhanced oral and nasal sensitivities to the successive exposures of certain odors, flavors, and irritants (33,34). For irritants, it is not uncommon to experience increased irritation upon repeated presentations of the stimuli. These responses also tend to have a slow onset, just like the slow activation of TRPV3. In psychophysical studies, brief exposures and short intervals (∼1 min) are also used to induce sensitization to irritants. These correlations, together with the high level expression of TRPV3 protein in oral and nasal epithelia (9), suggest that TRPV3 may play a central role in chemesthesis of not only food flavors but also irritants in the mouth and nose. In addition, TRPV3 is highly expressed in skin keratinocytes and is activated by allergens and skin sensitizers (9), to which enhanced responses upon repeated challenges are common as well. The more recent finding that constitutively active TRPV3 mutations cause hair loss and dermatitis-like skin diseases further illustrates the importance of properly tuned TRPV3 function in the overall health of the skin tissue (11,12). Thus, understanding the mechanism of sensitization of TRPV3 to repetitive stimulations will likely shed light on how the first defense system of our body sorts and learns different substances, as well as temperature changes, in the environment and try to distinguish beneficial resources (nutritious food as well as warm and cozy temperatures) from harmful matters.
Our data show that Ca2+ plays a central role in the sensitization of TRPV3 to repeated stimulations. Ca2+ inhibits channel from both the intracellular side and the extracellular side of the plasma membrane, causing slow activation at positive potential and strong deactivation at negative potentials. The sensitized channels are less inhibited than the naïve (non-sensitized) ones, displaying faster activation at positive potentials and less deactivation at negative potentials. This gradual shift in Ca2+-dependent regulations suggests a conformation change in response to successive stimulation challenges. Our data demonstrate that residue Asp641 at the pore-loop is involved in the high affinity inhibition of the channel by extracellular Ca2+. Most likely, the Asp residues are directly involved in binding to Ca2+ ions that enter the pore. This is consistent with the notion that conversed acidic residues at the equivalent position of rat TRPV1 (Asp646) and mouse TRPV4 (Asp682) also play an important role in binding to divalent cations. Thus, neutralization of the aspartate had profound effects on ruthenium red sensitivity, divalent cation permeability, Ca2+ inhibition, and rectification behaviors of the channels (32,35,36). Not surprisingly, the D641N mutant of TRPV3 lacks the high affinity extracellular Ca2+ inhibition, giving rise to much higher current densities than the wild type with the increase being more pronounced at negative than at positive potentials (12 fold at -100 mV and 3.5 fold at +100 mV over the wild type for the first stimulation in the BAPTA internal solution; compare Figs. 1C and 11E). More importantly, the IC50 values for the high affinity state of the wild type channel changed from ∼1.5 to 9 μM after more than four successive stimulations by 2APB, suggestive of a change in the pore structure, which likely includes a movement of Asp641.
Asp682 of TRPV4 has been placed at the outer mouth of the selectivity filter based on modeling and mutagenesis studies (37). Interestingly, for this site of TRPV4, the affinity to extracellular Ca2+ is much lower (EC50 = 765 μM) (38) than the equivalent site of TRPV3 (<10 μM, this study). Charged residues in the neighboring environment and the overall electrostatic potential at the selectivity filter may influence the spatial arrangement of the Asp residues from the four channel subunits and in turn affect the affinity to Ca2+. This large difference in affinity between TRPV3 and TRPV4 highlights the flexibility of this pore region, which could be important for its high sensitivity to subtle conformational changes in response to successive stimulations.
The cytoplasmic side of action of Ca2+ appears to be mediated by CaM through a CaM-binding site located at the N-terminus of the channel protein as disrupting CaM binding at this site greatly increased the initial response and abolished sensitization. However, it remains mysterious how the wild type channel gradually loses the sensitivity to cytoplasmic Ca2+ in response to repetitive stimulations. One possibility is that in the sensitized conformation, Ca2+-CaM binds to the channel with a much-reduced affinity. Alternatively, Ca2+-CaM binding at the same N-terminal site only causes channel inhibition in the naïve but not in the sensitized conformation. In either case, a drift of the CaM-binding site further away from the channel pore, which would make it less sensitive to the Ca2+ coming through the open channel because of the limited diffusion, does not appear to be the main reason as sensitization also emerged by triggering Ca2+ release from internal sources and by keeping the free [Ca2+] elevated (at ∼1.6 μM) throughout the experiment. Nonetheless, it may be the same conformational change that reduces both Ca2+ affinity to Asp641 and Ca2+-CaM sensitivity at the cytoplasmic N-terminus. Structural constrains could make the two processes coupled and/or inseparable since the critical sites are all present on the same polypeptide.
What causes the conformational change that reduces CaM-dependent inhibition and the Ca2+ block at the pore? Evidently, this may involve additional factors/mechanisms. For example, we have recently found that the agonist-evoked activity of TRPV3 is enhanced by unsaturated fatty acids as well as by the activation of protein kinase C (16). It is possible that phosphorylation or changes in fatty acid metabolism alter the Ca2+ affinity at the pore and CaM binding at the N-terminus. These changes or some yet unknown channel modulation could be the prerequisite for the conformational transition from the naïve to the sensitized state. Further investigation in this area will be very interesting and will greatly enhance our understanding on the mechanism of sensitization of the TRPV3 channel.
An increasing number of TRP channels have displayed voltage-dependent gating under various conditions (5,27,28). For some, e.g. TRPV1 and TRPM8, channel activity is readily detectable at non-physiological high positive potentials at the room temperature in the absence of any agonist (27). Others require cofactors such as Ca2+ for TRPM4 and M5 (5,28,39). The changes in the voltage dependence included decreases in V1/2 and VDF values. V1/2 changes are most frequently reported to account for the activation by temperature or chemical ligands. Changes in VDF, which was sometimes referred to as the fraction of open channels at negative potentials, have also been detected (39-41), but only specifically emphasized in few studies (42,43).
In contrast to TRPV1 and TRPM8, the naïve TRPV3 channel does not show any voltage dependent activation in the absence of chemical or heat stimulus (not shown). The voltage-dependence only appears when the channel is stimulated. Sensitization is accompanied with a decrease in the voltage dependence both in terms of VDF and V1/2. The high affinity Ca2+ interaction site at the pore loop appears to be more important for maintaining the overall voltage dependence as removing extracellular Ca2+ or mutating Asp641 to Asn led to dramatic decrease of the VDF. The N-terminal CaM-binding site may preferentially influence the V1/2 since it was changed ∼120 mV more negative by disrupting CaM binding at this site. Thus, the voltage dependence of TRPV3 seems to be established by Ca2+ binding at the pore but the voltage range for this dependence is strongly influenced by Ca2+-CaM binding at the cytoplasmic N-terminus. During repetitive stimulations of the wild type channel in the normal Ca2+ bath, the V1/2 was the main property changed. This change was less pronounced when intracellular Ca2+ was strongly buffered by BAPTA due to the already reduced V1/2 value during the initial response. The finding that VDF, reflective of Ca2+ block at the pore, was slightly reduced after multiple stimulations and the reduction is more significant in BAPTA- than in EGTA-buffered internal solution further indicates that changes in Ca2+-CaM inhibition at the intracellular site and the Ca2+ block at the pore are two related aspects of the same process evoked by repeated channel activation.
Two fundamentally different mechanisms have been shown for the voltage-dependent gating of TRP channels. One involves a movement of voltage sensors similar to classical voltage-gated channels except for the very small gating charge of the TRP channels (28). The other involves voltage-dependent block and unblock by divalent cations (40). For TRPV3, the intrinsic voltage gating appears minor, but the voltage-dependent block and unblock by Ca2+ seem to contribute more significantly to the voltage dependence. This is accomplished by the high affinity Ca2+ interaction at the pore-loop as neutralization of Asp641 or removal of external Ca2+ greatly uncoupled channel from voltage sensing and abolished its rectification behavior. It appears that under normal conditions, extracellular Ca2+ plugs the pore by binding to Asp641. Unplugging occurs at positive potentials in a time dependent manner or at very negative potentials when the driving force is strong enough to move Ca2+ through. This scenario resembles the Mg2+ block of TRPV6. Interestingly, for TRPV6, VDF was the main property of the voltage dependence changed with varying concentrations of Mg2+. V1/2 changes were mainly associated with changing permeability (40). In analogy, reducing Ca2+ affinity at the pore-loop of TRPV3 might be similar to decreasing Mg2+ concentration for TRPV6, resulting in uncoupling of Ca2+-induced voltage gating. By contrast, the decrease in V1/2 during repeated stimulations is consistent with the increase in permeability, which was suppressed by the N-terminal CaM-binding site. However, unlike TRPV6, TRPV3 is blocked by Ca2+ but not by Mg2+ (data not shown). The Ca2+-binding residue (Asp641) of TRPV3 is on one side (outer side) of the selectivity filter rather than in the middle like in the case of TRPV6, arguing against the bi-directional permeation block. To what extent the Ca2+-dependent voltage gating contributes to the agonist- and heat-induced channel activation as compared to the intrinsic voltage gating is a challenging question that warrants further investigation.
In summary, we have shown that TRPV3 is intrinsically inhibited by Ca2+-CaM binding at an N-terminal site and a high affinity Ca2+ block at the pore loop involving Ala108-Gly130 and Asp641, respectively. Sensitization is accompanied with a decrease in CaM-dependent inhibition as well as a reduction of Ca2+ block at the pore. In addition, the membrane voltage supporting the ligand-evoked current is shifted to more negative and voltage-independent activity is increased as a result of sensitization. However, it remains to be determined whether the same changes occur in response to repetitive stimulations by innocuous as well as noxious heat and whether protein phosphorylation and/or other modification(s) are involved in causing these changes. Furthermore, the physiological significance of sensitization to repetitive stimulations of TRPV3 and its possible involvement under pathophysiological conditions are still largely unknown and warrant continued investigation.
Acknowledgements
We thank Dr. Hongzhen Hu for the initial functional test of the Ca2+-dependent regulation of TRPV3, Drs. John J. Enyeart and Alexander V. Zholos for critical discussion of the results, Ms. Dina Chuang-Zhu for technical assistance. J.T. was a postdoctoral fellowship recipient of American Heart Association Ohio Valley Affiliate. C.K.C. was a recipient of the Meier Schlesinger graduate fellowship. The study was supported by US NIH grants R01-NS042183 and R21-NS056942 to M.X.Z. Additional support was provided by US NIH grant P30-NS045758 and American Heart Association Grant-in-Aid 0755277B.
Footnotes
- 2APB
- 2-aminoethoxydiphenyl borate
- CaM
- calmodulin
- G-V
- conductance-voltage
- I-V
- current-voltage
- MBP
- maltose-binding protein
- NMDG
- N-methyl-D-glucamine
- TRP
- Transient Receptor Potential
- VDF
- voltage-dependent fraction
- WT
- wild-type
- z
- the valence of the gating charge.
REFERENCES
- 1.Clapham DE. Nature. 2003;426(6966):517–524. doi: 10.1038/nature02196. [DOI] [PubMed] [Google Scholar]
- 2.Jordt SE, McKemy DD, Julius D. Curr Opin Neurobiol. 2003;13(4):487–492. doi: 10.1016/s0959-4388(03)00101-6. [DOI] [PubMed] [Google Scholar]
- 3.Patapoutian A, Peier AM, Story GM, Viswanath V. Nat Rev Neurosci. 2003;4(7):529–539. doi: 10.1038/nrn1141. [DOI] [PubMed] [Google Scholar]
- 4.Bautista DM, Jordt SE, Nikai T, Tsuruda PR, Read AJ, Poblete J, Yamoah EN, Basbaum AI, Julius D. Cell. 2006;124(6):1269–1282. doi: 10.1016/j.cell.2006.02.023. [DOI] [PubMed] [Google Scholar]
- 5.Talavera K, Yasumatsu K, Voets T, Droogmans G, Shigemura N, Ninomiya Y, Margolskee RF, Nilius B. Nature. 2005;438(7070):1022–1025. doi: 10.1038/nature04248. [DOI] [PubMed] [Google Scholar]
- 6.Togashi K, Hara Y, Tominaga T, Higashi T, Konishi Y, Mori Y, Tominaga M. EMBO J. 2006;25(9):1804–1815. doi: 10.1038/sj.emboj.7601083. [DOI] [PMC free article] [PubMed] [Google Scholar]
- 7.Chung MK, Lee H, Caterina MJ. J Biol Chem. 2003;278(34):32037–32046. doi: 10.1074/jbc.M303251200. [DOI] [PubMed] [Google Scholar]
- 8.Chung MK, Lee H, Mizuno A, Suzuki M, Caterina MJ. J Biol Chem. 2004;279(20):21569–21575. doi: 10.1074/jbc.M401872200. [DOI] [PubMed] [Google Scholar]
- 9.Xu H, Delling M, Jun JC, Clapham DE. Nat Neurosci. 2006;9(5):628–635. doi: 10.1038/nn1692. [DOI] [PubMed] [Google Scholar]
- 10.Moqrich A, Hwang SW, Earley TJ, Petrus MJ, Murray AN, Spencer KS, Andahazy M, Story GM, Patapoutian A. Science. 2005;307(5714):1468–1472. doi: 10.1126/science.1108609. [DOI] [PubMed] [Google Scholar]
- 11.Asakawa M, Yoshioka T, Matsutani T, Hikita I, Suzuki M, Oshima I, Tsukahara K, Arimura A, Horikawa T, Hirasawa T, Sakata T. J Invest Dermatol. 2006;126(12):2664–2672. doi: 10.1038/sj.jid.5700468. [DOI] [PubMed] [Google Scholar]
- 12.Xiao R, Tian J, Tang J, Zhu MX. Cell Calc. 2007 doi: 10.1016/j.ceca.2007.06.004. doi:10.1016/j.ceca.2007.06.004. [DOI] [PMC free article] [PubMed] [Google Scholar]
- 13.Calixto JB, Kassuya CA, Andre E, Ferreira J. Pharmacol Ther. 2005;106(2):179–208. doi: 10.1016/j.pharmthera.2004.11.008. [DOI] [PubMed] [Google Scholar]
- 14.Chung MK, Lee H, Mizuno A, Suzuki M, Caterina MJ. J Neurosci. 2004;24(22):5177–5182. doi: 10.1523/JNEUROSCI.0934-04.2004. [DOI] [PMC free article] [PubMed] [Google Scholar]
- 15.Hu HZ, Gu Q, Wang C, Colton CK, Tang J, Kinoshita-Kawada M, Lee LY, Wood JD, Zhu MX. J Biol Chem. 2004;279(34):35741–35748. doi: 10.1074/jbc.M404164200. [DOI] [PubMed] [Google Scholar]
- 16.Hu HZ, Xiao R, Wang C, Gao N, Colton CK, Wood JD, Zhu MX. J Cell Physiol. 2006;208(1):201–212. doi: 10.1002/jcp.20648. [DOI] [PMC free article] [PubMed] [Google Scholar]
- 17.Xu H, Ramsey IS, Kotecha SA, Moran MM, Chong JA, Lawson D, Ge P, Lilly J, Silos-Santiago I, Xie Y, DiStefano PS, Curtis R, Clapham DE. Nature. 2002;418(6894):181–186. doi: 10.1038/nature00882. [DOI] [PubMed] [Google Scholar]
- 18.Peier AM, Reeve AJ, Andersson DA, Moqrich A, Earley TJ, Hergarden AC, Story GM, Colley S, Hogenesch JB, McIntyre P, Bevan S, Patapoutian A. Science. 2002;296(5575):2046–2049. doi: 10.1126/science.1073140. [DOI] [PubMed] [Google Scholar]
- 19.Bhave G, Zhu W, Wang H, Brasier DJ, Oxford GS, Gereau RW., 4th Neuron. 2002;35(4):721–731. doi: 10.1016/s0896-6273(02)00802-4. [DOI] [PubMed] [Google Scholar]
- 20.Numazaki M, Tominaga T, Takeuchi K, Murayama N, Toyooka H, Tominaga M. Proc Natl Acad Sci USA. 2003;100(13):8002–8006. doi: 10.1073/pnas.1337252100. [DOI] [PMC free article] [PubMed] [Google Scholar]
- 21.Caterina MJ, Rosen TA, Tominaga M, Brake AJ, Julius D. Nature. 1999;398(6726):436–441. doi: 10.1038/18906. [DOI] [PubMed] [Google Scholar]
- 22.Wang C, Hu HZ, Colton CK, Wood JD, Zhu MX. J Biol Chem. 2004;279(36):37423–37430. doi: 10.1074/jbc.M407205200. [DOI] [PubMed] [Google Scholar]
- 23.Zhang Z, Tang J, Tikunova S, Johnson JD, Chen Z, Qin N, Dietrich A, Stefani E, Birnbaumer L, Zhu MX. Proc Natl Acad Sci USA. 2001;98(6):3168–3173. doi: 10.1073/pnas.051632698. [DOI] [PMC free article] [PubMed] [Google Scholar]
- 24.Tang J, Lin Y, Zhang Z, Tikunova S, Birnbaumer L, Zhu MX. J Biol Chem. 2001;276(24):21303–21310. doi: 10.1074/jbc.M102316200. [DOI] [PMC free article] [PubMed] [Google Scholar]
- 25.Stern MD. Cell Calcium. 1992;13(3):183–192. doi: 10.1016/0143-4160(92)90046-u. [DOI] [PubMed] [Google Scholar]
- 26.Naraghi M, Neher E. J Neurosci. 1997;17(18):6961–6973. doi: 10.1523/JNEUROSCI.17-18-06961.1997. [DOI] [PMC free article] [PubMed] [Google Scholar]
- 27.Voets T, Droogmans G, Wissenbach U, Janssens A, Flockerzi V, Nilius B. Nature. 2004;430(7001):748–754. doi: 10.1038/nature02732. [DOI] [PubMed] [Google Scholar]
- 28.Nilius B, Talavera K, Owsianik G, Prenen J, Droogmans G, Voets T. J Physiol. 2005;567(Pt 1):35–44. doi: 10.1113/jphysiol.2005.088377. [DOI] [PMC free article] [PubMed] [Google Scholar]
- 29.Zhu MX. Pflugers Arch. 2005;451(1):105–115. doi: 10.1007/s00424-005-1427-1. [DOI] [PubMed] [Google Scholar]
- 30.Turner H, Fleig A, Stokes A, Kinet JP, Penner R. Biochem J. 2003;371(Pt 2):341–350. doi: 10.1042/BJ20021381. [DOI] [PMC free article] [PubMed] [Google Scholar]
- 31.Liu M, Liu MC, Magoulas C, Priestley JV, Willmott NJ. J Biol Chem. 2003;278(7):5462–5472. doi: 10.1074/jbc.M209111200. [DOI] [PubMed] [Google Scholar]
- 32.Chung MK, Guler AD, Caterina MJ. J Biol Chem. 2005;280(16):15928–15941. doi: 10.1074/jbc.M500596200. [DOI] [PubMed] [Google Scholar]
- 33.Dalton P, Doolittle N, Breslin PA. Nat Neurosci. 2002;5(3):199–200. doi: 10.1038/nn803. [DOI] [PubMed] [Google Scholar]
- 34.Delwiche JF. Food Quality and Preference. 2004;15(2):137–146. [Google Scholar]
- 35.Garcia-Martinez C, Morenilla-Palao C, Planells-Cases R, Merino JM, Ferrer-Montiel A. J Biol Chem. 2000;275(42):32552–32558. doi: 10.1074/jbc.M002391200. [DOI] [PubMed] [Google Scholar]
- 36.Voets T, Prenen J, Vriens J, Watanabe H, Janssens A, Wissenbach U, Bodding M, Droogmans G, Nilius B. J Biol Chem. 2002;277(37):33704–33710. doi: 10.1074/jbc.M204828200. [DOI] [PubMed] [Google Scholar]
- 37.Owsianik G, Talavera K, Voets T, Nilius B. Annu Rev Physiol. 2006;68:685–717. doi: 10.1146/annurev.physiol.68.040204.101406. [DOI] [PubMed] [Google Scholar]
- 38.Nilius B, Vriens J, Prenen J, Droogmans G, Voets T. Am J Physiol Cell Physiol. 2004;286(2):C195–C205. doi: 10.1152/ajpcell.00365.2003. [DOI] [PubMed] [Google Scholar]
- 39.Nilius B, Prenen J, Droogmans G, Voets T, Vennekens R, Freichel M, Wissenbach U, Flockerzi V. J Biol Chem. 2003;278(33):30813–30820. doi: 10.1074/jbc.M305127200. [DOI] [PubMed] [Google Scholar]
- 40.Voets T, Janssens A, Prenen J, Droogmans G, Nilius B. J Gen Physiol. 2003;121(3):245–260. doi: 10.1085/jgp.20028752. [DOI] [PMC free article] [PubMed] [Google Scholar]
- 41.Voets T, Nilius B, Hoefs S, van der Kemp AW, Droogmans G, Bindels RJ, Hoenderop JG. J Biol Chem. 2004;279(1):19–25. doi: 10.1074/jbc.M311201200. [DOI] [PubMed] [Google Scholar]
- 42.Zhang Z, Okawa H, Wang Y, Liman ER. J Biol Chem. 2005;280(47):39185–39192. doi: 10.1074/jbc.M506965200. [DOI] [PubMed] [Google Scholar]
- 43.Matta JA, Ahern GP. J Physiol. 2007;585(Pt 2):469–482. doi: 10.1113/jphysiol.2007.144287. [DOI] [PMC free article] [PubMed] [Google Scholar]