

Abstract
During maturation, chondrocytes undergo changes in morphology, matrix production, and gene expression; however, it remains unclear whether these are interrelated. In this study, we examined whether Rho GTPases were involved in these regulatory interplays. Levels of active Rho GTPases were assayed in immature and mature primary chondrocytes. We found that activation of Rac-1 and Cdc42 increased with maturation, whereas RhoA levels remained unchanged. GFP-tagged Rho GTPases tracked cellular localization. Rac-1 was enriched at the cell membrane where it co-localized with cortical actin, while RhoA and Cdc42 were cytoplasmic. To test the roles of Rac-1 in chondrocyte maturation, we force-expressed constitutively active or dominant negative forms of Rac-1 and assessed phenotypic consequences in primary chondrocytes. Activated Rac-1 expression induced chondrocyte enlargement and increased matrix metalloproteinase expression, which are characteristic of mature chondrocytes. Conversely, Rac-1 inactivation diminished adhesion, decreased alkaline phosphatase activity, and stimulated functions typical of immature chondrocytes. Exposure to a pro-maturation factor, Wnt3A, induced a flattened and enlarged morphology accompanied by peripheral Rac-1 rearrangement. Wnt3A stimulated Tiam1 expression and Rac-1 activation, while DN-Rac-1 inhibited Wnt3A-induced cell spreading. Our data provide strong evidence that Rac-1 coordinates changes in chondrocyte phenotype and function and stimulates the maturation process essential for skeletal development.
Keywords: Rac-1, chondrogenesis, hypertrophy, growth plate, Rho GTPase, actin, chondrocyte maturation, Wnt 3A
Introduction
In the epiphyseal growth plate, chondrocytes undergo a complex maturation process, which is required for long bone skeletal development and postnatal growth. The growth plate can be separated into distinct zones; resting, proliferating, prehypertrophic, and hypertrophic. During the transition through these zones, chondrocytes undergo significant changes in cytoskeletal architecture, behavior, and function. In the proliferating zone, chondrocytes display a flattened morphology, express high levels of cyclin D1, and begin to organize into columns. [1] As they exit the cell cycle, chondrocytes advance to the pre-hypertrophic stage where they acquire an oval-to-round shape, express high levels of the signaling factor Indian hedgehog (IHH) and cartilage matrix genes including collagen type II, collagen type IX, and aggrecan. The chondrocytes then undergo hypertrophy, during which the cells increase in volume approximately 10 fold, initiate expression of gene products such as collagen type X and VEGF, and produce high levels of alkaline phosphatase activity. [2, 3] In the terminal layer of the hypertrophic zone near the chondro-osseus border, late differentiation is marked by increases in matrix metalloproteinase (MMP)-13 and osteopontin, which stimulates calcification of the extracellular matrix. [4] Finally, endochondral ossification terminates with the chondrocytes and calcified matrix being replaced by bone.
The significant changes in cytoskeletal architecture, size, and shape accompanying the chondrocyte maturation process have long been appreciated, but their underlying mechanisms and their significance in development remains unclear. Chondrocytes have a cytoskeleton composed of actin, tubulin, and vimentin filaments. [5] In vivo, the actin cytoskeleton in chondrocytes is organized as a dense, punctuate and cortical network located just inside the cell membrane [6] and is likely involved in endocytosis and secretion. [7] In contrast, the actin cytoskeleton is far more developed in monolayer-cultured chondrocytes and can co-localize with vinculin at focal points with ECM components. [8] Several studies have shown in vitro that cytoskeleton formation and chondrocyte phenotype are interdependent. Differentiated chondrocytes in monolayer have moderately developed actin cytoskeletons. However, once expansion dedifferentiated, they demonstrate strong actin fiber development, have a fibroblastic morphology, and produce collagen type I and collagen type III. [9–11] Interestingly, when the actin cytoskeleton of the de-differentiated chondrocytes is pharmacologically disrupted, the cells regain some differentiated functions and a more normal cytoskeleton. [10] A similar beneficial effect is also seen in limb mesenchymal chondrogenic cells in micromass in which actin filament disruption was found to enhance their differentiation into chondrocytes. [12] These studies demonstrate the importance of cytoskeletal development in regulating chondrocyte morphology and phenotype.
One strong candidate for regulating the morphological and cytoskeletal features and function of chondrocytes is the Rho GTPase family. These proteins function as molecular switches, with an active, GTP-bound state and an inactive, GDP-bound state, which are regulated by guanine nucleotide exchange factors (GEFs) and GTPase activating proteins (GAPs). The Rho GTPase family is composed of major three types of molecules: RhoA, Rac-1, and Cdc42 proteins, which have distinct and potent effects on actin cytoskeletal organization. RhoA controls stress fiber formation, whereas Rac-1 induces membrane ruffling and lamelipodia and Cdc42 stimulates filopodia formation. In addition, Rho GTPases are involved in other cellular functions, including gene expression, cell cycle progression, and enzymatic regulation. [13–15]
Recent work has pointed to the relevance and potential importance of Rho GTPases in chondrocyte function. In gain-of-function experiments using the chondrogenic cell line ATDC5, RhoA over-expression was found to induce actin filament organization and stress fibers, to increase proliferation and proteoglycan production, and to suppress maturation and hypertrophy. [16, 17] Conversely, overexpression of Rac-1 and Cdc42 in ATDC5 cells induces collagen type X expression, alkaline phosphatase activity, and matrix mineralization, which are associated with mature chondrocytes. [18] A recent study has indicated that genetic ablation of Rac-1 in developing cartilage leads to growth retardation with irregular growth plate organization, suppression of chondrocyte proliferation and a decreased area of collagen type X expression, indicating a delay in chondrocyte differentiation. [19] These studies demonstrate the diverse roles of the Rho GTPases at multiple points of chondrocyte differentiation, with Rac-1 and Cdc42 possibly functioning in pre-chondrogenic and mature cells, while RhoA functions during early chondrocyte differentiation.
Although the significance of Rho GTPases in chondrogenic differentiation and importance of Rac-1 in chondrocyte maturation has been acknowledged, the nature of Rho GTPase activities during chondrocyte maturation and their regulation of chondrocyte characteristic expression at a cellular has have remained unclear. [16, 17, 19–21] In this study, we monitor the status of Rho GTPases in primary chondrocytes by a biochemical pull down assay and live cell imaging analysis. We find that Rac-1 and Cdc42, but not RhoA, activation increases with chondrocyte maturation, and that Rac-1 distribution corresponds to changes in chondrocyte morphology. We also verify the roles of Rho GTPases specific for chondrocytes using primary cell culture that has been evaluated in previous studies in an immortalized chondrogenic cell line or a mixed limb bud population. Further manipulation of Rho GTPase activity in chondrocytes reveals that Rac-1, rather than Cdc42 or RhoA, is more potent in the regulation of cell morphology, volume, and the expression of a differentiated phenotype during chondrocyte maturation. Finally we demonstrate a functional interaction between Wnt signaling, pro-maturation signaling and Rac activity in chondrocytes. These data strengthen the idea that Rac-1 and its activation status are critical regulators and stimulators of chondrocyte maturation.
Materials and methods
Reagents
Media and fetal bovine serum (FBS) were obtained from CellGro, Mediatech (Herdon, VA). Restriction enzymes were purchased from Promega (Madison, WI). Substrates: poly-L-Lysine, collagen type II, collagen type I and chemicals, were provided by Sigma (St. Louis, MO). Fibronectin was purchased from BD Biosciences (San Jose, CA). NSC23766 (Calbiochem, San Diego, CA) is a pharmacological Rac-1 specific inhibitor, which inhibits binding of Trio or Tiam1 GEFs, thus maintaining the GDP-bound state. [22]
Chondrocyte culture
Chondrocytes were isolated from E17 chick embryos by enzymatic digestion of upper and lower sternal explants with 0.15% collagenase and 0.25% trypsin for 3 hours at 37°C as previously reported. [23] Chondrocytes were kept in DMEM/10% FBS except where indicated.
RCAS virus construction and infection
Plasmids containing human Rac-1 (plasmid 12980), Cdc42 (plasmid 12975) or RhoA (plasmid 12965) that was tagged with GFP at the C-terminal site were developed by Gary Bokoch and purchased from Addgene (Cambridge, MA). [24] The GFP-tagged GTPase was then removed from the pcDNA vector by digestion with HindIII and XhoI and subcloned into the pBluescript II SK(+) vector (Stratagene, Cedar Creek, TX). The gene was then isolated from the pBluescript vector by digestion with ClaI and NotI and ligated into the RCASBP(B) L-14 or L-44 vector in the correct orientation. [25] EGFP-actin was removed from pEGFP-Actin vector (Clontech Laboratories Inc., Mountain View, CA) by digestion with NheI and BamHI and inserted into RCASBP(B) vector. RCAS replication competent viral vectors encoding GFP, constitutively active (CA)- or dominant negative (DN)-Rac-1, CA-RhoA, CA-Cdc42, GFP-Rac-1, GFP-Cdc42, GFP-RhoA, or EGFP-actin were transfected into DF-1 cells (ATCC). [26] CA-Rac-1 (RacV12), CA-Cdc42 (CdcV12), and CA-RhoA (RhoAV14) were the results of a point mutation at residues 12 or 14 of valine for glycine, making the proteins unresponsive to GAPs. DN-Rac-1 (RacN17) was the product of a point mutation at residue 17 from serine to asparagine, which increased the affinity of the protein for GDP. DF-1 cells were passaged and allowed to proliferate until the virus was produced in sufficient quantity. After collection of viral medium, cell debris was removed by centrifugation at 3000 rpm for 10 minutes. The viral particles were concentrated by ultracentrifugation at 23000 rpm for 2 hours at 4°C. After centrifugation, virus was resuspended in a small volume of M199/10% FBS medium and stored at −70°C until use. Isolated chondrocytes were infected by incubation with the concentrated virus on ice for 30 minutes prior to plating on dishes. Once cells had reached 90% confluency, they were harvested and used in the following experiments.
Preparation of Wnt3A containing conditioned media (Wnt3A CM)
The L-Wnt3A cell line stably expressing Wnt3A and control wild type L cell line were purchased from the American Type Culture Collection (Manassas, VA). Medium was conditioned by L-Wnt3A cells (Wnt3A CM) or control L cells (control CM) over a 72 hr period and was collected, processed and used according to manufacturer’s protocol.
Western blot
After infection of chondrocytes with CA- or DN-Rac-1, CA-Cdc42 or CA-RhoA RCAS virus, we plated cells at a density of 3 × 10⁵ cells on collagen type I coated 24 well plates and allowed cells to attach overnight. Cells were then lysed with SDS lysis buffer. Lysates were sonicated for 10 seconds and boiled at 95°C for 10 minutes. Samples underwent electrophoresis on a 12% polyacrylamide gel at 100V for approximately 1.5 hours. Proteins were transferred to a nitrocellulose membrane at 100V for 45 minutes. Membranes were blocked with 10% milk in TBS-tween20. Rac-1 primary antibody (Upstate, Billerica, MA) binds to both CA- and DN-Rac-1 denatured protein. RhoA antibody (Upstate) and Cdc42 antibody (Cell Signaling, Danvers, MA) were used to visualize total and constitutively active proteins. Alpha tubulin antibody (Sigma) was used a loading control. C-myc antibody (Santa Cruz Biotechnology, Inc, Santa Cruz, CA) was used to visualize the amount of tagged mutant Rac-1 in cell lysates. Horseradish-peroxidase conjugated secondary antibodies (Cell Signaling) were used with luminescent substrate to visualize proteins.
Rho GTPase pull down assays
CA- and DN-Rac-1 RCAS infected chondrocytes were replated at 2 × 10⁶ cells in a 100 mm dish and grown to 90% confluency. Separately, 2 × 10⁶ freshly isolated upper and lower sternal chondrocytes were plated in 100 mm dishes. The cell lysate was prepared according to the manufacturer’s protocol for the EZ-Detect Rac-1 Activation Kit (Pierce, Rockford, IL). Briefly, active Rac-1 or Cdc42 bound to a Pak-1 binding domain fused to GST and was isolated by a glutathione gel. Eluted active Rac-1 or Cdc42 proteins were then visualized by immunoblotting with anti-Rac-1 (Upstate) or anti-Cdc42 (Upstate) antibodies, respectively. Activated Rho protein was isolated using the Pierce EZ-Detect Rho Activation Kit as described above, however Rhotekine-RBD fused to GST was used to bind active Rho protein. Anti-Rho antibody (Upstate) was used to visualize the protein. The activated protein contents were normalized to tubulin protein contained in total cell lysates using densitometric analysis with the ImageJ program (NIH).
Cell attachment and spreading assays
Wells of a 24 well plate were coated with gelatin, collagen type I, collagen type II or fibronectin by incubation with substrate solution (1% gelatin, 10 μg/mL collagen type I in 0.02 N HCl, 10 μg/mL collagen type II or 10 μg/mL fibronectin) at 37°C overnight and then blocked with 0.1% BSA for 1 hour prior to plating. Poly-L-lysine was used as a control for strong substrate attachment and BSA coated wells were a control for weak substrate attachment. Chondrocytes were plated post-infection into coated wells of 24 well plates at 1.5 × 10⁵ cells/well. Cells were fixed with 10% formalin for 10 minutes at 1 and 3 hours. Fixed chondrocytes were stained with 0.5% crystal violet (C25H30CIN3) in 20% methanol for 5 minutes to visualize whole cells. Photos were taken with a Nikon Eclipse TE2000-U fluorescent microscope. ImagePro 5.0 software was used to capture and analyze photos of 10 separate fields. The number of cells attached and the area of individual cells in the field were counted at each time point.
Flow Cytometry for cell size
CA- and DN-Rac-1 RCAS infected chondrocytes were plated at the density of 1 × 10⁶ cells on a 60 mm dish. After four days, cells were trypsinized and washed twice in PBS before fixation in ice-cold 70% ethanol. Additionally, freshly isolated lower and upper sternal chondrocytes were fixed in 70% ethanol. Samples were stored in ethanol at −20°C until ready to be stained. Cells were removed from ethanol by centrifugation and washed in PBS. Pelleted chondrocytes were resuspended in 500 μL of 20 μg/mL propidium iodide (PI, Invitrogen, Carlsbad, CA)/0.1% TritonX-100/200 μg/mL RNase A and incubated for 30 minutes at room temperature. Cells were excited at 488 nm using a Coulter EPICS XL-MCL flow cytometer (Beckman Coulter, Fullerton, CA) running the XL2 software. Data were analyzed using WINMDI software. The forward scatter of stained chondrocytes was used to represent the size of chondrocytes in each sample. The fluorescence of cells was directly proportional to their size.
Semi-quantitative PCR
Total RNA was isolated from CA- and DN-Rac-1 RCAS infected chick chondrocytes two days after re-plating 1.5 × 10⁶ cells in 60 mm dishes using the TRIZOL method according to the manufacturer’s protocol. cDNA was synthesized from total RNA using M-MLV reverse transcriptase. Briefly, total RNA was incubated with 50–250 ng of random primers and 0.83 mM dNTP mixture for 5 minutes at 65°C, followed by a quick chill on ice. First-strand buffer, 0.01 M DTT and 2 U of recombinant ribonuclease inhibitor was added to the solution and incubated for 2 minutes at 37°C. Finally 10 U of M-MLV RT mix was added to the mixture and incubated 10 minutes at 25°C, followed by 50 minutes at 37°C and finally inactivated from 15 minutes at 70°C. The resulting RT mixture was used for RT-PCR or in a quantitative PCR (QPCR) assay. QPCR was completed according to the Power SYBR Green PCR protocol (Applied Biosystems, Foster City, CA). Briefly, RT mixture samples were diluted 1:2, 1:20, and 1:200 in nuclease free water. QPCR reactions were set up containing 0.5 μL of RT mixture, 25 μL of 2X Power SYBR Green PCR Master Mix, 2 μL of 10 μM forward and reverse primer pairs, and 22.5 μL of nuclease free water. Matrix molecule primers for aggrecan and collagen type IX were used to study the expression of matrix proteins. Expression of Sox9, MMP-7, -9 and -13 were also assessed. QPCR assays were completed using Applied Biosystems 7900HT Sequence Detection Systems running SDS 2.1 software by the Translational Medicine Core Facility. Data collected by the Translational Medicine Core Facility was then analyzed by relative quantification with comparison to a housekeeping gene (HPRT). Primer sequences were as follows: 5′-GAT GCC ATC TGT TAC AGT GGT GA-3′ and 5′-AGT GCC TGA GAC CGA TGT AGT G-3′ for 1040–1402 of aggrecan, 5′-ATT CTG GGT GCT CGT CAA AGA AC-3′ and 5′-AGC ACT GAG AAG CCA TCA ACA CT-3′ for 260–789 of collagen type IX, 5′-TCT CTG CCG GCT TTA CTT CTT G-3′ and 5′-TAC TGG TCA GCC AGC TTC CTT C-3′ for 6–496 of Sox9, 5′-TGG TAT GGA GCA ATG TGA CTC CGC T-3′ and 5′-CCT CGC CTA TCA TCC CAA TGA AGT G-3′ for 451–805 of MMP-7, 5′-GTG TGC CAC CAC CAG CAA CTA TCA C-3′ and 5′-CCT GAG TGC CTG ATT TCC AGA AGG A-3′ for 1113–1600 of MMP-9, 5′-CTT CGT GGA GAA ATG CTG GTC TT-3′ and 5′-TCG CAG AAC TCT GCT TTC CTC TA-3′ for 607–1238 of MMP-13, 5′-GCA GGA GGG GCA AAA CTA CTC AGG AT-3′ and 5′-TCT CAC TGT TGG TGG TGC TCA TCT CC-3′ for 947–1204 of Tiam1, and 5′-GC(A/G) TCG TGA TT(A/G) GCG ATG ATG A-3′ and 5′-GTC (A/G)AG GGC (A/G)TA TCC AAC AAG A-3′ for 110–672 of HPRT.
Histochemical staining
Chondrocytes were re-plated after infection with RCAS virus encoding CA- or DN-Rac-1 into 24 well plates at 3 × 10⁵ cells/well. After 7 days of growth, the matrix produced by cells was assessed histochemically. Infected chondrocytes were fixed with 3.7% formaldehyde, dehydrated with 70% ethanol, and incubated with 5% acetic acid (pH 1.0). Sulfated proteoglycans were stained with 1% Alcian blue in 5% acetic acid (pH 1.0).
Alkaline phosphatase production was assessed in cultures that have been treated with 10 μg/mL ascorbic acid for at least 6 days. Chondrocytes were incubated with a staining solution of 0.5 mg/mL Napthal AS-BI phosphate and 1 mg/mL Fast Red in 50 mM Tris-HCl (pH 9.0) for 15 minutes at 37°C and then fixed with 3.7% formaldehyde.
Immunostaining
Chondrocytes (30 μL) were spotted post-infection at 1 × 10⁷ cells/mL onto glass coverslips in a 6 well plate coated with 10 μg/mL collagen type I. After 1 hour, chondrocytes were fixed to coverslips with 10% neutralized formalin and permeabilized with 0.5% TritonX-100. Polymerized actin was stained using 7.5 U of rhodamine-labeled phalloidin antibody (Molecular Probes, Carlsbad, CA) for 30 minutes. Coverslips were mounted to slide with GEL/MOUNT (Biomeda, Foster City, CA). Photos were taken with a Nikon Eclipse TE2000-U fluorescent microscope using the proper filters to visualize the fluorescent markers. ImagePro 5.0 software was used to capture and analyze photos.
Statistical Analysis
One-way ANOVA analysis was used to determine statistical significance between groups. P-values were represented as follows: * is p < 0.05, ** is p < 0.01 and *** is p < 0.005.
Results
Rho GTPase activities in immature and mature chondrocytes
To determine whether Rho GTPase activity changed with chondrocyte maturation, we isolated immature chondrocytes from lower sterna (LS) and mature chondrocytes from upper sterna (US) of chick embryos. We had previously shown that LS chondrocytes remain immature for more than two weeks in culture, while US chondrocytes expressed a mature phenotype, marked by high levels of alkaline phosphatase activity and collagen type X expression from the beginning of culture. [23] Whole cell lysates were prepared from both LS and US culture and the endogenous, steady-state expression levels of RhoA, Rac-1, and Cdc42 proteins were examined by immunoblot analysis (Fig. 1A, Total). The amount of total RhoA, Rac-1, and Cdc42 proteins were similar between LS and US cultures when normalized by the tubulin expression levels (Fig. 1A, Tubulin). Active forms of Rho GTPases were isolated from whole cell lysates using a biochemical pull-down assay. Active RhoA protein contents were equal in LS and US cells (Fig. 1A, lanes 1 and 2, and Fig. 1B, Rho). In contrast, the ratios of active Rac-1 (Fig. 1A, lanes 3 and 4) and active Cdc42 (Fig. 1A, lanes 5 and 6) proteins were 3.5 and 8-fold higher in US than LS, respectively (Fig. 1B, Rac and Cdc). These data indicate that active forms of Cdc42 and Rac-1 increased in chondrocytes during maturation, while RhoA did not.
Figure 1. Pull down assay of Rho GTPase activity in immature and mature chondrocytes.
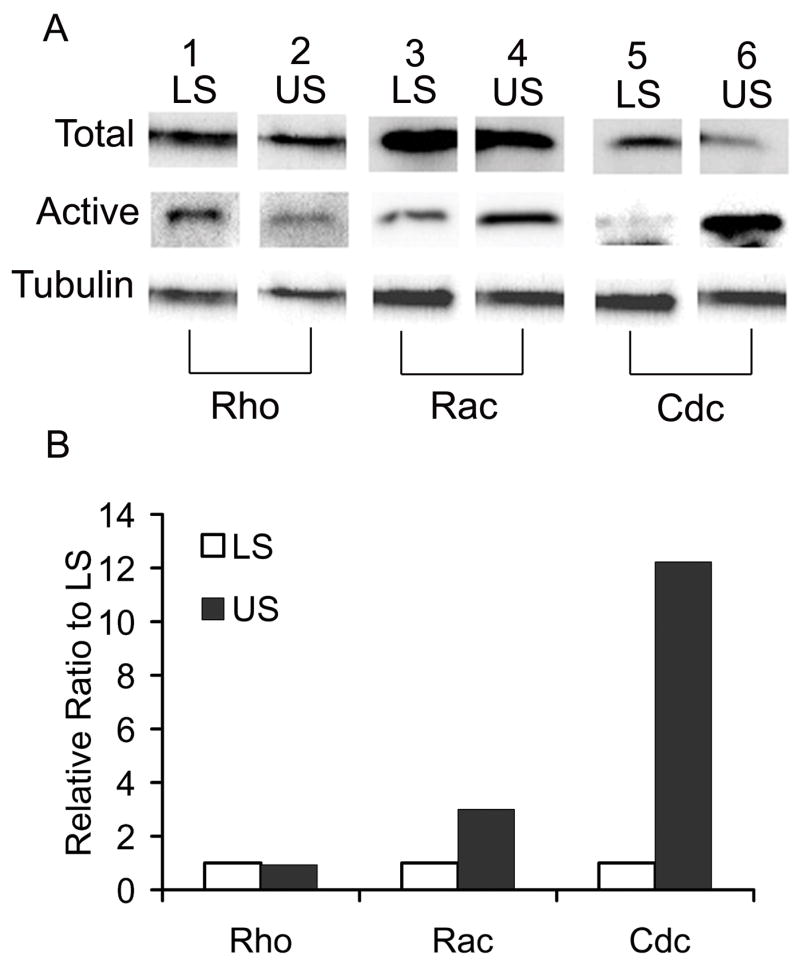
Immature (LS) and mature (US) chondrocytes were isolated from caudal and cephalic regions of sterna from 17-day old chick embryos, respectively, and cultured until confluent. Whole cell lysates from LS and US cultures were prepared and subjected to a pull down assay as described in Materials and Methods. A, The contents of active forms of Rho GTPases (Active) that bound to Rhotekine binding domain for RhoA or Pak-1 binding domain for Rac-1 and Cdc42 were visualized by immunoblotting with anti-RhoA antibody (Rho), anti-Rac-1 antibody (Rac) or anti-Cdc42 (Cdc). The total cell lysates were also subjected to immunoblotting for RhoA (Total, lanes 1 and 2), Rac-1 (Total, lanes 3 and 4), Cdc42 (Total, lanes 5 and 6) or tubulin (Tubulin, lanes 1–6) as an internal loading control. B, Band intensities for active forms of the Rho GTPases were measured by ImageJ and represented as the relative ratio to the LS culture after normalization by the tubulin band intensity.
Forced expression of mutant Rho GTPases in chondrocytes
To investigate the possible implication of the differences in active protein levels of Rho GTPases seen above, we introduced constitutively active (CA) human forms of RhoA, Rac-1, and Cdc42 into LS cultures, and determined their effects on chondrocyte morphology and spreading. The infection efficiency of the RCAS virus was greater than 80% (data not shown). Infection of all the viruses induced clear expression of mutant proteins, as shown by the presence of the myc tag (Fig. 2A, Myc), which had been linked to the exogenous protein. Expression of all the mutants induced cell spreading in subconfluent cultures when compared to the control (Fig. 2B) with CA-RhoA and CA-Cdc42 slightly increasing cell spreading (Fig. 2C and 2E), and CA-Rac-1 virus infection stimulating the strongest spreading (Fig. 2D, arrows). Computational analysis of the cell areas for subconfluent cultures determined that CA-RhoA and CA-Cdc42 expressing cells had areas 1.37 and 1.34 times larger than control, respectively. CA-Rac expressing chondrocytes had an average cell area 2.88 times that of control (data not shown). At confluency CA-RhoA or CA-Cdc42 RCAS infected cells displayed polygonal morphologies similar to that of the control (Fig. 2F, G, and I). In contrast, CA-Rac-1 virus-infected cells continued to exhibit significant spreading and several of the cells had considerably enlarged architecture (arrows) (Fig. 2H).
Figure 2. Effects of Rho GTPase activation on chondrocyte morphology.

LS chondrocytes were isolated and infected with RCAS virus encoding CA-RhoA (C and G), CA-Rac-1 (D and H) or CA-Cdc42 (E and I) or insert-less virus (Control, B and F), and re-plated. A, The whole cell lysates were then prepared and subjected to immunoblot for tubulin (Tubulin) or myc (Myc) that had been tagged to CA-GTPases. B-I, The phase contrast pictures were taken 2 days (B-E) and 5 days (F-I) after passage. Arrows indicate large, spread cells in CA-Rac-1 expressing cultures. Scale bar represents 100 μm.
Given that Rac-1 appeared to have the strongest influence, we focused on this family member and compared the effects of CA-Rac-1 and a dominant negative form of Rac-1 (DN-Rac-1) expression in LS cultures. The cultures infected with CA- or DN-Rac-1 RCAS virus expressed two molecules that were recognized by the antibody against Rac-1 (Fig. 3A, Total, lanes 2 and 3), since the CA- and DN-Rac-1 proteins had a single point mutation of the human sequence with a myc tag, they migrated to a higher position (arrowhead) than the endogenous chick product (arrow) (Fig. 3A, Total, lane 1). This was confirmed by the myc antibody also recognizing the higher mutant protein band (Fig. 3A, Myc, lanes 2 and 3). A biochemical pull down assay determined the levels of active, GTP-bound Rac-1 protein in control, CA- and DN-Rac-1 RCAS infected chondrocytes. Control cultures contained active endogenous Rac-1 protein (Fig. 3A, Active, lane 1). As expected, chondrocytes infected with RCAS encoding CARac-1 had a high content of active Rac-1 protein, while DN-Rac-1 expressing chondrocytes had undetectable levels of active Rac-1 protein (Fig. 3A, Active, lanes 2 and 3). Densitometric analysis revealed that active Rac-1 protein was 2 fold more abundant in the CA-Rac-1 expressing cultures compared to control (Fig. 3B).
Figure 3. Expression of CA- or DN-Rac-1 proteins and Rac-1 activity in CA- or DN-Rac-1 RCAS virus infected chondrocytes.
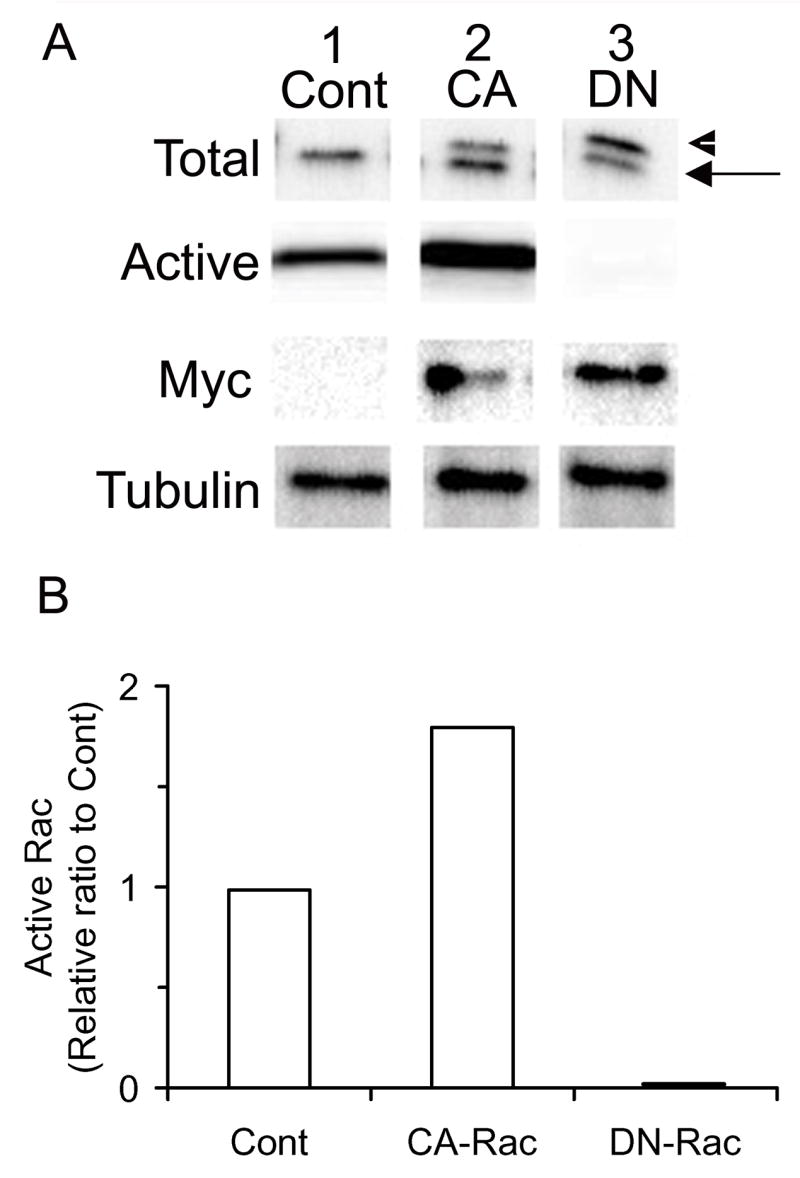
LS chondrocytes were isolated and infected with RCAS virus encoding CA- or DN-Rac-1 or insert-less virus (Cont). On day 7, whole cell lysates of these cultures were prepared and subjected to a pull down assay to examine Rac-1 activity. A, The proteins bound to Pak-1 beads were analyzed by immunoblot for Rac-1 (Active). The total cell lysates were subjected to immunoblot with the antibodies against Rac-1 (Total), myc (Myc) and tubulin (Tubulin). The arrow indicates the endogenous protein, while the arrowhead is the exogenous protein. B, The band intensity of active Rac-1 was measured by ImageJ and represented as a relative ratio to control after normalization with tubulin.
Effects of CA- and DN-Rac-1 on cell adhesion and spreading
CA-Rac-1 expression strongly influenced cell morphology, as described above and in previous findings. [20, 27] Thus, we first determined the ability of Rac-1 to modulate cell attachment and spreading. The infected chondrocytes were plated on collagen type I, fibronectin, gelatin, or collagen type II substrates and cell attachment was quantified by computer-assisted analysis one hour after plating. Cell attachment to all substrates in CA-Rac-1 encoding cells was similar to that of control chondrocytes (Fig. 4A, open and closed columns). In contrast, DN-Rac-1 RCAS infected chondrocytes exhibited a decreased attachment to each substrate (Fig. 4A, shaded column). Compared to control chondrocytes on each substrate, DN-Rac-1 expressing cell attachment decreased 34.4% on collagen type II, 57.4% on fibronectin, 19.4% on gelatin, and 58.9% on collagen type I. To verify the data, control cultures were treated with a pharmacological inhibitor of Rac-1 and similar decreases in adhesion were observed (data not shown).
Figure 4. Effects of CA- and DN-Rac-1 expression on the cell attachment and spreading of chondrocytes.

The LS cells were infected with RCAS virus encoding CA- (closed column) or DN-Rac-1 (shaded column) or insert-less control RCAS virus (Control, open column) and then re-plated on 24-well plates that had been coated with collagen type I (Collagen I), fibronectin, gelatin or collagen type II (Collagen II) in serum-free medium. The cultures were fixed with 10% formalin 1 hour (A) or 3 hours (B) after plating and stained with crystal violet. The number of cells attached (A) and the spreading areas of cells (B) in ten fields were counted as described in Materials and Methods. (* is p < 0.05, ** is p < 0.01 and *** is p < 0.005)
Since CA-Rac-1 expressing chondrocytes (Fig. 2D) appeared larger and more spread than control (Fig. 2B), we determined the quantitative differences in cell spreading after three hours by computationally calculating the area of crystal violet stained chondrocytes. CA-Rac-1 RCAS infection induced 1.6 to 2.1 fold increases in cell area on each of the substrates over control values (Fig. 4B, open and closed columns). DN-Rac-1 expressing cells seemed less spread on each substrate and more rounded by visual inspection, but we detected no significant quantitative decreases (Fig. 4B, shaded column).
To verify changes in cell volume, chondrocytes were stained with PI and subjected to flow cytometry. As shown in Table 1, we found that mature US chondrocytes were approximately 20% larger than immature LS cells. CA-Rac-1 RCAS infected chondrocytes exhibited a similar increase in volume, whereas DN-Rac-1 expressing cells were smaller.
Table 1.
Changes in chondrocyte cell volume during maturation and under Rac-1 modulation.
| Cells | Cell Volume | (%) |
|---|---|---|
| Immature (LS) | 232.05 | 100 |
| Mature (US) | 270.56 | 117** |
|
| ||
| Control | 223.83 | 100 |
| CA-Rac-1 | 265.01 | 118** |
| DN-Rac-1 | 203.29 | 91** |
Freshly isolated chondrocytes from lower (immature) and upper (mature) sterna of chick embryos (E17.5) and control, CA- or DN-Rac-1 RCAS infected lower sternal chondrocytes were prepared for flow cytometry analysis as described in Materials and Methods. The values represent the mean cell volume determined by the forward scatter and the percent enlargement compared to LS control chondrocytes.
is p < 0.01
Effects of CA- and DN-Rac-1 on differentiation
The above results indicated that modulation of Rac-1 activity strongly affected cell morphology, attachment, and spreading. We next investigated how these influences may relate to changes in chondrocyte function. The effects of Rac-1 modulation on cell function were examined histochemically. Alcian blue staining was used to visualize proteoglycan accumulation, which is high in immature chondrocytes and is markedly decreased with maturation. DN-Rac-1 RCAS infected cells (Fig. 5C) accumulated a higher content of proteoglycans than control (Fig. 5A), while CA-Rac-1 expressing chondrocytes (Fig. 5B) demonstrated decreased staining compared with DN-Rac-1 expressing and control cultures. Conversely, alkaline phosphatase activity was very low in immature chondrocytes and was stimulated with chondrocyte maturation. Histochemically, control and DN-Rac-1 encoding chondrocytes had low levels of alkaline phosphatase activity (Fig. 5E and F, respectively). CARac-1 RCAS infected chondrocytes; however, had higher levels of alkaline phosphatase activity (Fig. 5D). A biochemical assay for alkaline phosphatase showed that CA-Rac-1 encoding cultures had around 10% higher alkaline phosphatase activity, while DN-Rac-1 RCAS infected chondrocytes had 30% lower activity compared to control (data not shown).
Figure 5. Effects of CA and DN-Rac-1 expression on chondrocyte function.

The LS cells were infected with RCAS virus encoding CA- or DN-Rac-1, or insert-less RCAS virus (Control). The cultures were re-plated on collagen type I coated 24 well plates, maintained for 7 days and stained with Alcian blue (A–C) or for alkaline phosphatase (ALPase) (D–F). G and H, Total RNA were prepared from the control (open column), CA- (closed column) or DN-Rac-1 (shaded column) cultures on day 5 after re-plating and subjected to semiquantitative PCR to analyze the expression of Sox9, aggrecan (Agg), collagen type IX (Col IX) and MMP-7, -9 and -13.
To further determine the effects of Rac-1 modulation on chondrocyte function, we examined changes in chondrocyte characteristic gene expression. The chondrocyte master regulator, Sox9, and typical immature chondrocyte products: aggrecan and collagen type IX, gene expression were examined by quantitative PCR. Sox9 expression was largely unchanged in control, CA- and DN-Rac-1 expressing chondrocytes, signifying that the overall differentiated status of the cells was not being affected by protein over-expression (Fig. 5G). However, expression of both aggrecan and collagen type IX were significantly increased in DN-Rac-1 expressing (Fig. 5G, shaded column) chondrocytes, about 3.2 and 1.8 fold, respectively, compared to control (Fig. 5G, open column) and expression in CA-Rac-1 encoding cultures was slightly lower, particularly for aggrecan (Fig. 5G, closed column).
To examine genes characteristic of the mature, hypertrophic phenotype, we focused on MMPs that are normally upregulated in the hypertrophic zone. [4] These MMPs represented the catabolic function of chondrocytes which dissolves the proteoglycan matrix. DN-Rac-1 expression induced marginal changes in the levels of the MMPs over control cells (Fig. 5H, open and shaded columns), while CA-Rac-1 expression significantly upregulated MMP-7 (2.4 fold), -9 (2 fold) and -13 (3.5 fold) (Fig. 5H, closed column).
Distribution of Rac proteins
The data above indicated that activation of Rac-1 was associated with chondrocyte maturation and that exogenous activation of Rac-1 could stimulate a mature chondrocyte phenotype. Based upon the findings that Rac-1 had a strong influence on morphology and function in chondrocytes, we lastly investigated subcellular localization of Rac-1 in chondrocytes. Given that the Rac-1 antibody did not show a clear distribution of endogenous protein by immunostaining, we used the fluorescent labeling technique, which had been well established to detect small GTPase protein distribution. [28, 29] Rac-1, RhoA, or Cdc42 tagged with GFP was retrovirally introduced to chondrocytes and monitored under the fluorescence microscope in live cells over time in culture. The GFP-Rac-1 signals were diffusely detected in chondrocytes when the cells were fibroblastic in shape and did not contact each other (data not shown). However, when the culture reached confluency and displayed a polygonal shape, GFP-Rac-1 was intensely localized to the periphery of the cells (Fig. 6A, arrows). In contrast, GFP-RhoA and GFP-Cdc42 were broadly distributed in the cells and did not show clear localization to the periphery (Fig. 6C and D, respectively). Interestingly, actin tagged with GFP was also distributed in the periphery of the cells (Fig. 6E, arrows), similar to that of GFP-Rac-1, while the control GFP protein was diffusely distributed (Fig. 6F).
Figure 6. Distribution of GFP-labeled Rho GTPases in chondrocytes.
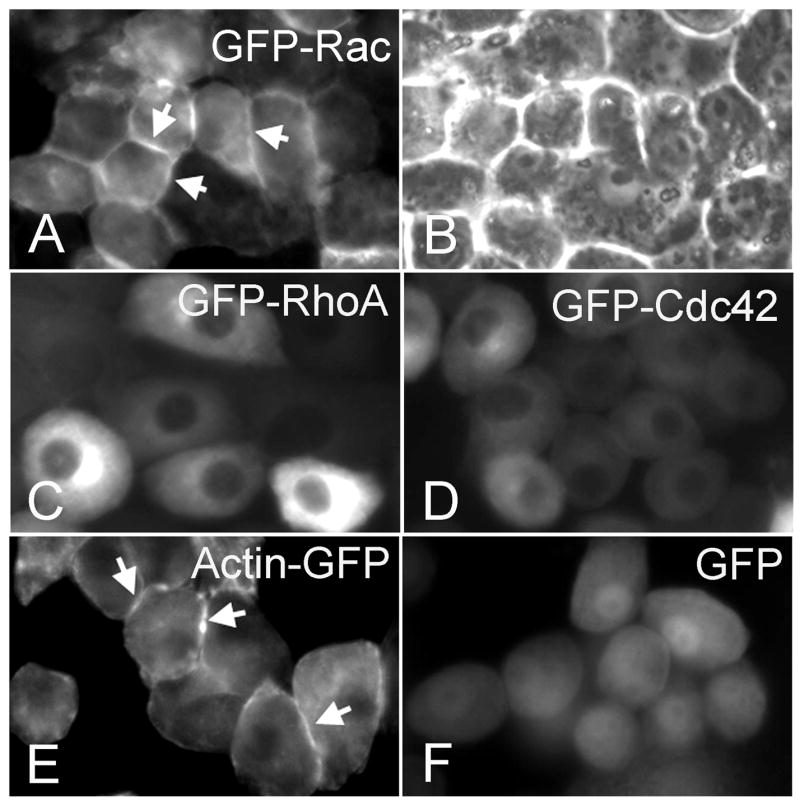
The LS cells were infected with RCAS virus encoding GFP-Rac-1 (A and B), GFP-RhoA (C), GFP-Cdc42 (D), Actin-GFP (E), or GFP (F). The pictures were taken under the fluorescence microscope on day 5. B, Phase contrast picture of the same field in A. Expression of these proteins did not induce significant alterations in chondrocyte function (data not shown). Note that GFP-Rac-1 and Actin-GFP were distributed at the cell membrane (arrows) while GFP-Cdc42 and GFP-RhoA were diffusely localized in cytoplasmic and GFP is found in both cytoplasm and nuclei. Scale bar represents 10 μm.
It has been demonstrated that the active form of small GTPases were concentrated at sites of cytoskeletal network rearrangement where they interacted with cytoskeletal proteins. To further study the interaction between the Rho GTPases and the cytoskeleton, we plated chondrocytes infected with GFP tagged Rho GTPases on coverslips and stained with rhodamine-labeled phalloidin to visualize actin fibers. Figure 7 showed the comparison of GFP-labeled protein distribution with that of F-actin. GFP-Rac-1 mostly co-localized with actin (Fig. 7F) at the cortical cell membrane while, in contrast, GFP-RhoA (Fig. 7C) and GFP-Cdc42 (Fig. 7I) did not.
Figure 7. Comparison of GFP-Rho GTPase localization with F-actin.

The LS cells were infected with RCAS virus encoding GFP-RhoA (A–C), GFP-Rac-1 (D–F), or GFP-Cdc42 (G–I), re-plated onto collagen type I coated coverslips and fixed with 10% formalin 1 hour after plating. The cells were stained with rhodamine-labeled phalloidin (B, E, and H). A, D and G were GFP images of the same fields of B, E and H, respectively. A merged picture demonstrated the co-localization of actin and GFP-Rac-1 (F), which is not seen in under GFP-RhoA or –Cdc42 (C and I). Scale bar represents 10 μm.
Wnt signaling induction of Rac-1 activation
Since only GFP-Rac-1 was seen to co-localize with actin, and only CA-Rac-1 expression was shown to alter cell morphology, we wanted to determine changes in GFP-Rac-1 distribution in response to factors that regulate cell differentiation and morphology. We treated the GFP-Rac-1 expressing cells with ascorbic acid (VC) or Wnt3A. These factors have been reported to modulate the cell shape and function in chondrocytes. [30, 31] Ascorbic acid made the cells less spread and more rounded, while Wnt3A changed the cell shape to flattened and more spread. The dramatic changes in GFP-Rac-1 distribution were consistent with the alterations in cell morphology. Ascorbic acid treatment retained diffuse GFP-Rac-1 distribution (Fig. 8C) while Wnt3A treatment induced a large portion of tagged protein to localize to the spreading edges and borders of the cells (Fig. 8E arrows). Chondrocytes were also infected with Actin-GFP and treated with the same factors. Actin staining in control and VC treated chondrocytes was cortical (Fig. 8B and D). In Wnt3A treated chondrocytes, Actin-GFP staining was more localized to attachment points, spreading edges and cell-cell contacts (Fig. 8F, arrows).
Figure 8. Changes in distribution of GFP-Rac-1 induced by ascorbic acid or Wnt 3A.
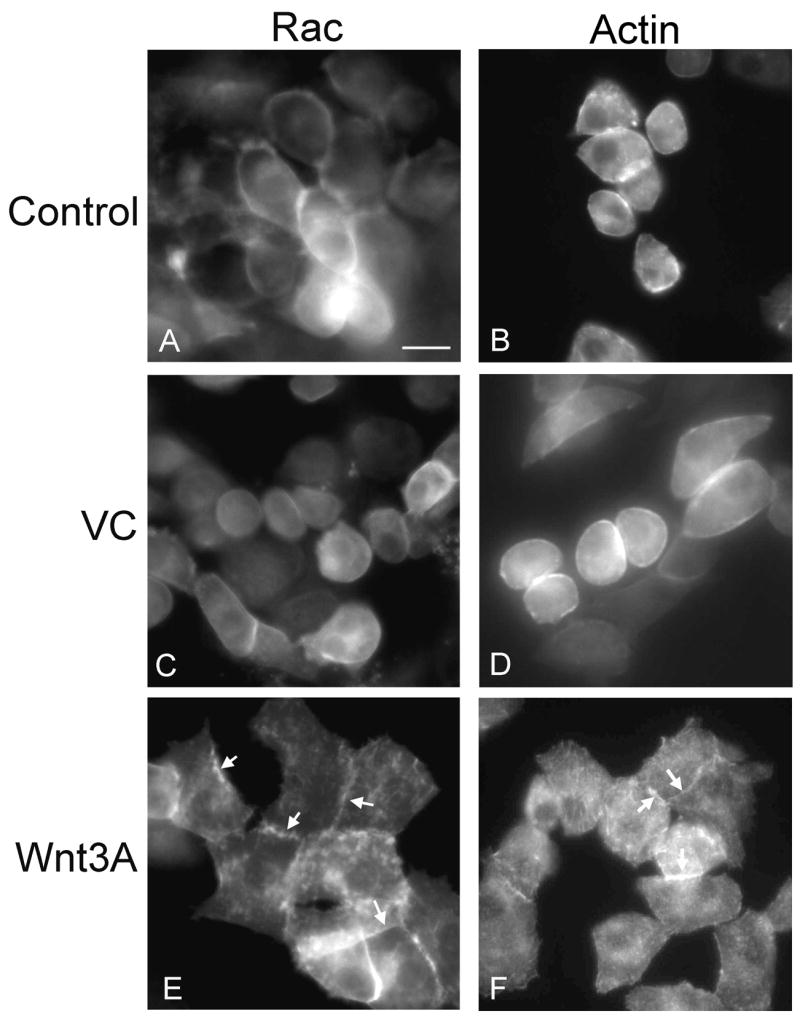
The LS cells were infected with RCAS virus encoding GFP-Rac-1 or Actin-GFP and treated with 10 μg/mL of ascorbic acid (C and D, VC) or 30% of Wnt 3A conditioned medium (E and F, Wnt3A). Two days after treatment, GFP distribution was observed under a fluorescence microscope. Scale bar represents 10 μm.
To further study the possible interaction between Wnt3A and Rac-1 signaling we examined the expression of Tiam1, a Rac-1 specific GEF and known Wnt signaling target gene. [32] We found Tiam1 expression to be induced by Wnt3A when compared to control in lower sternal chondrocytes (Fig. 9A). We further determined whether Wnt3A stimulated Rac-1 activation using a biochemical pull down assay (Fig. 9B). [33] We found Rac-1 activation increased approximately 2.5 fold over control in response to Wnt3A treatment (Fig. 9C). To examine whether Rac-1 activity was necessary for Wnt3A-induced cell morphological changes, we infected chondrocytes with control or DN-Rac-1 RCAS virus and treated the cultures with Wnt3A. Forty-eight hours after the treatment we carried out a cell spreading assay. DN-Rac-1 expressing chondrocytes had diminished cell spreading in response to Wnt3A (Fig. 9D).
Figure 9. Functional interaction between Wnt3A and Rac-1.
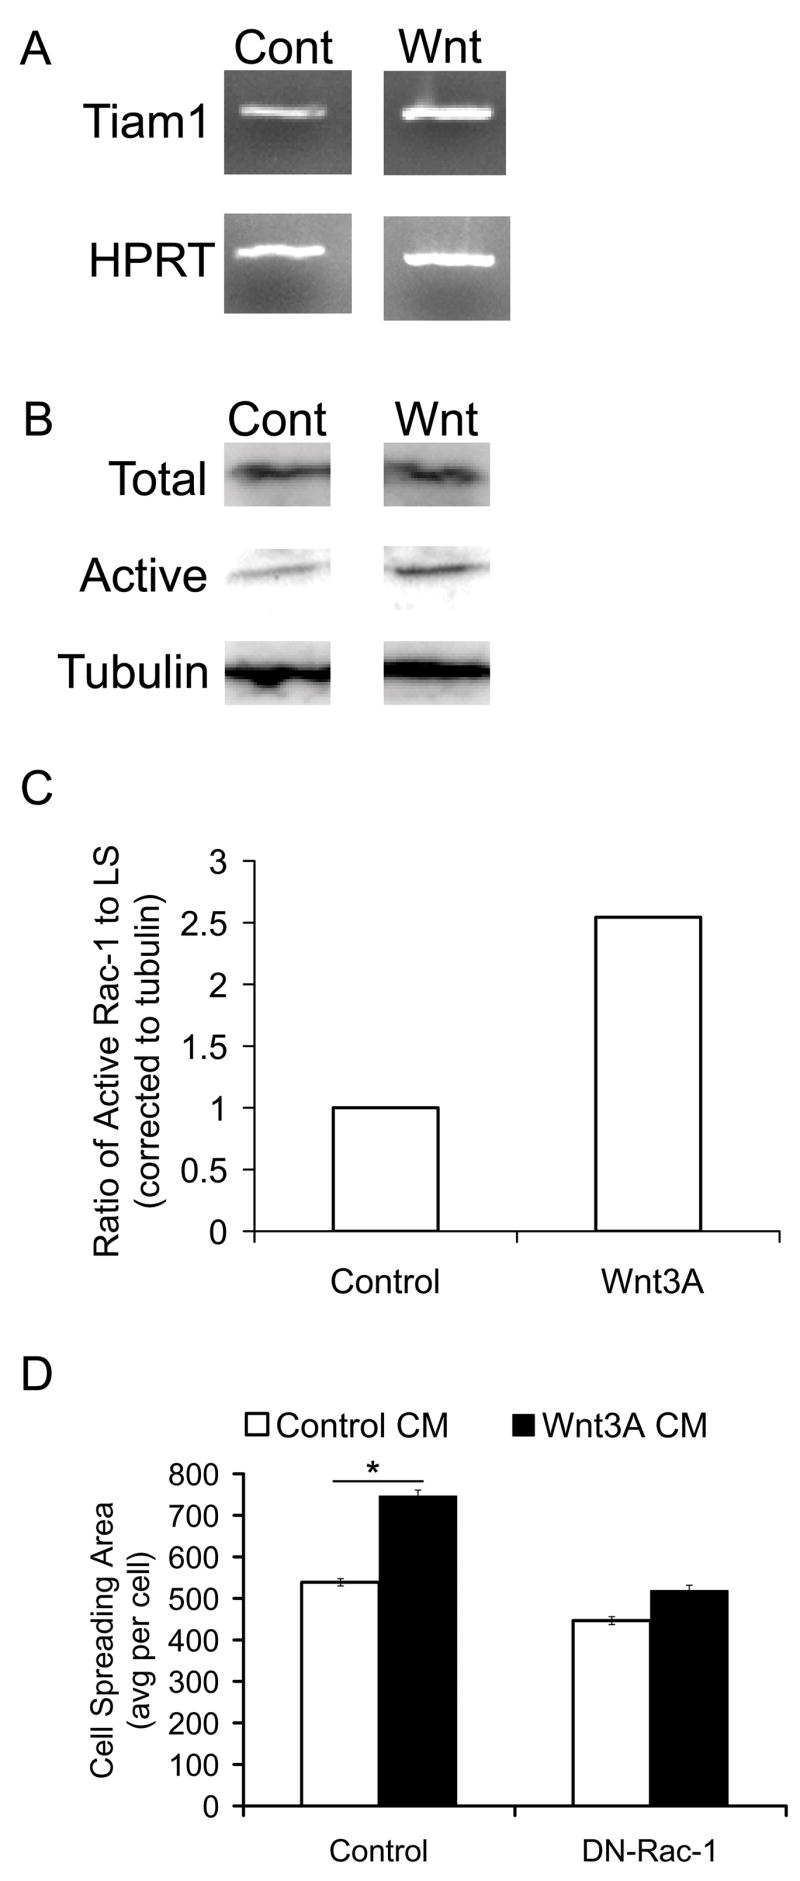
LS cells were treated with 30% of Wnt3A or control conditioned media (CM) for two days. A, RNA was isolated from treated cells and subjected to RT-PCR for Tiam1 and HPRT expression. B, Lysates were also isolated from treated cells subjected to a biochemical pull down assay for active Rac-1 protein (Active). Total lysates were used to immunoblot for total Rac-1 protein (Total) or tubulin as a loading control (Tubulin). C, Densitometric analysis was performed for band intensities using ImageJ. D, LS cells were infected with control or DN-Rac-1 virus and treated with 5% of control (open column) or Wnt3A (closed column) containing conditioned media for one day. Cultures were harvested and subjected to the attachment assay described in Materials and Methods. (* is p < 0.05)
Discussion
The results or our study indicate that Rac-1 exerts significant control on chondrocyte phenotype and function associated with late chondrocyte maturation. We find that Rac-1, Cdc42, and RhoA are present in chondrocytes and that levels of active Rac-1 and Cdc42 increase with maturation. Experimental activation of Rac-1 increases chondrocyte cell volume and MMP production, which are associated with chondrocyte maturation, while forced expression of DN-Rac-1 stimulates proteoglycan production and proliferation, which are characteristic of immature cells. Live imaging of Rho GTPases tagged with GFP reveals that Rac-1 localizes to the cell periphery with actin, and its distribution and activity change in chondrocytes treated with the pro-maturation factor Wnt 3A. Taken together, the data indicate that Rac-1 plays important roles in the regulation of cell morphology and function during chondrocyte maturation.
Rho GTPase activity with maturation
Our studies show that Rac-1 and Cdc42 activities increase with maturation, whereas RhoA activity does not change. We also observe that activation of Rac-1 stimulates hypertrophic phenotype markers such as gene expression of MMP-9 and -13 in primary chondrocytes. These findings are consistent with the previous observation that Rac-1 activation stimulates a hypertrophic phenotype in ATCD5 cells, a chondrogenic cell line. [20] On the contrary, inactivation of Rac-1 increases proteoglycan synthesis, while it decreases alkaline phosphatase activity and gene expression of hypertrophic markers. This is also in line with the findings that deficiency of Rac-1 in cartilage induces a delay of chondrocyte maturation and endochondral ossification. [19] In contrast, Rac-1 null limb micromass cultures have lowered proteoglycan content and levels of collagen type II and aggrecan mRNA. [20, 21] However, the experiment using limb micromass cultures monitors chondrogenic induction, while our experimental system recapitulates chondrocyte maturation. Thus, these two findings indicate that Rac-1 diversely regulates chondrocyte matrix metabolism at the initiation versus late maturation stages.
In previous studies, inhibition of RhoA in ATDC5 cells results in a more rounded cell shape. Overexpression of RhoA inhibits Sox9 expression, stimulates cyclin D1 activation, and suppresses hypertrophy in ATDC5 cells. [16, 17, 34] However, in micromass limb bud cells, RhoA induces Sox9 expression and early chondrocyte differentiation. We do not see an increase in RhoA activity with maturation. Further, activation of RhoA does not strongly affect the chondrocyte cell morphology. It is likely that RhoA has roles in the regulation of early chondrogenic differentiation; such as in the transition from mesenchymal cells to chondrocytes, but does not greatly participate in chondrocyte differentiation once the cells are committed.
Determining the signaling molecules associated with Rac-1 will lead to an improved understanding of its effects on chondrocyte maturation. An important Rac-1 signaling molecule is Tiam1, a GEF specific for Rac-1. [33] Tiam1 is a transcriptional target of the canonical Wnt pathway and is required for β-catenin localization to cell-cell contacts. [32] Tiam1 binds to IRSp53, a scaffold protein which is downstream of Rac-1 and Cdc42, and induces actin filamentation. [35, 36] Correspondingly, DN-Tiam1 expression inhibits Rac-1-dependent cell spreading and alters the localization of IRSp53 in CHO cells. [37] This function could allow Tiam1 a role enhancing the control Rac-1 exerts on cytoskeletal organization. Additionally, Wnt3A stimulates the β-catenin dependent pathway and maturation in chondrocytes. [31] In the present study we demonstrate the ability of Wnt3A to induce Tiam1 expression in chondrocytes. Additionally, Wnt3A increases Rac-1 activation in chondrocytes. These findings suggest that an interaction between Wnt and Rac-1 signaling could also function during the progression of chondrocyte maturation.
Chondrocyte morphology
In this study, we have shown the ability of Rac-1 modulation to produce dramatic changes in chondrocyte morphology. CA-Rac-1 RCAS infection induces chondrocyte enlargement compared to DN-Rac-1 encoding and control cells. Unlike previous reports, a loss of Rac-1 function in our cultures does not strongly inhibit cell spreading, which could be due to the different levels of Rac-1 activity in the chondrocytes used for the experiments. [19–21] We use immature chondrocytes, whereas the cultures in the previous study likely contained immature and mature chondrocytes. Since we use immature chondrocytes, which have low Rac-1 activity, a further decrease in Rac-1 function might not induce a strong effect. Rac-1 is involved in the regulation of cell spreading not only in chondrocytes, but in fibroblasts, endothelial cells, and lymphocytes as well. DN-Rac-1 and -Cdc42 expression inhibit cell spreading in NIH3T3 cells on several substrates [38] and Rac-1 deficiency in fibroblasts causes cell rounding on fibronectin. [19, 27] Further, Rac-1 activation in endothelial cells induces spreading, even in integrin kinase deficient cells. [39]
RhoA, as well as Rac-1, has strong effects on the reorganization of cytoskeletal structures and thus, directs changes in cell shape in various cell types that grow in an anchorage dependent manner. In our study, RhoA also has a mild inductive action on chondrocyte spreading while cells actively proliferate and were fibroblastic in shape. However, when the cultures reach confluence and the cells become rounded or polygonal, the spreading effects of RhoA are attenuated. This indicates that RhoA does not influence the cell shape in well-differentiated chondrocytes. This assumption may also explain the difference between our results and the previous reports in ATDC5 cells. [20] Interestingly, CA-Rac-1 expression has been shown in T-lymphocytes to induce spreading, cytoskeletal reorganization and adhesion, which is not seen under CA-RhoA or CA-Cdc42 expression. [40] Chondrocytes have the unique ability to survive in suspension, which is similar to haematopoietic cells such as T-lymphocytes. Thus, different regulatory mechanisms dependent on Rac-1, but not RhoA, could operate in differentiated chondrocytes.
In addition to these changes in morphology, we show that Rac-1 modulation also alters the chondrocyte’s ability to attach to a variety of substrates. Significantly fewer DN-Rac-1 encoding chondrocytes are able to attach to each substrate. As previously reported, chick sterna chondrocytes attach to collagen type I, collagen type II and fibronectin substrates dependent on β1 integrin. [41] Thus, Rac-1 likely exerts an essential role in β1 integrin-induced adhesion.
Rho GTPases conjugated to GFP demonstrate the localization of each protein in chondrocytes. This method has also been used to show the localization of Rac-1 protein in several cell types. In fibroblasts, GFP-Rac-1, prior to stimulation, is localized around the nucleus and in small foci throughout the cells. Serum stimulation results in lamellipodia formation and relocalization of GFP-Rac-1 to the cell periphery. [29] GFP-Rac-1 co-localizes with cortical actin in chondrocytes, whereas neither GFP-RhoA nor -Cdc42 do, indicating that Rac-1 protein interacts with actin and may regulate organization of actin networks in chondrocytes. Actin stress fibers are well developed in growing chondrocytes of fibroblastic shape. Once the cells differentiate and display a rounded or polygonal shape, polymerized actin proteins no longer form stress fibers and are instead distributed underneath the cell membrane. This distribution is consistent with the cortical actin filamentation seen in chondrocytes in vivo. [5, 6] Interestingly, we do not see co-localization of GFP-Rac-1 with actin fibers in fibroblasts (data not shown). However, we observe similar localization of GFP-Rac-1 and Actin-GFP in chondrocytes that rearrange their cell shape to flattened in response to Wnt3A, a regulatory factor associated with chondrocyte differentiation. These findings also support the idea that Rac-1 is a unique and important molecule in the organization of the cytoskeleton and cell morphology in chondrocytes. This idea is further strengthened by the observation that Rac-1 deficiency in cartilage results in a loss of chondrocyte alignment in the growth plate. [19]
Changes in the distribution of GFP-Rac-1 are induced by Wnt3A. The Wnt/β-catenin pathway has previously been shown to be necessary for growth plate development and endochondral ossification. [42] Activation of Wnt signaling in mature chondrocytes induces hypertrophy, matrix mineralization and MMP-7, -9 and -13 production. [31] In our study, treatment of chondrocytes expressing GFP-Rac-1 with Wnt3A, a Wnt/β-catenin signaling inducing factor, stimulates flattened cell morphology and Rac-1 localization to the cell membrane and cell-cell contacts. Further, dysfunction of Rac-1 inhibits Wnt3A induced morphological changes. Our data indicates that Wnt signaling can induce Rac-1 activation, possibly through an increase in expression of Tiam1, an effector of Rac-1, providing a mechanism for signaling cross-talk. Several groups describe interactions between Wnt signaling and Rac-1 activation in other cell types. [1, 43] Rac-1 inhibition has been shown to decrease Wnt signaling, while overexpression increases it in cancer cell lines. In addition, Rac-1 can increase β-catenin activation in these cells. [44] The data indicate that Wnt/β-catenin and Rac-1 signaling also cross-talk in chondrocytes and can regulate chondrocyte maturation by alterations in both morphology and phenotype.
Our findings demonstrate that Rac-1 modulation stimulates changes in the chondrocyte maturation status, with Rac-1 activation inducing the expression of a mature chondrocyte phenotype. In addition, we describe the presence of Rac-1 at the cell membrane where it colocalizes with actin filaments. We also demonstrate the ability of Rac-1 to respond to the chondrocyte pro-maturation factor Wnt3A. Further studies need to be completed to determine the mechanisms of Rac-1 signaling during chondrocyte differentiation and its interrelation to other chondrogenic signals.
Acknowledgments
We thank Dr. Yoshimi Takai (Osaka University) for his gift of the CA- and DN-GTPase vectors. We are grateful to Ms. Aishah Hargett for great technical assistance. Drs. Vickram Srinivas, Hydar Ali, and Masahiro Iwamoto provided essential guidance and advice. We also thank Dr. Maurizio Pacifici and Dr. Irving Shapiro for critical reading and editing of the manuscript. B. A. K. is supported by a training grant (T32 AR052273) from the National Institute of Arthritis and Musculoskeletal and Skin Diseases. This study is partially supported by NIH grant RO1 AR050507 to M. E.-I.
Footnotes
Publisher's Disclaimer: This is a PDF file of an unedited manuscript that has been accepted for publication. As a service to our customers we are providing this early version of the manuscript. The manuscript will undergo copyediting, typesetting, and review of the resulting proof before it is published in its final citable form. Please note that during the production process errors may be discovered which could affect the content, and all legal disclaimers that apply to the journal pertain.
References
- 1.Rosso SB, Sussman D, Wynshaw-Boris A, Salinas PC. Wnt Signaling Through Dishevelled, Rac and JNK Regulates Dendritic Development. Nature Neuroscience. 2005;8:34–42. doi: 10.1038/nn1374. [DOI] [PubMed] [Google Scholar]
- 2.Poole AR, Kojima T, Yasuda T, Mwale F, Kobayashi M, Laverty S. Composition and Structure of Articular Cartilage. Clinical Orthopaedics and Related Research. 2001;391S:S26–33. doi: 10.1097/00003086-200110001-00004. [DOI] [PubMed] [Google Scholar]
- 3.CE Farnum, WNJ . Growth Plate Cellular Function. In: Buckwalter J, Ehrlich M, Sandell L, Trippel S, editors. Skeletal Morphogenesis and Growth. American Academy of Orthopaedic Surgeons; Rosemont, IL: 1998. pp. 203–223. [Google Scholar]
- 4.Lefebvre V, Smits P. Transcriptional Control of Chondrocyte Fate and Differentiation. Birth Defects Research (Part C) 2005;75:200–212. doi: 10.1002/bdrc.20048. [DOI] [PubMed] [Google Scholar]
- 5.Langelier E, Suetterlin R, Hoemann CD, Aebi U, Buschmann MD. The Chondrocyte Cytoskeleton in Mature Articular Cartilage: Structure and Distribution of Actin, Tubulin and Vimentin Filaments. The Journal of Histochemistry and Cytochemistry. 2000;48:1307–1320. doi: 10.1177/002215540004801002. [DOI] [PubMed] [Google Scholar]
- 6.Idowu BD, Knight MM, Bader DL, Lee DA. Confocal Analysis of Cytoskeletal Organisation Within Isolated Chondrocyte Sub-Populations Cultured in Agarose. The Histochemical Journal. 2000;32:165–174. doi: 10.1023/a:1004095207330. [DOI] [PubMed] [Google Scholar]
- 7.Zwicky R, Baici A. Cytoskeletal Architecture and Cathepsin B Trafficking in Human Articular Chondrocytes. Histochemical Cell Biology. 2000;114:363–372. doi: 10.1007/s004180000199. [DOI] [PubMed] [Google Scholar]
- 8.Hirsch MS, Cook SC, Killiany R, Svoboda KKH. Increased Cell Diameter Precedes Chondrocyte Terminal Differentiation, Whereas Cell-Matrix Attachment Complex Proteins Appear Constant. Anat Rec. 1996;244:284–296. doi: 10.1002/(SICI)1097-0185(199603)244:3<284::AID-AR2>3.0.CO;2-Z. [DOI] [PubMed] [Google Scholar]
- 9.Brown PD, Benya PD. Alterations in Chondrocyte Cytoskeletal Architecture during Phenotypic Modulation by Retinoic Acid and Dihydrocytochalasin B-Induced Expression. Journal of Cell Biology. 1988;106:171–179. doi: 10.1083/jcb.106.1.171. [DOI] [PMC free article] [PubMed] [Google Scholar]
- 10.Benya PD. Modulation and Reexpression of the Chondrocyte Phenotype; Mediation by Cell Shape and Microfilament Modification. Pathology and Immunopathology Research. 1988;7:51–54. doi: 10.1159/000157093. [DOI] [PubMed] [Google Scholar]
- 11.Benya PD, Padilla SR, Nimni ME. Independent Regulation of Collagen Types by Chondrocytes During the Loss of Differentiated Function in Culture. Cell. 1978;15:1313–1321. doi: 10.1016/0092-8674(78)90056-9. [DOI] [PubMed] [Google Scholar]
- 12.Zanetti NC, Solursh M. Induction of Chondrogenesis in Limb Mesenchymal Cultures by Disruption of the Actin Cytoskeleton. Journal of Cell Biology. 1984;99:115–123. doi: 10.1083/jcb.99.1.115. [DOI] [PMC free article] [PubMed] [Google Scholar]
- 13.Olson MF, Ashworth A, Hall A. An Essential Role for Rho, Rac, and Cdc42 GTPases in Cell Cycle Progression Through G1. Science. 1995;269:1270–1272. doi: 10.1126/science.7652575. [DOI] [PubMed] [Google Scholar]
- 14.Jaffe AB, Hall A. Rho GTPases: Biochemistry and Biology. Annual Review Cell Developmental Biology. 2005;21:247–269. doi: 10.1146/annurev.cellbio.21.020604.150721. [DOI] [PubMed] [Google Scholar]
- 15.Takai Y, Sasaki T, Matozaki T. Small GTP-Binding Proteins. Physiological Reviews. 2001;81:153–208. doi: 10.1152/physrev.2001.81.1.153. [DOI] [PubMed] [Google Scholar]
- 16.Wang G, Woods A, Sabari S, Pagnotta L, Stanton LA, Beier F. RhoA/ROCK Signaling Suppresses Hypertrophic Chondrocyte Differentiation. Journal of Biological Chemistry. 2004;279:13205–13214. doi: 10.1074/jbc.M311427200. [DOI] [PubMed] [Google Scholar]
- 17.Woods A, Wang G, Beier F. RhoA/ROCK Signaling Regulates Sox9 Expression and Actin Organization during Chondrogenesis. Journal of Biological Chemistry. 2005;280:11626–11634. doi: 10.1074/jbc.M409158200. [DOI] [PubMed] [Google Scholar]
- 18.Wang W, XU J, Du B, Kirsch T. Role of the Progressive Ankylosis Gene (ank) in Cartilage Mineralization. Molecular and Cellular Biology. 2005;25:312–323. doi: 10.1128/MCB.25.1.312-323.2005. [DOI] [PMC free article] [PubMed] [Google Scholar]
- 19.Wang G, Woods A, Agoston H, Ulici V, Glogauer M, Beier F. Genetic Ablation of Rac1 in Cartilage Results in Chondrodysplasia. Developmental Biology. 2007;306:612–623. doi: 10.1016/j.ydbio.2007.03.520. [DOI] [PubMed] [Google Scholar]
- 20.Wang G, Beier F. Rac1/Cdc42 and RhoA GTPases Antagonistically Regulate Chondrocyte Proliferation, Hypertrophy and Apoptosis. Journal of Bone and Mineral Research. 2005;20:1022–1031. doi: 10.1359/JBMR.050113. [DOI] [PubMed] [Google Scholar]
- 21.Woods A, Wang G, Dupuis H, Shao Z, Beier F. Rac1 Signaling Stimulates N-Cadherin Expression, Mesenchymal Condensation and Chondrogenesis. Journal of Biological Chemistry. 2007;282:23500–23508. doi: 10.1074/jbc.M700680200. [DOI] [PubMed] [Google Scholar]
- 22.Gao Y, Dickerson JB, Guo F, Zheng J, Zheng Y. Rational Design and Characterization of a Rac GTPase-specific Small Molecule Inhibitor. Proceedings of the National Academy of Sciences. 2004;101:7618–7623. doi: 10.1073/pnas.0307512101. [DOI] [PMC free article] [PubMed] [Google Scholar]
- 23.Enomoto-Iwamoto M, Iwamoto M, Mukudai Y, Kawakami Y, Nohno T, Higuchi Y, Takemoto S, Ohuchi H, Noji S, Kurisu K. Bone Morphogenetic Protein Signaling Is Required for Maintenance of Differentiated Phenotype, Control of Proliferation, and Hypertrophy in Chondrocytes. Journal of Cell Biology. 1998;140:409–418. doi: 10.1083/jcb.140.2.409. [DOI] [PMC free article] [PubMed] [Google Scholar]
- 24.Subauste MC, Von Herrath M, Bernard V, Chamberlain CE, Chuang TH, Chu K, Bokoch GM, Hahn KM. Rho Family Proteins Modulate Rapid Apoptosis Induced by Cytotoxic T Lymphocytes and Fas. Journal of Biological Chemistry. 2000;275:9125–9133. doi: 10.1074/jbc.275.13.9725. [DOI] [PubMed] [Google Scholar]
- 25.Iwamoto M, Kitagaki J, Tamamura Y, Gentili C, Koyama E, Enomoto H, Komori T, Pacifici M, Enomoto-Iwamoto M. Runx2 Expression and Action in Chondrocytes are Regulated by Retinoid Signaling and Parathyroid Hormone-Related Peptide (PTHrP) Osteoarthritis and Cartilage. 2003;11:6–15. doi: 10.1053/joca.2002.0860. [DOI] [PubMed] [Google Scholar]
- 26.Sato N, Matsuda K, Sakuma C, Foster DN, Oppenheim RW, Yaginuma H. Regulated Gene Expression in the Chicken Embryo by Using Replication-Competent Retroviral Vectors. Journal of Virology. 2002;76:1980–1985. doi: 10.1128/JVI.76.4.1980-1985.2002. [DOI] [PMC free article] [PubMed] [Google Scholar]
- 27.Guo F, Debbida M, Yang L, Williams DA, Zheng Y. Genetic Deletion of Rac1 GTPase Reveals Its Critical Role in Actin Stress Fiber Formation and Focal Adhesion Complex Assembly. Journal of Biological Chemistry. 2006;281:18652–18659. doi: 10.1074/jbc.M603508200. [DOI] [PubMed] [Google Scholar]
- 28.del Pozo MA, Vicente-Manzanares M, Tejedor R, Serrador JM, Sánchez-Madrid F. Rho GTPases Control Migration and Polarization of Adhesion Molecules and Cytoskeletal ERM Components in T Lymphocytes. European Journal of Immunology. 1999;29:3609–3620. doi: 10.1002/(SICI)1521-4141(199911)29:11<3609::AID-IMMU3609>3.0.CO;2-S. [DOI] [PubMed] [Google Scholar]
- 29.Kraynov VS, Chamberlain C, Bokoch GM, Schwartz MA, Slabaugh S, Hahn KM. Localized Rac Activation Dynamics Visualized in Living Cells. Science. 2000;290:333–337. doi: 10.1126/science.290.5490.333. [DOI] [PubMed] [Google Scholar]
- 30.Leboy PS, Vaias L, Uschmann B, Golub E, Adams SL, Pacifici M. Ascorbic Acid Induces Alkaline Phosphatase, Type X Collagen, and Calcium Deposition in Cultured Chick Chondrocytes. Journal of Biological Chemistry. 1989;264:17281–17286. [PubMed] [Google Scholar]
- 31.Tamamura Y, Otani T, Kanatani N, Koyama E, Kitagaki J, Komori T, Yamada Y, Constantini F, Wakisaka S, Pacifici M, Iwamoto M, Enomoto-Iwamoto M. Developmental Regulation of Wnt/β-Catenin Is Required for Growth Plate Assembly, Cartilage Integrity, and Endochondral Ossification. Journal of Biological Chemistry. 2005;280:19185–19195. doi: 10.1074/jbc.M414275200. [DOI] [PubMed] [Google Scholar]
- 32.Malliri A, Rygiel TP, van der Kammen RA, Song JY, Engers R, Hurlstone AF, Clevers H, Collard JG. The Rac Activator Tiam1 Is a Wnt-Responsive Gene That Modifies Intenstinal Tumor Development. Journal of Biological Chemistry. 2006;281:543–548. doi: 10.1074/jbc.M507582200. [DOI] [PubMed] [Google Scholar]
- 33.Michiels F, Habets G, Stam J, van der Kammen R, JG C. A Role for Rac in Tiam1-Induced Membrane Ruffling and Invasion. Nature. 1995;375:338–340. doi: 10.1038/375338a0. [DOI] [PubMed] [Google Scholar]
- 34.Woods A, Beier F. RhoA/ROCK Signaling Regulates Chondrogenesis in a Context-Dependent Manner. Journal of Biological Chemistry. 2006;281:13134–13140. doi: 10.1074/jbc.M509433200. [DOI] [PubMed] [Google Scholar]
- 35.Connolly BA, Rice J, Feig LA, Buchsbaum RJ. Tiam1-IRSp53 Complex Formation Directs Specificity of Rac-Mediated Actin Cytoskeleton Regulation. Molecular and Cellular Biology. 2005;25:4602–4614. doi: 10.1128/MCB.25.11.4602-4614.2005. [DOI] [PMC free article] [PubMed] [Google Scholar]
- 36.Miki H, Yamaguchi H, Suetsugu S, Takenawa T. IRSp53 Is an Essential Intermediate Between Rac and WAVE in the Regulation of Membrane Ruffling. Nature. 2000;408:732–735. doi: 10.1038/35047107. [DOI] [PubMed] [Google Scholar]
- 37.Kraemer A, Goodwin M, Verma S, Yap AS, Ali RG. Rac Is a Dominant Regulator of Cadherin-Directed Actin Assembly that Is Activated by Adhesive Ligation Independently of Tiam-1. American Journal of Physiology- Cell Physiology. 2006;292:C1061–1069. doi: 10.1152/ajpcell.00073.2006. [DOI] [PubMed] [Google Scholar]
- 38.Price LS, Leng J, Schwartz MA, Bokoch GM. Activation of Rac and Cdc42 by Integrins Mediates Cell Spreading. Molecular Biology of the Cell. 1998;9:1863–1871. doi: 10.1091/mbc.9.7.1863. [DOI] [PMC free article] [PubMed] [Google Scholar]
- 39.Boulter E, Grall D, Cagnol S, Van Obberghen-Schilling E. Regulation of Cell-Matrix Adhesion Dynamics and Rac-1 by Integrin Linked Kinase. FASEB Journal. 2006;20:E640–651. doi: 10.1096/fj.05-4579fje. [DOI] [PubMed] [Google Scholar]
- 40.D’Souza-Schorey C, Boettner B, Van Aelst L. Rac Regulates Integrin-Mediated Spreading and Increased Adhesion of T Lymphocytes. Molecular and Cellular Biology. 1998;18:3936–3946. doi: 10.1128/mcb.18.7.3936. [DOI] [PMC free article] [PubMed] [Google Scholar]
- 41.Enomoto M, Leboy PS, Menko AS, Boettiger D. β1 Integrins Mediate Chondrocyte Interaction with Type I Collagen, Type II Collagen and Fibronectin. Experimental Cell Research. 1993;205:276–285. doi: 10.1006/excr.1993.1087. [DOI] [PubMed] [Google Scholar]
- 42.Enomoto-Iwamoto M, Kitagaki J, Koyama E, Tamamura Y, Wu C, Kanatani N, Koike T, Okada H, Komori T, Yoneda T, Church V, Francis-West P, Kurisu K, Nohno T, Pacifici M, Iwamoto M. The Wnt Antagonist Frzb-1 Regulates Chondrocyte Maturation and Long Bone Development during Limb Skeletogenesis. Developmental Biology. 2002;251:142–156. doi: 10.1006/dbio.2002.0802. [DOI] [PubMed] [Google Scholar]
- 43.Habas R, Dawid IB, He X. Coactivation of Rac and Rho by Wnt/Frizzled Signaling Is Required for Vertebrate Gastrulation. Genes & Development. 2003;17:295–309. doi: 10.1101/gad.1022203. [DOI] [PMC free article] [PubMed] [Google Scholar]
- 44.Esufali S, Bapat B. Cross-Talk Between Rac1 GTPase and Dysregulated Wnt Signaling Pathway Leads to Cellular Redistribution of β-Catenin and TCF/LEF-Mediated Transcriptional Activation. Oncogene. 2004;23:8260–8271. doi: 10.1038/sj.onc.1208007. [DOI] [PubMed] [Google Scholar]