

Abstract
An important indicator of osteoarthritis (OA) progression is the loss of proteoglycan (PG) aggregates from the cartilage tissue. Using the indentation creep test, two analytical methods, as previously developed by Lu et al (2007), for predicting the fixed charge density (FCD) of goat knee articular cartilage in the normal (control) and degenerated states were compared: (1) a “dual-stage” method to calculate FCD from the mechanical properties of the tissue when tested in isotonic and hypertonic solutions; and (2) a “single-stage” method to predict FCD [as in (1)] assuming an intrinsic Poisson's ratio of 0.05 in the hypertonic state. A biochemical analysis using 1,9-dimethylmethylene blue (DMMB) assay was conducted to directly measure PG content, and hence FCD. The association between the FCD and the aggregate modulus of the tissue was also explored. The mean (±SD) FCD values measured using the dual-stage method were the closest (control: 0.129±0.039; degenerated: 0.046±029) to the DMMB results (control: 0.125±0.034; degenerated: 0.057±0.024) as compared to those of the single-stage method (control: 0.147±0.035; degenerated: 0.063±0.026). The single-stage method was the most reliable (r2=0.81) when compared to the dual-stage method (r2=0.79). A prediction of FCD from the aggregate modulus generated the least reliable FCD prediction (r2=0.68). Because both the dual- and single-stage methods provided reliable FCD estimates for normal and degenerated tissue, the less time-consuming single-stage method was concluded to be the ideal technique for predicting FCD and hence PG content of the tissue.
Keywords: Articular Cartilage, Mechanical Properties, Indentation, Knee, Fixed Charge Density, Proteoglycan
1. Introduction
Methods to detect early signs of osteoarthritis (OA) are essential for studying disease progression and response to treatment. One of the physiological indications of early stage OA is a decrease in proteoglycan (PG) content, which in turn decreases the fixed charge density (FCD) of the tissue (Mow et al., 2005, Hasler et al., 2000). Therefore, accurate measurements of the FCD may provide a useful marker of OA.
A moderate association between the aggregate modulus and FCD has been previously established (Mow et al., 1989, Sah et al., 1997). However, cartilage is a triphasic material, and a more accurate prediction is possible by measuring both the intrinsic and apparent material properties of the tissue via indentation creep tests (Lu et al., 2004). When cartilage is compressed, the load is shared by the elasticity of the solid matrix and the Donnan osmotic pressure of the interstitial fluid generated by the FCD (Lai et al., 1991). The intrinsic properties describe how the matrix responds to the load without the osmotic effect while the apparent properties evaluate both factors. The “dual-stage” approach requires two consecutive indentation creep tests; one test performed with the tissue bathed in a hypertonic solution to remove the ion concentration imbalance and another in isotonic (physiological) solution (Lu et al., 2004, Lu et al., 2007). Recently, Lu et al (2007) demonstrated that it is feasible to predict the FCD of normal cartilage specimens using one indentation test by assuming an intrinsic Poisson's ratio of 0.05 (Lu et al., 2007, Chahine et al., 2004). Because this “single-stage” approach is more efficient, comparing the accuracy and reliability of both methods in healthy and degenerated samples are essential. The objective of this study was to compare these two approaches to determine which is optimal for predicting the FCDs of normal and degenerated osteochondral specimens. The resulting FCDs were compared to those determined using 1,9-dimethylmethylene blue (DMMB) assay (Homer et al., 1993). In addition, the association between the FCD and the biphasic aggregate modulus of the tissue was also determined.
2. Materials and Methods
2.1 Specimen Preparation
Pairs of osteochondral specimens from the right and left medial tibial plateaus of seven skeletally mature Nubian goats were harvested. The specimens were wrapped in gauze soaked with 0.9% NaCl irrigation solution and stored at −20°C until the day of testing.
2.2 Cartilage Degradation
One specimen from each pair was randomly selected to undergo chemical degradation to reduce PGs. The contralateral specimen served as a normal control. PGs were removed by incubating the specimen in 2.5 units of chondroitinase ABC at 37°C for 24 hours (Basalo et al., 2004). Control specimens were submersed in a 0.15M NaCl PBS/EDTA solution with a standard protease inhibitor (PI) cocktail (2mM EDTA, 5mM benzamidine, 7.18mM N-ethyl-maleimide, 1.39mM PMSF) (Lu et al., 2004) for 24 hours.
2.3 Indentation Testing
Indentation creep tests were performed on an ElectroForce 3200 series test system (Bose, Minnetonka, MN) using a 50g load cell (accuracy ±0.5%; Model 31; Honeywell Sensotec Sensors, Columbus, OH) and a high resolution displacement sensor (resolution = 0.02 mm; U5C: Lion Precision, Shoreview MN). (Fig. 1). The specimens were positioned normal to a porous indenter (0.75mm radius, pore size = 20μm; porosity = 40%; Martin Kurz & Company; Mineola, NY). The indentation tests were performed on the cartilage surface that corresponded to the weight-bearing region if the knee were at 60° flexion (Fig. 1) (Roemhildt et al., 2006, Holden et al., 1994). The specimen was first submersed in a hypertonic solution (2M NaCl PBS+PI solution) at room temperature. A 3.5g tare load was applied for 15 minutes followed by a 10.0g test load for 2.5 hours (Athanasiou et al., 1991). The step loads were applied at a rate of 10g per second. The hypertonic solution was replaced with isotonic solution (0.15M NaCl PBS+PI solution) for 2 hours to allow full recovery (Lu et al., 2004). The indentation protocol was repeated in the isotonic solution at the same test location.
Fig 1.

Schematic of indentation testing apparatus. The ELF system was situated on a vibration isolation table to provide a stable surface for the experiments. The system consisted of a linear actuator to which the load cell was attached. A high-resolution displacement transducer (1mm full scale; accuracy ±0.4%) was used to measure the tissue displacements during the indentation test. The semi-spherical testing chamber provided infinitesimal position adjustments so that the specimen surface could easily be positioned orthogonal to the indenter tip. After the specimen was firmly adhered within the chamber using an adhesive, an arthroscope (not shown) was used to magnify (10×) and view the orientation of the cartilage test site relative to the indenter tip. The sample was adjusted until the flat tip was parallel to the articular surface.
2.4 Cartilage thickness measurements
Following indentation testing, the thickness of cartilage in 0.15M solution was measured using a needle probe attached to a 250g load cell (accuracy ±0.5%; Model 31; Honeywell Sensotec Sensors, Columbus, OH) (Hoch et al., 1983, Rasanen and Messner, 1996, Roemhildt et al., 2006). The swelling displacement was obtained by taking the difference between the displacement values of cartilage in 2M and 0.15M solutions at tare equilibrium.
2.5 Biochemical assay
A 3mm diameter, full thickness cartilage core encompassing the indentation site was isolated, weighed, and digested with papain in a 0.1% DL-Cysteine digestion buffer at 60°C. DMMB dye (16mg/L) was applied to the digested sample (Homer et al., 1993). Absorbance readings at 520nm wavelength were obtained with a spectrophotometer (Packard Bioscience, Waltham MA) and plotted against a standard curve to ascertain the GAG content (mg/L) per 1g of cartilage (wet weight).
2.6 Histology
Following indentation testing, the control and degenerated samples from two animals were processed for histology. Following decalcification, three sagittal slices (6μm thick) were obtained, mounted on slides, and stained with safranin-O/fast green to qualitatively determine the extent of PG loss (Rosenberg, 1971).
2.7 Data Analysis
Data from the indentation and thickness tests were analyzed using software (“Indenter_1”) developed by Mow et al. (Mow et al., 1989). The following mathematical relations were utilized to determine FCD (Lu et al., 2007):
| (1) |
| (2) |
| (3) |
Gi and λi and Ga and λa are the Lame constants for the intrinsic (solid matrix) and the apparent (solid matrix and osmotic pressure) situations, respectively. R is the universal gas constant, T is room temperature, C* is the 0.15M bathing concentration, ϕw is the assumed water volume fraction (= 0.8), and C0F is the FCD in mEq/ml (Lu et al., 2004). For the single-stage approach, ψi=0.05 was assumed (Lu et al., 2007, Chahine et al., 2004).
The FCDs of the samples were calculated from the DMMB measured GAG values using Equation 4 (Shapiro et al., 2002, Bashir et al., 1999).
| (4) |
A two-way repeated measures analysis of variance (ANOVA) was used to compare the FCD values between techniques (DMMB, single-stage, dual-stage) and cartilage status (control, degenerated). Regression analyses were utilized to determine which method provided the most reliable FCD predictions using DMMB as the gold standard. Two-way ANOVA was also used to compare the aggregate moduli between cartilage status and external solution concentration (0.15M vs. 2M). All pair-wise comparisons were performed using the Holm-Sidak method.
3. Results
3.1 FCD values
The FCD values of the specimens predicted from the single- and dual-stage methods were not significantly different from the DMMB measurements (Table 1; p=0.612). On average, the mean value of the single-stage results was only slightly greater than those of the dual-stage and DMMB results for both control and degenerated tissue. For all methods, the FCD of the degenerated specimens were significantly less than that of the control specimens (p<0.001).
Table 1.
Mean (± standard deviation) swelling displacement per thickness values of the control and degenerated articular cartilage specimens, and the mean FCD values determined from the DMMB assay and the dual- and single-stage methods.
| Δd/thickness (%) | FCD DMMB (mEq/ml) | FCD Dual-stage (mEq/ml) | FCD Single-stage (mEq/ml) | |
|---|---|---|---|---|
| Control cartilage | 3.5±2.2 | 0.13±0.034 | 0.13±0.039 | 0.15±0.035 |
| Degen. cartilage | 14.0±7.2 | 0.06±0.024 | 0.05±0.029 | 0.06±0.026 |
3.2 Regression Analyses
Regression analysis revealed that there was a highly significant relationship between the DMMB FCD values and those predicted with either the single- (r2=0.81) or dual-stage tests (r2=0.79) (Fig. 2). The correlation between the apparent aggregate modulus and the DMMB FCD values was significant, though more variable (r2=0.68) (Fig. 2).
Fig 2.
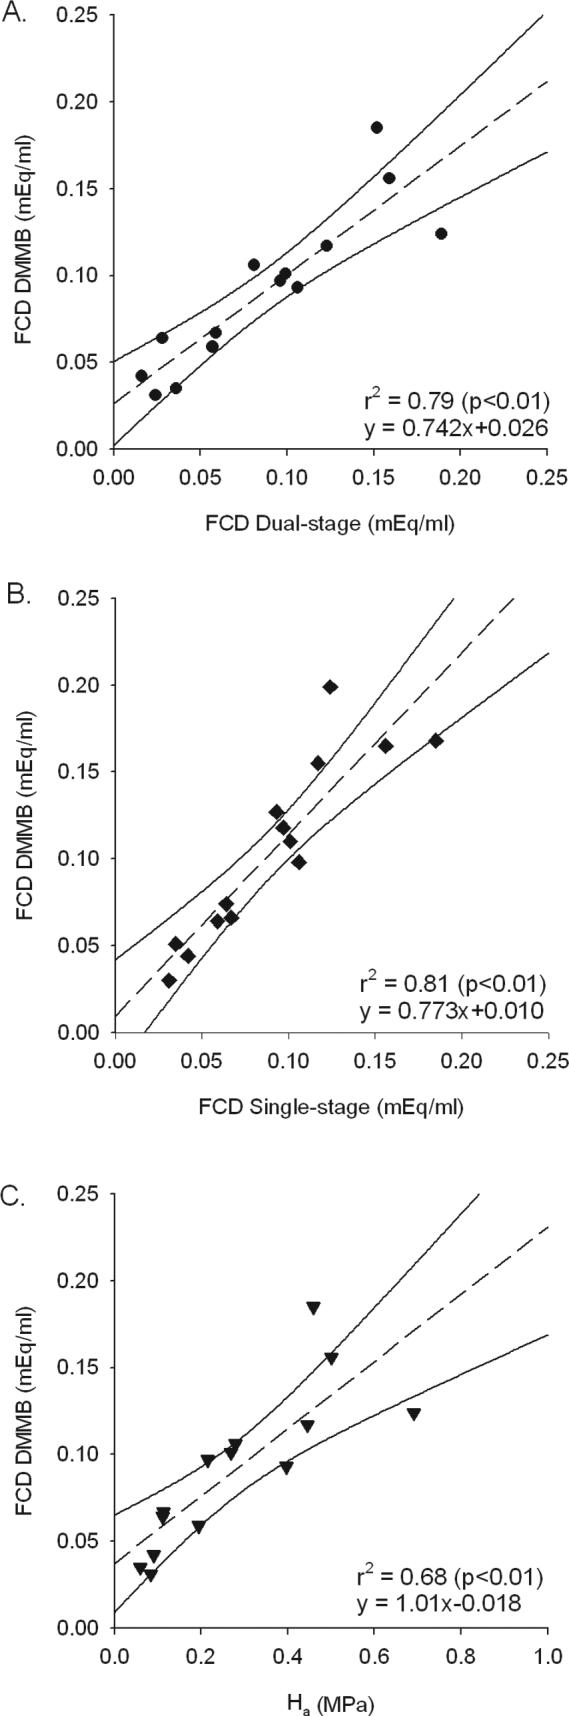
Linear regression analyses of FCD determined by DMMB assay and that predicted using: A. the dual-stage method; B. the single-stage method; and C. aggregate modulus.
3.3 Structural properties
The mean aggregate moduli were affected by the cartilage status and the concentration of the bath (cartilage status by concentration interaction: p=0.004) (Table 2). When tested in the physiologic solution, there was a highly significant difference between the control and degenerated specimens (p<0.001). The mean value of the apparent aggregate modulus was 69% less in the degenerated specimens. However, there was no difference (p=0.07) between the control and degenerated specimens when tested in the hypertonic solution.
Table 2.
Average mechanical properties in control and degenerated articular cartilage specimens.
| Properties | Thickness (mm) | Ha (MPa) | G (MPa) | ν | |
|---|---|---|---|---|---|
| Normal cartilage | Intrinsic | 1.062±0.2596 | 0.19±0.061 | 0.06±0.030 | 0.25±0.081 |
| Apparent | 1.099±0.2560 | 0.43±0.155 | 0.08±0.031 | 0.39±0.045 | |
| Degen cartilage | Intrinsic | 0.763±0.3546 | 0.08±0.033 | 0.03±0.017 | 0.23±0.107 |
| Apparent | 0.877±0.3689 | 0.13±0.074 | 0.04±0.020 | 0.30±0.090 | |
3.4 Histology
The treated osteochondral specimens exhibited less PG staining than controls (Fig. 3).
Fig. 3.

Safranin O/Fast Green staining of slices taken from the osteochondral specimens of two animals demonstrates that those treated with chondroitinase ABC had less PG than the control specimens: A. Goat 1 Control (DMMB FCD=0.156mEq/ml); B. Goat 1 Treated (DMMB FCD=0.059mEq/ml); C. Goat 7 Control (DMMB FCD=0.185mEq/ml); D. Goat 7 Treated (DMMB FCD=0.100mEq/ml).
4. Discussion
Evaluations of the two approaches to predict the FCD revealed that both methods provided an accurate FCD prediction. Furthermore, r2 values between both the dual-stage and single-stage methods and the DMMB measure (assumed to be the gold standard) verified that the time-efficient single-stage creep test provides a reliable FCD prediction. Therefore, obtaining the intrinsic properties with the two-stage approach was not necessary.
All methods demonstrated that the loss of PGs in degenerated cartilage resulted in lower FCD values. Consistent with previous findings, these methods showed that a reduction of PGs resulted in the cartilage's decreased ability to resist compression as was observed in degenerated cartilage (Setton et al., 1993, Korhonen et al., 2003, Guilak et al., 1994, Akizuki et al., 1987, Armstrong and Mow, 1982). The decrease in negative charge decreased the resistance to fluid flow in cartilage and thus lowered its resistance to compression.
Because hypertonic conditions prevented specimens from appropriately resisting compressive loads, specimens in the 2M solution generated greater equilibrium creep displacements. Such hypertonic concentrations decreased the osmotic pressure of the interstitial fluid so that only the solid matrix could support the load. Consistent with previous reports, isotonic solutions produced smaller equilibrium creep displacements because the interstitial fluid within the tissue helped to resist compression (Lu et al., 2004). Greater creep displacements were observed in degenerated cartilage. Due to the reduction of PGs, they exhibited a decrease in cartilage stiffness and were unable to resist applied loads, as reported by others (Lane et al., 1979). Our results demonstrate that the reduction of PGs in degenerated cartilage is associated with a decrease in aggregate modulus (apparent), which provides an indirect measure of PG content (Gu et al., 1993, Gu et al., 1998, Soltz and Ateshian, 1998, Mow et al., 1984). Average aggregate modulus (apparent) for the degenerated specimens was lower than that of control tissue. Apparent aggregate modulus values were greater than intrinsic aggregate modulus values, which is consistent with previous studies (Chahine et al., 2005). For specimens bathed in hypertonic solutions, the triphasic response is disrupted because the fluid phase is no longer available to respond to the compressive loading. However, it is also interesting to note that the mean intrinsic modulus of the degenerated samples was lower than that of the control group. This finding suggests that the mechanical properties of cartilage may depend on PGs through other mechanisms besides the osmotic effect. It is possible that the macromolecules of PG separate and tense the collagen fibers, inducing a pre-stress in the collagen network (Zhu et al., 1993). It is also possible that the hypertonic solution did not completely remove the osmotic pressure (Lu et al, 2004).
There are several study limitations that should be considered. DMMB provides an indirect method to measure the FCD, which we assumed was the gold standard. The time for specimen processing and indentation testing was long, though protease inhibitors were used to minimize cartilage degradation. Zonal reductions of PG content could also affect FCD predictions (Fig. 3). An animal model in which different stages of OA are induced could possibly be used to address this question. For the single-stage testing, we assumed that the intrinsic Poisson's ratio was 0.05 (Chahine et al., 2004). We performed a sensitivity study which demonstrated that varying the intrinsic Poisson's ratio to 0.02 and 0.08 would produce ±1% and ±2.5% changes in the predicted FCD values of control and PG-depleted specimens, respectively.
We conclude that the less time consuming single stage method is sufficient for predicting the FCD and hence PG content of the tissue.
Acknowledgements
This work was funded by the National Institutes of Health; AR049199. The authors also acknowledge the help of Nigel Gomez, M.S. and Koosha Aslani, M.S.
Footnotes
Publisher's Disclaimer: This is a PDF file of an unedited manuscript that has been accepted for publication. As a service to our customers we are providing this early version of the manuscript. The manuscript will undergo copyediting, typesetting, and review of the resulting proof before it is published in its final citable form. Please note that during the production process errors may be discovered which could affect the content, and all legal disclaimers that apply to the journal pertain.
References
- Akizuki S, Mow VC, Muller F, Pita JC, Howell DS. Tensile properties of human knee joint cartilage. II. Correlations between weight bearing and tissue pathology and the kinetics of swelling. Journal of Orthopaedic Research. 1987;5:173–186. doi: 10.1002/jor.1100050204. [DOI] [PubMed] [Google Scholar]
- Armstrong CG, Mow VC. Variations in the intrinsic mechanical properties of human articular cartilage with age, degeneration, and water content. Journal of Bone and Joint Surgery - Am. 1982;64:88–94. [PubMed] [Google Scholar]
- Athanasiou KA, Rosenwasser MP, Buckwalter JA, Malinin TI, Mow VC. Interspecies comparisons of in situ intrinsic mechanical properties of distal femoral cartilage. Journal of Orthopaedic Research. 1991;9:330–340. doi: 10.1002/jor.1100090304. [DOI] [PubMed] [Google Scholar]
- Basalo IM, Mauck RL, Kelly TA, Nicoll SB, Chen FH, Hung CT, Ateshian GA. Cartilage interstitial fluid load support in unconfined compression following enzymatic digestion. Journal of Biomedical Engineering. 2004;126:779–786. doi: 10.1115/1.1824123. [DOI] [PMC free article] [PubMed] [Google Scholar]
- Bashir A, Gray ML, Hartke J, Burstein D. Nondestructive imaging of human cartilage glycosaminoglycan concentration by MRI. Magnetic Resonance in Medicine. 1999;41:857–865. doi: 10.1002/(sici)1522-2594(199905)41:5<857::aid-mrm1>3.0.co;2-e. [DOI] [PubMed] [Google Scholar]
- Chahine NO, Chen FH, Hung CT, Ateshian GA. Direct measurement of osmotic pressure of glycosaminoglycan solutions by membrane osmometry at room temperature. Biophysics Journal. 2005;89:1543–1550. doi: 10.1529/biophysj.104.057315. [DOI] [PMC free article] [PubMed] [Google Scholar]
- Chahine NO, Wang CC, Hung CT, Ateshian GA. Anisotropic strain-dependent material properties of bovine articular cartilage in the transitional range from tension to compression. Journal of biomechanics. 2004;37:1251–1261. doi: 10.1016/j.jbiomech.2003.12.008. [DOI] [PMC free article] [PubMed] [Google Scholar]
- Gu WY, Lai WM, Mow VC. Transport of fluid and ions through a porous-permeable charged-hydrated tissue, and streaming potential data on normal bovine articular cartilage. Journal of Biomechanics. 1993;26:709–723. doi: 10.1016/0021-9290(93)90034-c. [DOI] [PubMed] [Google Scholar]
- Gu WY, Lai WM, Mow VC. A mixture theory for charged-hydrated soft tissues containing multi-electrolytes: passive transport and swelling behaviors. Journal of Biomechanical Engineering. 1998;120:169–180. doi: 10.1115/1.2798299. [DOI] [PubMed] [Google Scholar]
- Guilak F, Meyer BC, Ratcliffe A, Mow VC. The effects of matrix compression on proteoglycan metabolism in articular cartilage explants. Osteoarthritis and Cartilage. 1994;2:91–101. doi: 10.1016/s1063-4584(05)80059-7. [DOI] [PubMed] [Google Scholar]
- Hasler EM, Herzog W, Wu JZ, Muller W, Wyss U. Articular cartilage biomechanics: Theoretical models, material properties, and biosynthetic response. Critical Reviews in Biomedical Engineering. 2000;27:415–488. [PubMed] [Google Scholar]
- Hoch DH, Grodzinsky AJ, Koob TJ, Albert ML, Eyre DR. Early changes in material properties of rabbit articular cartilage after meniscectomy. Journal of Orthopaedic Research. 1983;1:4–12. doi: 10.1002/jor.1100010102. [DOI] [PubMed] [Google Scholar]
- Holden JP, Grood ES, Korvick DL, Cummings JF, Butler DL, Bylski-Austrow DI. In vivo forces in the anterior cruciate ligament: Direct measurements during walking and trotting in a quadruped. Journal of Biomechanics. 1994;27:517–526. doi: 10.1016/0021-9290(94)90063-9. [DOI] [PubMed] [Google Scholar]
- Homer KA, Denbow L, Beighton D. Spectrophotometric method for the assay of glycosaminoglycans and glycosaminoglycan-depolymerizing enzymes. Analytical Biochemistry. 1993;214:435–441. doi: 10.1006/abio.1993.1520. [DOI] [PubMed] [Google Scholar]
- Korhonen RK, Laasanen MS, Toyras J, Lappalainen R, Helminen HJ, Jurvelin JS. Fibril reinforced poroelastic model predicts specifically mechanical behavior of normal, proteoglycan depleted and collagen degraded articular cartilage. Journal of Biomechanics. 2003;36:1373–1379. doi: 10.1016/s0021-9290(03)00069-1. [DOI] [PubMed] [Google Scholar]
- Lai WM, Hou JS, Mow VC. A triphasic theory for the swelling and deformation behaviors of articular cartilage. Journal of Biomechanical Engineering. 1991;113:245–258. doi: 10.1115/1.2894880. [DOI] [PubMed] [Google Scholar]
- Lane JM, Chisena E, Black J. Experimental knee instability: early mechanical property changes in articular cartilage in a rabbit model. Clinical Orthopaedics & Related Research. 1979;140:262–265. [PubMed] [Google Scholar]
- Lu XL, Miller C, Chen FH, Guo XE, Mow VC. The generalized triphasic correspondence principle for simultaneous determination of the mechanical properties and proteoglycan content of articular cartilage by indentation. Journal of Biomechanics. 2007;40:2434–2441. doi: 10.1016/j.jbiomech.2006.11.015. EPub. [DOI] [PubMed] [Google Scholar]
- Lu XL, Sun DD, Guo XE, Chen FH, Lai WM, Mow VC. Indentation determined mechanoelectrochemical properties and fixed charge density of articular cartilage. Annals of Biomedical Engineering. 2004;32:370–379. doi: 10.1023/b:abme.0000017534.06921.24. [DOI] [PubMed] [Google Scholar]
- Mow VC, Gibbs MC, Lai WM, Zhu WB, Athanasiou KA. Biphasic indentation of articular cartilage--II. A numerical algorithm and an experimental study. Journal of Biomechanics. 1989;22:853–861. doi: 10.1016/0021-9290(89)90069-9. [DOI] [PubMed] [Google Scholar]
- Mow VC, Gu WY, Chen FH. Structure and Function of Articular Cartilage and Meniscus. In: Mow VC, Huiskes R, editors. Basic Orthopaedic Biomechanics and Mechano-Biology. 3rd ed. Lippincott Williams & Wilkins; Philadelphia: 2005. [Google Scholar]
- Mow VC, Holmes MH, Lai WM. Fluid transport and mechanical properties of articular cartilage: a review. Journal of Biomechanics. 1984;17:377–394. doi: 10.1016/0021-9290(84)90031-9. [DOI] [PubMed] [Google Scholar]
- Rasanen T, Messner K. Regional variations of indentation stiffness and thickness of normal rabbit knee articular cartilage. Journal of Biomedical Materials Research. 1996;31:519–524. doi: 10.1002/(SICI)1097-4636(199608)31:4<519::AID-JBM12>3.0.CO;2-B. [DOI] [PubMed] [Google Scholar]
- Roemhildt ML, Coughlin KM, Peura GD, Fleming BC, Beynnon BD. Material properties of articular cartilage in the rabbit tibial plateau. Clinical Biomechanics. 2006;39:2331–2337. doi: 10.1016/j.jbiomech.2005.07.017. [DOI] [PMC free article] [PubMed] [Google Scholar]
- Rosenberg L. Chemical basis for the histological use of safranin O in the study of articular cartilage. Journal of Bone and Joint Surgery. 1971;53:69–82. [PubMed] [Google Scholar]
- Sah RL, Yang AS, Chen AC, Hant JJ, Halili RB, Yoshioka M, Amiel D, Coutts RD. Physical properties of rabbit articular cartilage after transaction of the anterior cruciate ligament. Journal of Orthopaedic Research. 1997;15:197–203. doi: 10.1002/jor.1100150207. [DOI] [PubMed] [Google Scholar]
- Setton LA, Zhu W, Mow VC. The biphasic poroviscoelastic behavior of articular cartilage: role of the surface zone in governing the compressive behavior. Journal of Biomechanics. 1993;26:581–592. doi: 10.1016/0021-9290(93)90019-b. [DOI] [PubMed] [Google Scholar]
- Shapiro EM, Borthakur A, Gougoutas A, Reddy R. 23Na MRI accurately measures fixed charge density in articular cartilage. Magnetic Resonance Medicine. 2002;47:284–291. doi: 10.1002/mrm.10054. [DOI] [PMC free article] [PubMed] [Google Scholar]
- Soltz MA, Ateshian GA. Experimental verification and theoretical prediction of cartilage interstitial fluid pressurization at an impermeable contact interface in confined compression. Journal of Biomechanics. 1998;31:927–934. doi: 10.1016/s0021-9290(98)00105-5. [DOI] [PubMed] [Google Scholar]
- Zhu W, Mow VC, Koob TJ, Eyre DR. Viscoelastic shear properties of articular cartilage and the effects of glycosidase treatments. Journal of Orthopaedic Research. 1993;11:771–781. doi: 10.1002/jor.1100110602. [DOI] [PubMed] [Google Scholar]