

Abstract
BACKGROUND
Older adults with type 2 diabetes are more likely to fall but little is known about risk factors for falls in this population. We determined if diabetes-related complications or treatments are associated with fall risk in older diabetic adults.
METHODS
In the Health, Aging, and Body Composition cohort of well-functioning older adults, participants reported falls in the previous year at annual visits. Odds ratios for more frequent falls among 446 diabetic participants whose mean age was 73.6 years, with an average follow-up of 4.9 years, were estimated with continuation ratio models.
RESULTS
In the first year, 23% reported falling; 22, 26, 30, and 31% fell in subsequent years. In adjusted models, reduced peroneal nerve response amplitude (OR=1.50; 95% CI 1.07, 2.12, worst quartile vs others), higher cystatin-C, a marker of reduced renal function, (OR=1.38; 95% CI 1.11, 1.71, for 1SD increase), poorer contrast sensitivity (OR=1.41; 95% CI 0.97, 2.04, worst quartile vs others), and low A1C in insulin users (OR = 4.36; 95% CI 1.32, 14.46, A1C≤6% vs >8%) were associated with fall risk. In those using oral hypoglycemic medications but not insulin, low A1C was not associated with fall risk (OR = 1.29; 95% CI 0.65, 2.54, A1C≤6% vs >8%). Adjustment for physical performance explained some, but not all, of these associations.
CONCLUSIONS
In older diabetic adults, reducing diabetes-related complications may prevent falls. Achieving lower A1C levels with oral hypoglycemic medications was not associated with more frequent falls, but, among those using insulin, A1C ≤6% increased fall risk.
INTRODUCTION
Older adults with type 2 diabetes have an increased risk of falls, but little is known about risk factors for falls in this population (1-4),. Factors of particular concern include diabetes-related complications of peripheral neuropathy, reduced vision and renal function. Insulin therapy is associated with increased falls (3; 5), possibly due to more severe disease and/or hypoglycemic episodes. Reduced balance, strength and gait are likely intermediaries in any association between diabetes-related complications and fall risk. Previous studies of falls among older diabetic adults were cross-sectional or had limited data characterizing glycemic control and diabetes-related complications. We utilized longitudinal data on diabetic participants in the Health, Aging, and Body Composition (Health ABC) study to determine if factors associated with diabetes progression or treatment increase fall risk and if associations are mediated by poor performance on tests of balance, gait and strength.
METHODS
Health ABC is a prospective study of 3,075 men and women aged 70-79 years recruited at University of Pittsburgh and University of Tennessee, Memphis. Participants who reported any difficulty with activities of daily living, walking up ten steps, or walking a quarter of a mile were excluded. Study procedures were approved by the institutional review boards, and participants provided written informed consent. Baseline examinations occurred during 1997-1998. Participants returned for annual visits.
Diabetes
Diabetes at baseline was ascertained by self-report of a physician diagnosis, self-reported use of hypoglycemic medication, or an elevated fasting glucose (≥126 mg/dl) or 2-hour oral glucose tolerance test (OGTT) (≥200 mg/dl). Of 2,940 participants with baseline data on diabetes, 719 (24%) participants had diabetes. Of these, 446 had peripheral nerve function measured three years after baseline and are included in these analyses. At baseline, the excluded 273 participants had similar A1C and diabetes duration, but reduced renal function, poorer physical performance, and more frequent falls.
Falls
At annual visits, participants were asked: “In the past 12 months, have you fallen and landed on the floor or ground?” Possible responses for number of falls were 1, 2-3, 4-5, or ≥6. These analyses include falls that occurred from baseline to Visit 6 (V6), reported at the 1st through 5th follow-up visits (V2-V6). Average follow-up among participants included in these analyses was 4.9 (range 2.9-5.4) years. Of the 446 participants, 27 (6%) died between V4 and V6, and 11 (2.5%) did not complete V6 for other reasons.
Diabetes-related complications
At V3, high contrast distance visual acuity, contrast sensitivity, and depth perception were measured. Peripheral nerve (PN) function was measured at V4. Light touch discrimination was measured on a warmed great toe using Von-Frey type esthesiometer probes. Lower extremity vibration sensitivity was measured with the “method of limits” using the VSA-3000 Vibratory Sensory Analyzer (Medoc, Minneapolis, MN) (6). Motor nerve conduction studies of the peroneal nerve were conducted using the XL-Tek NeuroMax 8 (Oakville, ON, Canada) (6). Peroneal nerve compound muscle action potential (CMAP) amplitude was determined at the popliteal fossa, fibular head and ankle. Nerve conduction velocity (NCV) was determined between the ankle and the popliteal fossa or fibular head. NCV results >80 m/sec are outside the physiological range and were excluded. Estimated glomerular filtration rate (eGFR) at baseline was calculated with the abbreviated Modification of Diet in Renal Disease equation, and eGFR <60 mL/min/1.73 m2 was defined as chronic kidney disease (7).
Physical performance
Physical performance tests were obtained at baseline, V4 and V6. Strength was additionally measured at V2. Test methods have been described previously (8; 9). Briefly, participants completed a 6 m walk at their usual speed, a 6 m narrow walk, and five chair stands. Standing balance was assessed with semi-tandem, full tandem and one-leg balance stands. Grip strength was assessed on the stronger hand with a handheld dynamometer (Jamar, Sammons Preston, Bolingbrook, IL). Knee extensor strength was measured on the right leg using an isokinetic dynamometer (125 AP, Kin-Com, Chattanooga, TN).
Laboratory measurements
Fasting plasma glucose, OGTT, hemoglobin A1c (A1C) and serum creatinine were measured using standard procedures. CysC was measured on baseline serum stored at -70°C for an average of 6.5 years using a BNII nephelometer (Dade Behring Inc., Deerfield, IL) utilizing a particle-enhanced immunonepholometric assay (N Latex Cystatin C). Intra- and inter-assay coefficient of variation for cysC are 2.0-2.8% and 2.3-3.1%, respectively.
Other measurements
Blood pressure was measured with the participant seated and then one minute after standing up (baseline, V2, V4, V6). Postural hypotension was estimated as the difference between the seated and standing measurements. Change in weight between visits was categorized as stable weight (change of <2kg), weight loss or weight gain (change of ≥2kg). Participants were asked to bring all prescription and OTC medications used in the previous two weeks to all visits except V4. Medications were coded using the Iowa Drug Information System (10). Cognitive function was assessed with the Teng Mini-Mental State (MMSE) examination (baseline, V3, V5). Depression was assessed with the Center for Epidemiologic Studies depression scale (CES-D) (baseline, V3). History of stroke was ascertained by self-report at all visits.
Statistical analyses
Some measures were obtained at more than one visit. Linear interpolation was used to estimate A1C values. For weight loss, the closest non-missing value was used. For medication use, we averaged the reports of current use at the beginning and end of each interval. For other variables, the last value was carried forward. Variables measured only once, including vision and PN function, were treated as fixed.
Continuation ratio models (11) were used to assess potential predictors of falls. Because participants reported falls as none, 1, 2-3, 4-5, or ≥6, it was not possible to use the rate or number of falls as an outcome. In the continuation ratio model, this ordinal variable for number of falls was modeled as a sequence of dichotomous outcomes, or stages of continuation: first, any falls vs none; then among those with at least one fall, ≥2 vs 1; and so forth. An intercept for each stage of the outcome was included in the model, flexibly modeling the risk of continuation at each stage. The odds-ratio for each predictor is interpretable as the relative increase in odds of continuation per unit increase in the predictor. These odds-ratios are assumed constant across stages. For example, it is assumed that the odds-ratio associated with each additional year of age is the same for having one versus no falls as the odds-ratio for having 2-3 versus 1 fall. Variables generally met this assumption. A participant could contribute 1 to 4 observations, depending on the number of falls, at each of up to 5 visits. A normal-logistic model with a random effect for participant was used to account for within-subject correlation of these outcomes across visits. Repeatedly-measured predictors could also vary from visit to visit.
Bivariate associations with falls, adjusted for clinic site and visit year, were first considered. To assess linearity, we considered categorical versions of continuous predictors, using either quartiles or established clinical cutpoints; where we observed threshold effects, we contrasted the extreme quartile or group with the remainder. Age, race and gender as well as clinic site and visit year were included in the multivariate model by default. Variables for vision, PN function, renal function, weight change and DBP change, plus interaction terms for A1C levels and insulin therapy, were included in the initial multivariate model. Potential confounders considered in bivariate models included medications associated with fall risk in previous studies, comorbid conditions, depression, and cognitive function. Variables associated with fall risk in these bivariate models (p<0.10) were included in the multivariate models: depression, anti-depressant use, SSRI anti-depressants, loop diuretics, calcium channel blockers, history of stroke, and MMSE score. In the multivariate model, we retained potential confounders that remained statistically significant (p<0.10) or that changed the estimated effect of the variables of primary interest by 20% or more. We then evaluated physical performance measures as potential intermediaries in the associations between diabetic complications and fall risk. To identify the A1C level at which falling risk may increase, we smoothed an indicator of any falls against A1C level using the Lowess non-parametric scatterplot smoother with an observation for each visit (12). Statistical analyses were performed in SAS Version 9.1 (SAS Institute, Cary, NC) and Stata Version 9.2 (Stata Corp, College Station, TX).
RESULTS
In this cohort of older diabetic adults, mean age at baseline was 73.6 years (SD 2.7), mean A1C was 7.6% (SD 1.6), and 14% reported insulin use (Table 1). Among those using insulin, the participant had A1C ≤6% at 17 (6.1%) of the 278 total visits, A1C of 6-7% at 49 visits, A1C of 7-8% at 95 visits, and A1C >8% at 117 visits. At baseline 62% of participants had known diabetes, with an average duration of 12.8 (SD 12.4) years; diabetes was identified in the remaining 28% from elevated fasting glucose or 2-hour OGTT. In the first year, 23% reported any falls, followed by 22%, 26%, 30%, and 31% in subsequent years. A1C levels were not associated with fall risk in those who were not using insulin (Table 2). However, in those using insulin, A1C ≤6% was associated with falling (multivariate-adjusted OR = 4.36; 95% CI 1.32, 14.46) compared with A1C >8%. A1C ≤6% was identified at 17 visits in 7 insulin-using participants. The interaction between A1C and insulin use persisted after multivariate adjustment (Table 2) (p-value for test of homogeneity = 0.09). In Lowess smooth curves for the outcome of “any falls,” fall risk was similar at all A1C levels in those not using insulin, but appeared to increase at lower A1C levels in insulin users (Figure). In those using an oral hypoglycemic medication but not insulin, low A1C levels were not associated with falling (multivariate-adjusted OR = 1.29; 95% CI 0.65, 2.54; A1C ≤6% vs > 8%). A1C ≤6% was reported for 42 of these participants at 59 visits, and sulfonylurea use was reported at 81% of the visits. Results for sulfonylurea use were similar to those for any oral hypoglycemic medication (multivariate-adjusted OR = 1.09; 95% CI 0.52, 2.30; A1C ≤6% vs > 8%).
Table 1.
Characteristics of diabetic participants (Health, Aging, and Body Composition study) *
| Characteristic | Mean ± SD or % |
|---|---|
| Age at baseline (yr) | 73.6 ± 2.7 |
| Gender (men) | 55.4% |
| Race (white) | 52.9% |
| Weight (kg) | 80.7 ± 14.6 |
| Body mass index (kg/m2) | 28.8 ± 4.5 |
| Duration of diabetes (yr) † | 12.8 ± 12.4 |
| Hemoglobin A1C (%) | 7.6 ± 1.6 |
| Insulin use | 14.1% |
| Among those who were not using insulin: | |
| Sulfonylurea use | 40.7% |
| Metformin use | 9.7% |
| Thiazolidinedione use | 1.3% |
| No hypoglycemic medication use | 57.4% |
| Peripheral nerve function | |
| Loss of light touch discrimination (unable to detect 5.07 monofilament) ‡ | 22.5% |
| Peroneal nerve conduction velocity: popliteal fossa–ankle (m/s) ‡ ,# | 41 ± 8 |
| Peroneal nerve compound muscle action potential (CMAP) amplitude at popliteal fossa (mV) ‡ ,** | 3.0 ± 1.9 |
| Vibration perception threshold (microns) ‡ | 57.8 ± 37.2 |
| Vision | |
| Corrected visual acuity 20/50 or worse (%)§ | 6.7% |
| Poor contrast sensitivity §,∥ | 12.6% |
| Poor depth perception §,¶ | 15.2% |
| Renal function | |
| Cystatin C (mg/L) †† | 1.04 ± 0.27 |
| Estimated GFR < 60 mL/min per 1.73 m2 | 18.8% |
| Blood pressure | |
| Seated systolic BP (mm Hg) | 138 ± 20 |
| SBP: Standing-seated (mm Hg) | 2.6 ± 10.6 |
| Seated diastolic BP (mm Hg) | 71 ± 11 |
| DBP: Standing-seated (mm Hg) | 4.4 ± 9.6 |
N = 446
Excludes those diagnosed at the baseline visit
Measured at Visit 4
Measured at Visit 3
Log contrast sensitivity ≤ 1.3
Worst score (999) on Frisby stereopsis test
NCV <40 m/s is usually considered abnormal (30)
CMAP < 1.5mV is usually considered abnormal (30)
Reference range for 65 years and older: 0.61-1.23 mg/L (31)
Table 2.
Odds ratio and 95% confidence intervals for association between selected variables and more frequent falls in older adults with diabetes
| Variable (units) | Minimally adjusted * OR (95% CI) |
Model 1† OR (95% CI) |
Model 2 ‡ OR (95% CI) |
|---|---|---|---|
| Weight change | |||
| Wt loss (≥2 kg) | 1.54 (1.21, 1.95) | 1.56 (1.22, 1.98) | 1.58 (1.23, 2.01) |
| Stable wt (less than 2kg) | 1.00 ref | 1.00 ref | 1.00 ref |
| Wt gain (≥2 kg) | 1.34 (1.03, 1.75) | 1.25 (0.95, 1.64) | 1.26 (0.96, 1.66) |
| Insulin use & A1C | |||
| Among those using insulin: | |||
| A1C >8% | 1.00 ref | 1.00 ref | 1.00 ref |
| 7%<A1C≤8% | 1.08 (0.57, 2.07) | 1.09 (0.57, 2.11) | 1.15 (0.60, 2.22) |
| 6%<A1C≤7% | 1.19 (0.53, 2.68) | 1.31 (0.58, 2.99) | 1.27 (0.56, 2.91) |
| A1C≤6% | 3.78 (1.14, 12.51) | 4.36 (1.32, 14.46) | 4.10 (1.24, 13.54) |
| Among those not using insulin: | |||
| A1C >8% | 1.00 ref | 1.00 Ref | 1.00 ref |
| 7%<A1C≤8% | 0.88 (0.60, 1.29) | 0.81 (0.55, 1.19) | 0.83 (0.56, 1.23) |
| 6%<A1C≤7% | 1.00 (0.68, 1.49) | 1.00 (0.67, 1.49) | 0.98 (0.65, 1.45) |
| A1C≤6% | 0.93 (0.59, 1.44) | 0.84 (0.53, 1.33) | 0.83 (0.52, 1.31) |
| Insulin use in those with A1C>8% | 1.15 (0.65, 2.04) | 0.97 (0.55, 1.72) | 0.88 (0.50, 1.55) |
| Peripheral nerve function | |||
| Peroneal nerve response amplitude (≤1.5mV)§ | 1.71 (1.19, 2.44) | 1.50 (1.07, 2.12) | 1.38 (0.98, 1.94) |
| Vibration perception threshold (≤26.79 microns)§ | 1.38 (0.94, 2.03) | --- | --- |
| Monofilament detection (Neither vs either) ∥ | 1.74 (1.10, 2.78) | --- | --- |
| Vision | |||
| Contrast sensitivity (≤1.4)§ | 1.86 (1.27, 2.73) | 1.41 (0.97, 2.04) | 1.24 (0.86, 1.79) |
| Visual acuity (≥0.20 logmar)§ | 1.53 (1.05, 2.23) | --- | --- |
| Depth perception (worst score vs all others) | 1.47 (1.05, 2.05) | --- | --- |
| Renal function | |||
| Cystatin-C (mg/L) (per 0.38 mg/L) | 1.52 (1.23, 1.88) | 1.38 (1.11, 1.71) | 1.25 (1.01, 1.55) |
| Estimated GFR <60 mL/min/1.73 m2 | 1.44 (0.96, 2.16) | --- | --- |
| Blood pressure | |||
| Change in DBP: standing-seated (below median) | 1.50 (1.18, 1.90) | 1.54 (1.21, 1.95) | 1.53 (1.21, 1.95) |
| Physical performance | |||
| Grip strength (per 10 kg) | 0.80 (0.69, 0.93) | --- | 0.85 (0.68, 1.05) |
| Standing balance (per 10 sec) | 0.74 (0.67, 0.82) | --- | 0.79 (0.70, 0.88) |
| 6m normal walk (sec) | 1.15 (1.03, 1.30) | --- | 0.99 (0.87, 1.12) |
| Knee extensor strength (per 10 Nm) | 0.93 (0.90, 0.98) | --- | --- |
Adjusted for clinic site and visit year
Model 1: Includes weight change, insulin use, A1C, peroneal nerve response amplitude, contrast sensitivity, cystatin-C, change in DBP , plus clinic site, visit year, age, race, gender, use of antidepressant drugs, use of calcium channel blocker, high depression score (CES-D >9).
Model 2: Model 1 plus grip strength, standing balance, 6m normal walk
Worst quartile vs all others
4.17 and 5.07 filaments
Figure.
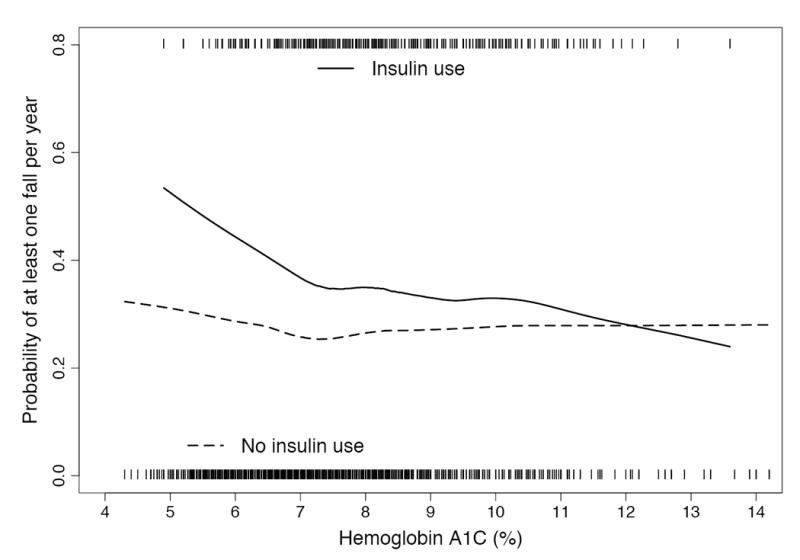
Lowess smooth curve of A1C level and estimated probability of having any fall during a year of followup, stratified by insulin use. This approach rests on the assumption that risk of falling varies smoothly, though not linearly, with A1C level. The ticks on the x-axis represent the visits among those using insulin (upper) and those not using insulin (lower) with particular A1C levels.
In bivariate models (Table 2), loss of light touch discrimination and low peroneal nerve response amplitude (CMAP) at the popliteal fossa were both associated with fall risk. NCV, ankle to popliteal fossa or to fibular head, was not associated with fall risk. In the multivariate model, only low CMAP remained independently associated with fall risk (Table 2). The first three years of follow-up for falls occurred prior to the PN function measurements. In models that included only falls after V4, results for PN function were similar. Visual acuity, contrast sensitivity and depth perception were associated with falls in bivariate models. In a model combining these vision variables, contrast sensitivity remained statistically significant and was selected to include in multivariate models. After multivariate adjustment, the effect estimate for contrast sensitivity was marginally significant (p=0.068). The first two years of follow-up for falls occurred prior to the vision measurements. However, in models including only falls after V3, the results for vision were similar. Higher cysC, a marker of decreasing GFR (13), was associated with fall risk in bivariate and multivariate models.
Seated or standing blood pressure was not associated with falling in bivariate models. Change in blood pressure was associated with fall risk for diastolic (DBP), but not for systolic (SBP), blood pressure. Baseline weight was not associated with falls. Compared with stable weight, weight loss was associated with higher fall risk. Weight gain was associated with falling in bivariate but not multivariate models.
Grip strength, knee extensor strength, standing balance time, chair stands, and 6m walk, but not the 6m narrow walk, were associated with falling in bivariate analyses. In a model combining these variables, grip strength, standing balance time, and 6m walk remained associated with fall risk. When these three variables were added to the multivariate model separately or as a group, there were modest changes in the effect estimates for peroneal CMAP, contrast sensitivity, and cysC.
DISCUSSION
In older diabetic adults, we found that poorer peroneal CMAP, higher levels of cysC, and poor contrast sensitivity each increased fall risk. Clinical trials have established that improved glycemic control prevents progression of these diabetes-related complications. Thus, improved control over the long-term is likely to prevent falls. We found that intensive glycemic control with oral hypoglycemic medications did not appear to increase fall risk, but intensive control (A1C≤6%) achieved with insulin therapy was associated with falling.
Although the benefits of glycemic control are well-established and current guidelines recommend an A1C goal of 7% or less for older diabetic adults, with a higher goal for those who are frail (18), most of the diabetic participants in Health ABC were not meeting the 7% goal. Only a small proportion of participants using hypoglycemic medications had A1C ≤6% during follow-up. Our results suggest that low A1C levels can be achieved without increased falls using oral hypoglycemic medications.
This is the first study of falls to report an interaction between insulin use and A1C levels. Some (3; 5), but not all (14), previous studies have reported increased fall risk among those using insulin. Miller et al. (1) reported a lack of association between glycemic control and fall risk while Tilling et al. reported increased fall risk with poor glycemic control (A1C >7%) (15). We found that poor control was not associated with increased fall risk regardless of insulin therapy status. However, in those using insulin, A1C ≤ 6% was associated with increased fall risk. Although hypoglycemia can occur with sulfonylurea use, we did not find an increased fall risk with low A1C levels and sulfonylurea use.
Our findings underscore the difficulty of balancing the benefits and risks of intensive glycemic control with insulin therapy, particularly in the elderly (16). Intensive control with insulin increases the possibility of hypoglycemic episodes, the most likely explanation for the increased fall risk with low A1C and insulin use reported here. Health ABC participants were not queried regarding hypoglycemic episodes so we could not test this hypothesis. Another possibility is nerve damage during the rapid achievement of glycemic control with insulin therapy due to hypoglycemia and/or hyperinsulinemia (17). However, in our model adjusted for PN function, low A1C and insulin use remained associated with falls, suggesting that reduced PN function due to hypoglycemia is not the underlying mechanism.
We found that the diabetes-related complications of reduced PN function, poorer vision, and decreased renal function are associated with increased fall risk. Reduced PN function (19) and visual function, particularly contrast sensitivity (20), are established risk factors for falls among older adults. Previous studies of falls among those with diabetes reported mixed results for peripheral neuropathy as a risk factor and found no independent association for visual impairment (5; 14).
Recent studies have reported that poor renal function is a risk factor for falls in older adults (21). We found a linear association between fall risk and cysC, suggesting that even modest declines in renal function are a risk factor for falls. A previous report demonstrated that baseline cysC levels are associated with gait, balance and strength in the Health ABC cohort (22). Poorer renal function reduces the renal conversion of 25(OH)D3 to 1,25(OH)2D3. Lower levels of active vitamin D may increase falls through reduced muscle strength and nerve function (21; 23; 24). We are not aware of previous reports on renal function and falls in older diabetic adults.
Our finding of increased falls with change in DBP (seated to standing) but not with change in SBP is difficult to interpret. Postural hypotension associated with autonomic neuropathy is more prevalent in those with diabetes (25). However, there is only weak evidence that postural hypotension is a risk factor for falls in broader populations (26; 27). A lack of data on changes in heart rate during the BP tests limited our ability to explore this further. In addition, we used the change in blood pressure from a seated to standing position rather than the standard measure of postural hypotension from a prone to standing position. Our findings need to be investigated further with better measures of postural hypotension.
In broader populations, lower weight and weight loss are both risk factors for falls, presumably because of their association with frailty. Our finding that weight loss was a risk factor for falls suggests that even in this overweight population, weight loss may be an indicator of increasing frailty.
We anticipated that diabetes-related complications would increase fall risk by decreasing balance, strength and gait (22; 28; 29). The modest differences between our two models (Table 2) suggest that some, but not all, of the effect of these complications is mediated by physical performance. It is also possible that our measurements may not capture aspects of strength, balance and gait that are important for predicting falls.
Our study was observational, so our ability to draw conclusions about causal relationships. Falls were self-reported and some misclassification is possible. This misclassification was likely to be non-differential with respect to our predictors and would therefore result in an attenuation of any real association. PN function and vision were measured three and two years respectively after baseline so that some falls occurred prior to these assessments. However, when we considered models restricted to falls after the measurements, results were similar. Participants excluded from these analyses were more likely to report a history of falls at the baseline visit and had poorer renal function and physical performance. Health ABC enrollment was also limited to well-functioning participants. Thus, our results may not apply to older diabetic adults with more physical impairments. We did not have a gold standard measurement of GFR but studies have demonstrated that cysC and eGFR are both reasonable surrogates. Finally, participants were not queried regarding hypoglycemia so we could not assess the association between hypoglycemic episodes and falls. However, our study had several important strengths, including an average of almost five years of follow-up, well-characterized diabetes, and a range of measures related to fall risk.
CONCLUSION
We found that diabetes-related complications - reduced peripheral nerve function, renal function and vision - contribute to fall risk in older adults with diabetes. Our results suggest that improving glycemic control to reduce diabetes-related complications may prevent falls. In older diabetic adults who were not using insulin, low A1C levels did not increase fall risk. However, achieving A1C levels ≤6% with insulin use resulted in more frequent falls.
Acknowledgments
This research was supported by the National Institute of Diabetes and Digestive and Kidney Diseases (R21 DK064597), the National Institute on Aging (contracts N01-AG-6-2101, N01-AG-6-2103, N01-AG-6-2106), and the Intramural Research Program of the NIH, National Institute on Aging. We thank Dr. Jane Cauley, Dr. Steven Cummings, Dr. Helaine Resnick, and Dr. Michael Shlipak for their comments on the manuscript and Lisa Palermo for statistical analyses. This paper was presented in part as an abstract at the 27th Annual Meeting of the American Society for Bone and Mineral Research in Nashville, Tennessee, USA, September 23-27, 2005.
Footnotes
Publisher's Disclaimer: This is an author-created, uncopyedited electronic version of an article accepted for publication in Diabetes Care (http://care.diabetesjournals.org). The American Diabetes Association (ADA), publisher of Diabetes Care, is not responsible for any errors or omissions in this version of the manuscript or any version derived from it by third parties.
References
- 1.Miller DK, Lui LY, Perry HM, Kaiser FE, Morley JE. Reported and measured physical functioning in older inner-city diabetic African Americans. J Gerontol A Biol Sci Med Sci. 1999;54:M230–M236. doi: 10.1093/gerona/54.5.m230. [DOI] [PubMed] [Google Scholar]
- 2.Hanlon JT, Landerman LR, Fillenbaum GG, Studenski S. Falls in African American and white community-dwelling elderly residents. J Gerontol A Biol Sci Med Sci. 2002;57:M473–M478. doi: 10.1093/gerona/57.7.m473. [DOI] [PubMed] [Google Scholar]
- 3.Schwartz AV, Hillier TA, Sellmeyer DE, Resnick HE, Gregg E, Ensrud KE, Schreiner PJ, Margolis KL, Cauley JA, Nevitt MC, Black DM, Cummings SR. Older women with diabetes have a higher risk of falls: a prospective study. Diabetes Care. 2002;25:1749–1754. doi: 10.2337/diacare.25.10.1749. [DOI] [PubMed] [Google Scholar]
- 4.Maurer MS, Burcham J, Cheng H. Diabetes mellitus is associated with an increased risk of falls in elderly residents of a long-term care facility. J Gerontol A Biol Sci Med Sci. 2005;60:1157–1162. doi: 10.1093/gerona/60.9.1157. [DOI] [PubMed] [Google Scholar]
- 5.Volpato S, Leveille SG, Blaum C, Fried LP, Guralnik JM. Risk factors for falls in older disabled women with diabetes: the women’s health and aging study. J Gerontol A Biol Sci Med Sci. 2005;60:1539–1545. doi: 10.1093/gerona/60.12.1539. [DOI] [PMC free article] [PubMed] [Google Scholar]
- 6.Kimura J. Electrodiagnosis in Diseases of Nerve and Muscle: Principles and Practice. Philadelphia: FA Davis; 1989. [Google Scholar]
- 7.Levey AS, Coresh J, Balk E, Kausz AT, Levin A, Steffes MW, Hogg RJ, Perrone RD, Lau J, Eknoyan G. National Kidney Foundation practice guidelines for chronic kidney disease: evaluation, classification, and stratification. Ann Intern Med. 2003;139:137–147. doi: 10.7326/0003-4819-139-2-200307150-00013. [DOI] [PubMed] [Google Scholar]
- 8.Simonsick EM, Newman AB, Nevitt MC, Kritchevsky SB, Ferrucci L, Guralnik JM, Harris T. Measuring higher level physical function in well-functioning older adults: expanding familiar approaches in the Health ABC study. J Gerontol A Biol Sci Med Sci. 2001;56:644–649. doi: 10.1093/gerona/56.10.m644. [DOI] [PubMed] [Google Scholar]
- 9.Park SW, Goodpaster BH, Strotmeyer ES, de Rekeneire N, Harris TB, Schwartz AV, Tylavsky FA, Newman AB. Decreased muscle strength and quality in older adults with type 2 diabetes: the health, aging, and body composition study. Diabetes. 2006;55:1813–1818. doi: 10.2337/db05-1183. [DOI] [PubMed] [Google Scholar]
- 10.Pahor M, Chrischilles EA, Guralnik JM, Brown SL, Wallace RB, Carbonin P. Drug data coding and analysis in epidemiologic studies. Eur J Epidemiol. 1994;10:405–411. doi: 10.1007/BF01719664. [DOI] [PubMed] [Google Scholar]
- 11.Dos Santos DM, Berridge DM. A continuation ratio random effects model for repeated ordinal responses. Stat Med. 2000;19:3377–3388. doi: 10.1002/1097-0258(20001230)19:24<3377::aid-sim526>3.0.co;2-e. [DOI] [PubMed] [Google Scholar]
- 12.Cleveland WS. Robust locally weighted regression and smoothing scatterplots. J Am Stat Assoc. 1979;74:829–836. [Google Scholar]
- 13.Dharnidharka VR, Kwon C, Stevens G. Serum cystatin C is superior to serum creatinine as a marker of kidney function: a meta-analysis. Am J Kidney Dis. 2002;40:221–226. doi: 10.1053/ajkd.2002.34487. [DOI] [PubMed] [Google Scholar]
- 14.Quandt SA, Stafford JM, Bell RA, Smith SL, Snively BM, Arcury TA. Predictors of falls in a multiethnic population of older rural adults with diabetes. J Gerontol A Biol Sci Med Sci. 2006;61:394–398. doi: 10.1093/gerona/61.4.394. [DOI] [PMC free article] [PubMed] [Google Scholar]
- 15.Tilling LM, Darawil K, Britton M. Falls as a complication of diabetes mellitus in older people. J Diabetes Complications. 2006;20:158–162. doi: 10.1016/j.jdiacomp.2005.06.004. [DOI] [PubMed] [Google Scholar]
- 16.Cryer PE, Davis SN, Shamoon H. Hypoglycemia in diabetes. Diabetes Care. 2003;26:1902–1912. doi: 10.2337/diacare.26.6.1902. [DOI] [PubMed] [Google Scholar]
- 17.Leow MK, Wyckoff J. Under-recognised paradox of neuropathy from rapid glycaemic control. Postgrad Med J. 2005;81:103–107. doi: 10.1136/pgmj.2004.021162. [DOI] [PMC free article] [PubMed] [Google Scholar]
- 18.Brown AF, Mangione CM, Saliba D, Sarkisian CA. Guidelines for improving the care of the older person with diabetes mellitus. J Am Geriatr Soc. 2003;51:S265–280. doi: 10.1046/j.1532-5415.51.5s.1.x. [DOI] [PubMed] [Google Scholar]
- 19.Richardson JK, Hurvitz EA. Peripheral neuropathy: A true risk factor for falls. J Gerontol A Biol Sci Med Sci. 1995;50:M211–215. doi: 10.1093/gerona/50a.4.m211. [DOI] [PubMed] [Google Scholar]
- 20.de Boer MR, Pluijm SM, Lips P, Moll AC, Volker-Dieben HJ, Deeg DJ, van Rens GH. Different aspects of visual impairment as risk factors for falls and fractures in older men and women. J Bone Miner Res. 2004;19:1539–1547. doi: 10.1359/JBMR.040504. [DOI] [PubMed] [Google Scholar]
- 21.Dukas LC, Schacht E, Mazor Z, Stahelin HB. A new significant and independent risk factor for falls in elderly men and women: a low creatinine clearance of less than 65 ml/min. Osteoporos Int. 2005;16:332–338. doi: 10.1007/s00198-004-1690-6. [DOI] [PubMed] [Google Scholar]
- 22.Odden MC, Chertow GM, Fried LF, Newman AB, Connelly S, Angleman S, Harris TB, Simonsick EM, Shlipak MG. Cystatin C and measures of physical function in elderly adults: the Health, Aging, and Body Composition (HABC) Study. Am J Epidemiol. 2006;164:1180–1189. doi: 10.1093/aje/kwj333. [DOI] [PubMed] [Google Scholar]
- 23.Gallagher JC, Rapuri PB, Smith LM. An age-related decrease in creatinine clearance is associated with an increase in number of falls in untreated women but not in women receiving calcitriol treatment. J Clin Endocrinol Metab. 2007;92:51–58. doi: 10.1210/jc.2006-1153. [DOI] [PMC free article] [PubMed] [Google Scholar]
- 24.Faulkner KA, Cauley JA, Zmuda JM, Landsittel DP, Newman AB, Studenski SA, Redfern MS, Ensrud KE, Fink HA, Lane NE, Nevitt MC. Higher 1,25-dihydroxyvitamin D3 concentrations associated with lower fall rates in older community-dwelling women. Osteoporos Int. 2006;17:1318–1328. doi: 10.1007/s00198-006-0071-8. [DOI] [PubMed] [Google Scholar]
- 25.Vinik AI, Maser RE, Mitchell BD, Freeman R. Diabetic autonomic neuropathy. Diabetes Care. 2003;26:1553–1579. doi: 10.2337/diacare.26.5.1553. [DOI] [PubMed] [Google Scholar]
- 26.Robbins AS, Rubenstein LZ. Postural hypotension in the elderly. J Am Geriatr Soc. 1984;32:769–774. doi: 10.1111/j.1532-5415.1984.tb04178.x. [DOI] [PubMed] [Google Scholar]
- 27.Maurer MS, Cohen S, Cheng H. The degree and timing of orthostatic blood pressure changes in relation to falls in nursing home residents. J Am Med Dir Assoc. 2004;5:233–238. doi: 10.1097/01.JAM.0000129837.51514.93. [DOI] [PubMed] [Google Scholar]
- 28.Resnick HE, Vinik AI, Schwartz AV, Leveille SG, Brancati FL, Balfour J, Guralnik JM. Independent effects of peripheral nerve dysfunction on lower-extremity physical function in old age: the Women’s Health and Aging Study. Diabetes Care. 2000;23:1642–1647. doi: 10.2337/diacare.23.11.1642. [DOI] [PubMed] [Google Scholar]
- 29.West CG, Gildengorin G, Haegerstrom-Portnoy G, Schneck ME, Lott L, Brabyn JA. Is vision function related to physical functional ability in older adults? J Am Geriatr Soc. 2002;50:136–145. doi: 10.1046/j.1532-5415.2002.50019.x. [DOI] [PubMed] [Google Scholar]
- 30.Maser RE, Nielsen VK, Dorman JS, Drash AL, Becker DJ, Orchard TJ. Measuring subclinical neuropathy: does it relate to clinical neuropathy? Pittsburgh epidemiology of diabetes complications study-V. J Diabet Complications. 1991;5:6–12. doi: 10.1016/0891-6632(91)90003-8. [DOI] [PubMed] [Google Scholar]
- 31.Ognibene A, Mannucci E, Caldini A, Terreni A, Brogi M, Bardini G, Sposato I, Mosconi V, Salvadori B, Rotella CM, Messeri G. Cystatin C reference values and aging. Clin Biochem. 2006;39:658–661. doi: 10.1016/j.clinbiochem.2006.03.017. [DOI] [PubMed] [Google Scholar]