Abstract
Purpose
To quantify the differences between planned and delivered parotid gland and target doses, and to assess the benefits of daily bone alignment for head-and-neck cancer patients treated with intensity-modulated radiotherapy (IMRT).
Methods and Materials
Eleven head-and-neck cancer patients received 2 CT scans/week with an in-room CT scanner over their course of radiotherapy. The clinical IMRT plans, designed with 3–4mm planning margins, were recalculated on the repeat CT images. The plans were aligned using (1) the actual treatment isocenter marked with radiopaque markers (BB) and (2) bone alignment to the cervical vertebrae to simulate image-guided setup. In-house deformable image registration software was used to map daily dose distributions to the original treatment plan and to calculate a cumulative, delivered dose distribution for each patient.
Results
Using conventional BB alignment led to increases in the parotid gland mean dose above the planned dose by 5–7Gy in 45% of the patients (median = 3.0Gy ipsilateral (p=0.026); median = 1.0Gy contralateral (p=0.016)). Use of bone alignment led to reductions relative to BB alignment in 91% of patients (median=2Gy; range=0.3–8.3Gy; 15 of 22 parotids improved). However, the parotid dose from bone alignment was still greater than planned (median=1.0Gy (p=0.007)). Neither approach affected tumor dose coverage.
Conclusions
With conventional BB alignment, the parotid gland mean dose was significantly increased above the planned mean dose. Using daily bone alignment reduced the parotid dose compared to BB alignment in almost all patients. A 3–4 mm planning margin was adequate for tumor dose coverage.
Keywords: adaptive radiotherapy, IGRT, setup uncertainty, anatomic variation, parotid gland
INTRODUCTION
Previous studies have shown that the daily setup position can significantly vary for patients who undergo head-and-neck (H&N) radiotherapy (1–4). Additionally, it has been shown that H&N tumors and parotid glands typically shrink over a course of radiotherapy (5). The changes in shape and volume are asymmetric, suggesting that the tumor might move outside of the planned treatment fields or that normal tissues, such as the parotid glands, can move into the high-dose regions.
Although studies have quantified the positional and volumetric changes in patients undergoing treatment for H&N cancer and suggested dosimetric effects, they lacked serial CT imaging and deformable image registration tools needed to quantify the actual dosimetric effects of setup variations and internal anatomic changes over a course of radiotherapy. This current study takes advantage of an integrated CT-linear accelerator system to measure the dosimetric effect of both setup variation and internal anatomic changes during a full course of H N IMRT. First, the planned dose distribution was compared to the cumulative “delivered” dose distribution using a conventional alignment technique. Second, the cumulative dose distribution based on simulated daily bone alignment was calculated to determine if any additional parotid sparing could be achieved.
METHODS AND MATERIALS
Patients and imaging
Twelve H&N cancer patients were enrolled in an institutional review board-approved protocol. Inclusion criteria were (1) a pathologic diagnosis of H&N cancer, (2) definitive IMRT treatment, (3) target volumes including bilateral level 2 lymph nodes, and (4) the ability to tolerate CT scanning. Patients diagnosed with primary tumors of the parotid glands or metastases to the parotid glands were excluded. Patients were accrued over six months in 2004. One patient was excluded from the data analysis because a new mask and a new treatment plan were adopted midway through the treatment due to large changes in the patient’s anatomy. Using an integrated CT-linear accelerator (6) (EXaCT, Varian Oncology Systems, Palo Alto, CA), we performed repeat CT imaging of these patients prior to radiation treatment twice per week (typically on Mondays and Thursdays). Because CT scans were not taken every day, the CT image sets were used as sample measurements spread out over the course of treatment. The CT slice spacing was 3mm and axial pixel size was approximately 1mm.
Target volumes
Gross tumor volumes (GTVs), clinical target volumes (CTVs), planning target volumes (PTVs), parotid glands, and spinal cord were delineated and used to design the original IMRT treatment plans. Three CTVs, based on the current clinical practice at this institution, were used for each patient. CTVhigh, which encompassed the GTVs plus a physician-determined planning margin, was prescribed 66–70Gy. CTVintermediate, which surrounded the lymph nodes that have a high probability of cancer involvement (either ipsilateral or bilateral lymph nodes, based on the physician’s judgment), was prescribed 60–63Gy. CTVlow encompassed the retropharyngeal and contralateral lymph nodes, which have a relatively lower probability of cancer involvement, and was prescribed 54–59Gy. The 3 CTVs were analyzed separately. For treatment planning, the PTVs encompassed the CTVs with a 3 to 4mm margin. Based on each physician’s clinical judgment, each patient was treated with either comprehensive nodal IMRT or with a split-field technique (the tumor and upper neck were treated with IMRT and the lower neck was treated with an AP supraclavicular field). Patients who received the split-field technqiue also were treated with mid-neck boosts and electron boosts when needed.
Method of alignment
The clinical treatment plan was transferred onto the subsequent repeat CT image sets and aligned using two different methods: aligning external marks on the patient’s immobilization mask and aligning bony anatomy. For the first alignment method, BB alignment, three radio-opaque fiducial markers (BBs) were placed on the immobilization mask each day at the alignment marks intersecting with the treatment room lasers, indicating the actual daily treatment isocenter. This marked isocenter included any isocenter displacements from the original marked isocenter as determined by the attending physicians during weekly portal imaging, in accordance with the current standard of care. The dosimetry of the BB alignment treatment plans was affected by both the patient setup displacements inside of immobilization mask and by internal anatomic variations. For this research protocol, the BB alignment was used to align the patients for actual treatment. For the second alignment method, bone alignment, in-house software used 3-dimensional (3D) bony registration to align the repeat CT image sets with the planning CT image set based on the position of the 2nd cervical vertebra (4,7). Bone alignment was used solely for data analysis. We chose to use CT imaging for this study because it provided the volumetric data necessary to calculate 3D dose distributions. However, bone alignment could also be accomplished by other methods, such as the orthogonal 2D imaging (portal films or electronic portal imaging), which is commonly available in radiotherapy departments. We chose to align to bone rather than soft tissue for two reasons: (1) head-and-neck tumors tend to shrink asymmetrically over the course of radiotherapy, so aligning to the GTV center-of-volume could cause misalignment to the CTV and PTV structures, and (2) aligning to the changing location of the soft-tissue target may lead to over-dosing the spinal cord or other critical organs.
Calculating displacement
Systematic and random displacements of the patient inside of the mask were analyzed using equations presented by de Boer et al. (8). Briefly, the displacement of the 2nd cervical vertebra (landmark for the patient’s bony anatomy) relative to the external fiducial marks on the patient’s mask was calculated for each repeat CT image set and is represented by d(p,f), where p is the patient number and f signifies the treatment fraction. The random variation depends on both the treatment fraction and the patient and is represented by r(p,f). The systematic variation is the same for all treatment fractions but varies by patient and is represented by s(p).
| (1) |
The systematic displacement for a given patient can be calculated by the average of the total displacement vectors over all treatment fractions.
| (2) |
The standard deviation of the total displacement over all treatment fractions represents the random variation.
| (3) |
The population systematic and random variations are calculated by the following equations, where Σ is the standard deviation of the systematic displacements and σ is the root-mean-square of the random variation.
| (4) |
| (5) |
Because the patient was occasionally realigned before treatment based on portal film images, the external markers would sometimes be moved to better match the patient’s position inside of the treatment mask based on portal images. Therefore, the systematic and random displacements of the patient inside the treatment mask without weekly portal film alignment would be greater than the results reported here.
Calculating cumulative dose distributions with deformable image registration
As illustrated in Figure 1, an intensity-based deformable image registration algorithm was implemented at our institution to find the non-rigid 3D transformations from the repeat CT image sets (CT1, CT2, CT3…CTn) to the planning CT image set (CT0) (9,10). First, dose distributions were calculated on the planning CT image set (D0) and on each repeat CT image set (D1, D2, D3…Dn). Second, we mapped the repeat CT image sets voxel-by-voxel to the planning CT image set (CT0). Third, we mapped the dose distribution from each repeat CT image set (D1, D2, D3…Dn) to the planning CT image set, creating deformed dose distributions (D01, D02, D03…D0n). Fourth, the cumulative dose distribution was calculated by averaging the deformed dose distributions. Fifth, the calculated cumulative dose distribution was imported into a commercial treatment planning system (Pinnacle3, Philips Medical Systems, Andover, MA), where the treatment plan was originally designed, to compare the planned dose distribution with the cumulative dose distributions created with both BB and bone alignment methods. Cumulative dose-volume histograms (DVHs) were collected from the planning CT image set by using the original treatment planning contours. Because the dose distributions were mapped from the repeat CT image sets to the planning CT image sets, there was no need to contour on each repeat CT image set. The Wilcoxon matched-pairs signed ranks test was used to compare the results, and p < 0.05 was considered significant.
Fig. 1.
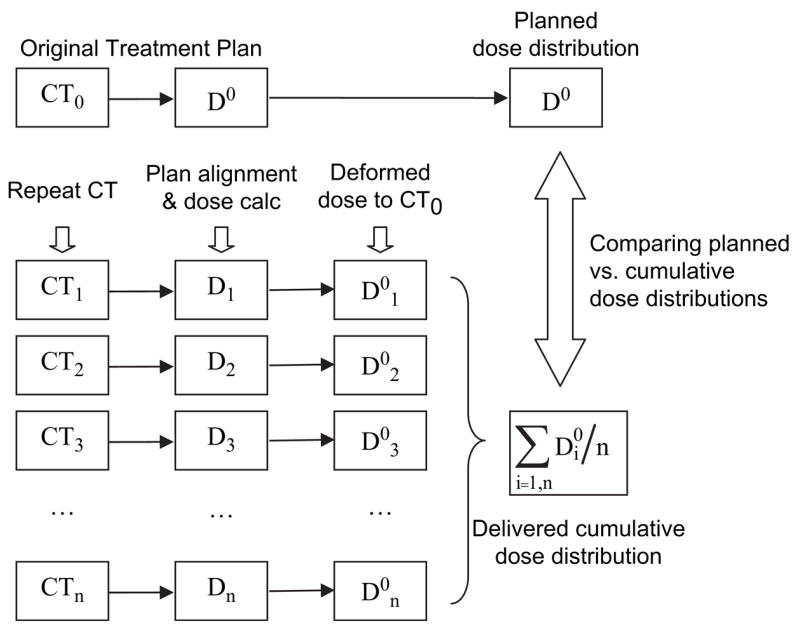
Schematic of cumulative dose distribution calculation. Abbreviations: CT = computed tomography; D = dose; calc = calculation; CT0 = planning CT image set; D0 = dose distribution on planning CT image set; CTn = nth repeat CT image set; Dn = dose distribution on nth repeat CT image set; D0n = dose distribution from nth repeat CT image set mapped onto planning CT image set.
Data analysis
The dose delivered to 95% volume (D95) of the GTV and CTV, the mean dose to the parotid glands (11,12) and the percentage-volume of the spinal cord receiving ≥45Gy (13) were analyzed. In addition, the generalized equivalent uniform dose (gEUD), the uniform dose that would lead to the same amount of cell kill as the non-uniform dose distribution, was calculated from the DVHs. The phenomenological form introduced by Niemierko et al. (14) and reported by Wu et al. (15) was used.
| (6) |
In equation 7, N is the number of voxels in the anatomic structure, Di is the dose delivered to voxel i, and a is the tumor-specific/normal tissue-specific parameter, which depends on the dose-volume effect. We selected a = 7.4 for the spinal cord (15), a = 0.47 for the parotid glands (11), and a = −8.0 for the GTVs and CTVs (15). The Wilcoxon matched-pairs signed ranks test was used to compare the results, and p < 0.05 was considered significant.
RESULTS
Systematic and Random Patient Displacements
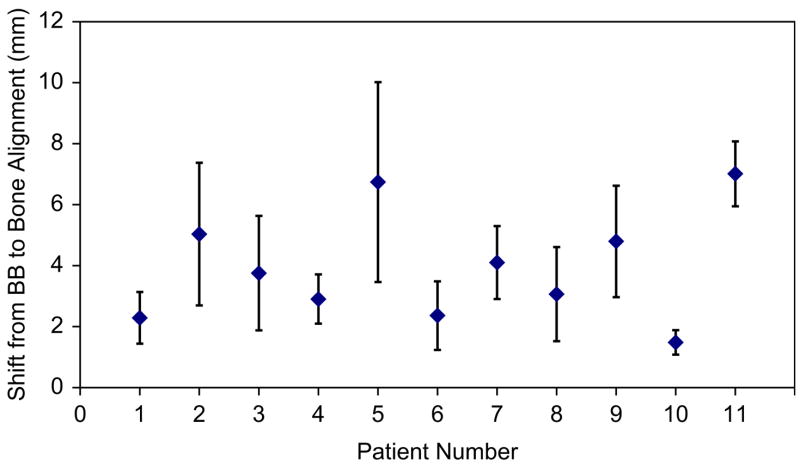
The individual systematic and random displacements of the 2nd cervical vertebra (bone) relative to the external markers were calculated for the study cohort. Systematic displacements were typically small in the right/left (R/L) and superior/inferior (S/I) dimensions (≤2 mm) and in the anterior/posterior (A/P) dimension (≤2.6 mm). A few patients had larger systematic displacements of ≤5 mm posterior (Patient 9 and Patient 11) or ≤4 mm inferior (Patient 2 and Patient 11). The largest 3D systematic displacements were seen with Patient 5, who used a shorter immobilization mask than the other patients that only covered the head-to-chin region, and with Patient 11 (Fig. 2). Population displacement statistics were also calculated. The group systematic displacements (Σ) were ≤2.2 mm in all 3 dimensions. The magnitude of the random displacements (σ) was also small (1.6–2.0 mm).
Fig. 2.
Systematic 3-dimensional displacements +/− 1 standard deviation for patients with H&N cancer.
Organ-at-Risk Dose Sparing
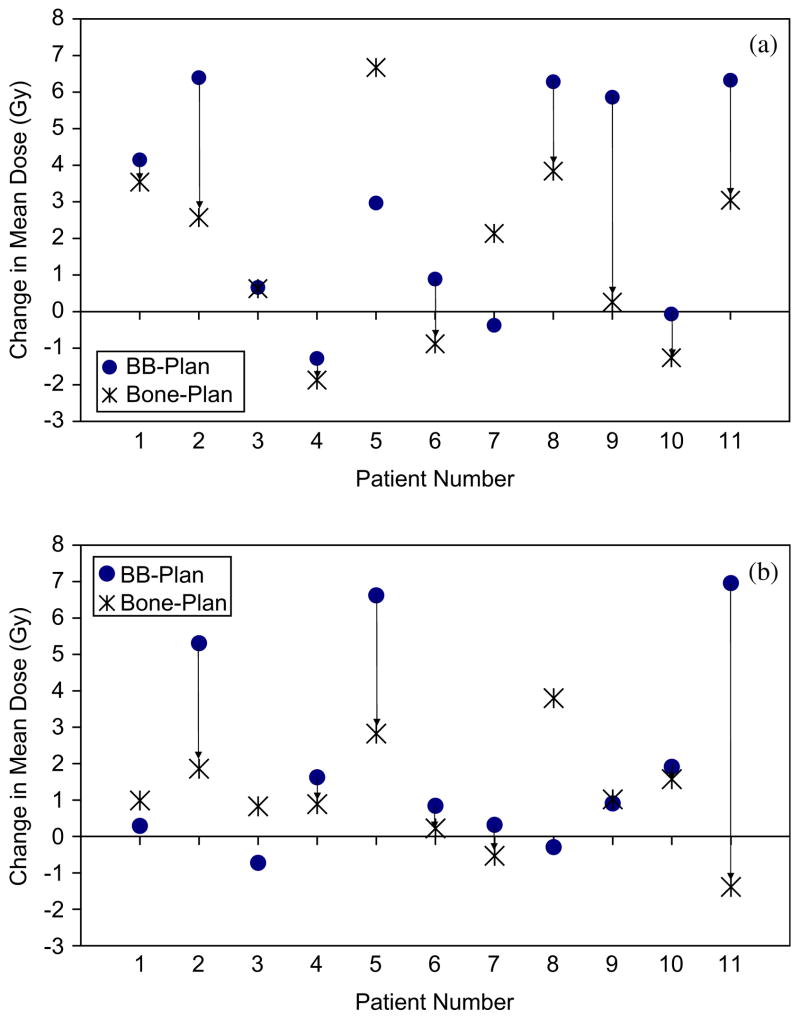
When using BB alignment, the parotid gland mean dose increased by 5–7Gy in 45% of the patients (Fig. 3). The median increase was 3.0Gy for the ipsilateral parotid gland (p = 0.026) and 1.0Gy for the contralateral parotid gland (p = 0.016). Using bone alignment instead of BB alignment provided a relative reduction in the parotid gland mean dose to both parotid glands in 45% of the patients and to at least one parotid gland in 91% of the patients (median reduction = 2Gy; range = 0.3–8.3Gy; 7 of 22 parotid glands showed no benefit from bone alignment). Reductions in the parotid gland mean dose with bone alignment of 3–8Gy were observed in 36% of the patients. Although the use of bone alignment provided parotid gland dose reductions relative to the use of BB alignment, it also showed a median increase relative to the planned mean dose of 1.0Gy for both parotid glands (p = 0.007). Systematic lateral shifts of the patient inside the immobilization mask would occasionally cause BB alignment to dramatically spare one parotid gland but at the expense of overdosing the other (e.g. Patient 8). Similar results were observed when the gEUD of the parotid glands was analyzed.
Fig. 3.
Increase in mean (a) ipsilateral and (b) contralateral parotid gland doses with BB and bone alignments. Arrows indicate a lower mean dose with bone alignment than BB alignment.
For the spinal cord, no statistically significant dosimetric changes were seen. The maximum cord dose was limited to 45Gy in treatment planning, to reduce the risk of spinal cord radiation injury (13). When BB alignment was used, the volume of the spinal cord ≥45Gy only increased with Patient 1 (0.23cm3) and Patient 5 (1.1cm3). When bone alignment was used, the volume of the spinal cord ≥45Gy only increased with Patient 1 (0.46cm3).
Target Dose Coverage
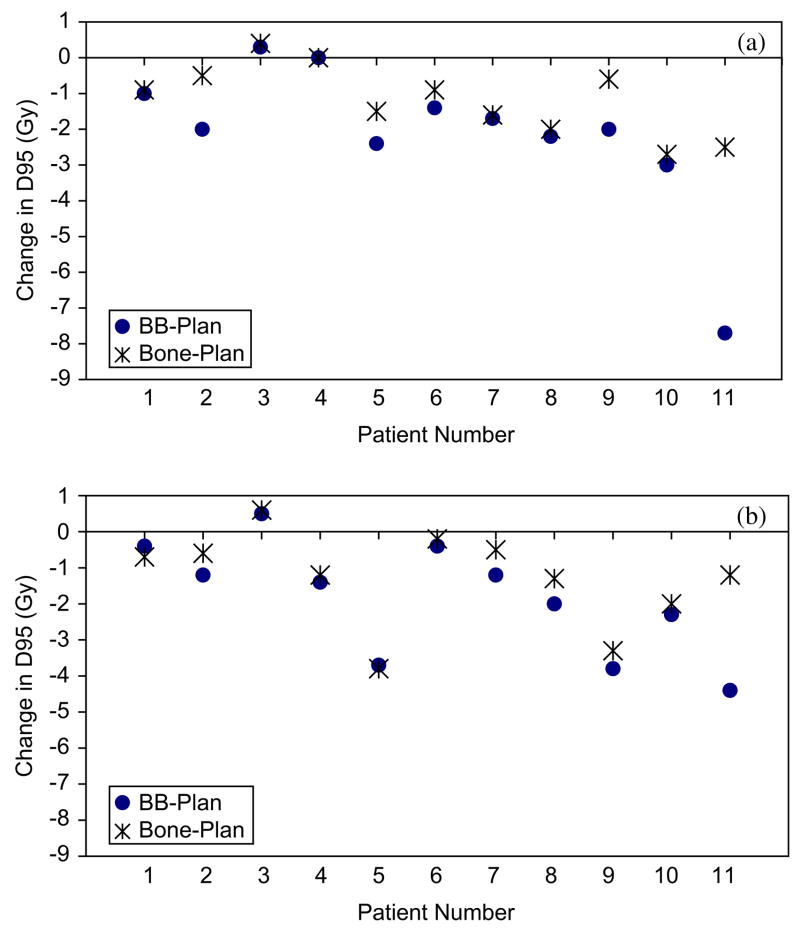
GTV and CTVhigh dose coverage was maintained with BB alignment. The GTV and CTVhigh dose coverage was not significantly increased with bone alignment. Small losses in CTVintermediate dose coverage were seen with BB alignment (Fig. 4a), with a median D95 reduction of 2Gy (p=0.007). The use of bone alignment improved the CTVintermediate D95 dose coverage (p=0.005), particularly for patients with larger systematic displacements inside their immobilization masks. Small reductions in CTVlow dose coverage also occurred with BB alignment (Fig. 4b), with a median D95 reduction of 1.4Gy (p = 0.008). Increases in the CTVlow D95 were seen with bone alignment (p = 0.021). Similar results were found when the GTV and CTV dose coverages were analyzed with the gEUD metric.
Fig. 4.
Change in dose to 95% of the target (D95) between planned and delivered (BB or bone) for (a) CTVintermediate and (b) CTVlow.
DISCUSSION
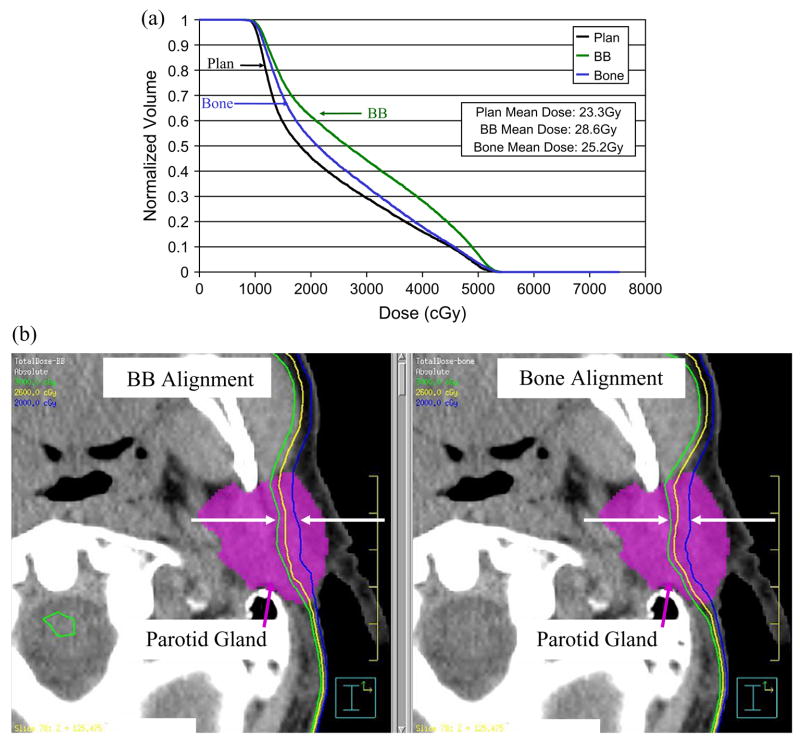
In this study of 11 H&N cancer patients, the cumulative dose distribution was calculated for our current practice, alignment to marks on the immobilization mask (BB), and for a simulated bone alignment technique (bone). When using BB alignment with a 3–4mm PTV margin, target dose coverage was maintained, but the parotid gland mean dose was increased by at least 5Gy in 45% of the patients. When compared to the planned (averaged) ipsilateral mean parotid dose of 33Gy and contralateral mean parotid dose of 24Gy for this group of patients, these parotid dose increases are quite large. This dose increase is due not only to setup uncertainty but to dramatic anatomical changes that occur over the course of radiotherapy as the patients lose weight, their tumor volumes and parotid gland volumes shrink, and the parotid glands’ center-of-volumes move medially into the high dose region (Fig 5). When bone alignment was used, the parotid gland mean dose was decreased by ≤8Gy compared to the dose with BB alignment. This reduction could be clinically significant, particularly if the parotid gland mean dose were already near the limit of 26Gy (12). For example, bone alignment reduced the parotid gland mean dose for Patient 2 from 28.6Gy to 25.2Gy (Fig. 6).
Fig. 5.
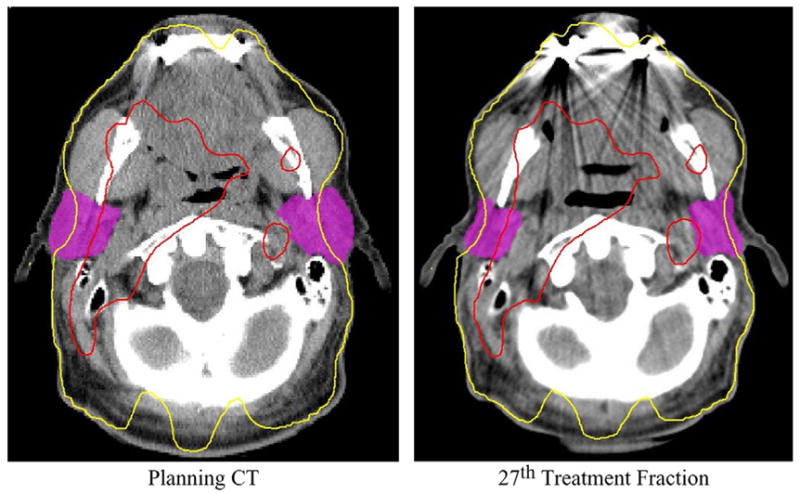
Weight loss, parotid gland shrinkage, and parotid gland center-of-volume medial displacement during a course of radiation therapy leads to an increase in the parotid gland mean dose. Red denotes 63 Gy and yellow 26 Gy.
Fig. 6.
Parotid gland sparing with bone alignment for Patient 2. (a) Dose-volume histogram comparison of a 3Gy parotid gland mean dose reduction. (b) Dose distribution comparison of a 3Gy parotid gland mean dose reduction. Green = 30Gy; Yellow = 26Gy; Blue = 20Gy.
The setup variations we measured were similar to those of other studies (16–19). However, it should be noted that results were dependent on the immobilization method used. With our method, which uses a thermoplastic mesh mask that encompassed the entire head, neck, and shoulder region, the mean 3D displacement of all patients was 3.7mm +/− 1.6mm (excluding Patient 5 with the head-only mask). Our clinical setup procedure also used weekly portal image corrections, which decreased discrepancies between the patient location inside the mask and the external fiducial marks on the mask.
Previous studies, though lacking the repeat CT image sets necessary for calculating the cumulative dose, have estimated the dosimetric effects of setup uncertainty. Astreinidou et al. (1) investigated the dosimetric effect of random setup variation in H&N radiation therapy, assuming no systematic setup variation existed. Planning CT image sets for eight patients were translated and rotated, and the dose distribution was recomputed. Like us, they found that the CTVhigh was unaffected by random displacements and the CTVlow volume receiving 95% of the prescribed dose was reduced by up to 5%. Unlike our study, the parotid gland dose was unaffected.
Hong et al. (2) performed a similar study, shifting the planning CT image sets based on optical tracking of the patient location during the patients’ treatments. They computed DVHs for the best-case scenarios (least motion) and worst-case scenarios (greatest motion). They found that the tumor EUD was reduced by up to 21% with the largest displacements, and by 3–14% with the median and least displacements. They also found increases of ≤3Gy for the parotid gland mean dose. Compared with their study, ours showed much smaller dose reductions to the GTV and CTVhigh but larger mean doses (up to 7Gy) to the parotid gland.
Because these previous studies (1,2) used a single CT image set per patient, they could not account for anatomical changes. Our study, which used multiple CT image sets per patient spread out over the course of radiotherapy, can predict the dosimetric effect of anatomical changes and setup uncertainty, via the calculated cumulative dose distributions. We observed no significant reduction in tumor dose because (1) the tumors shrank over the course of radiotherapy, reducing the effect of tumor displacements due to setup variation, (2) the dosimetric loss caused by one large setup displacement appeared larger when only a single fraction was considered in the previous studies; there was an “averaging-out” effect when multiple fractions were considered, and (3) the setup uncertainty in the study by Hong and colleagues (2) (mean 3D displacement = 7.0mm +/−3.6mm) was twice as large as our setup uncertainty, most likely due to the different immobilization devices used. We observed more significant increases in the parotid gland mean dose because our process of serial CT imaging captured 1) patient weight loss, 2) parotid gland volume loss, and 3) medial displacement of the parotid glands’ center-of-volume into the high dose area over the course of radiotherapy. A single CT image set could not predict those anatomical changes and the resultant parotid gland dose increases. Serial CT scanning with deformable registration is perhaps a more appropriate method to quantify delivered dose distributions to a deformed organ. For clinical purposes, bone alignment can be successfully accomplished with simple orthogonal 2D images with the same effect; however, it does not have the benefit of reconstructing the delivered 3D dose distributions for quantitative analysis or adaptive replanning.
Our dosimetric data analysis relies on deformable image registration, which is a relatively new approach. The validation of deformable image registration is a difficult task by itself, because the ground truth in patients is difficult to obtain. We have previously evaluated the accuracy of our deformable image registration method based on (1) known mathematical image deformations, (2) a physically deformable phantom, and (3) physician-drawn contours (20). For head-and-neck anatomy, more than 99% of the voxels were within 2mm of their intended shifts. The mean residual error was 0.2 +/−0.6mm. For the patients in this study, we have evaluated the contours mapped by the same deformable image transformation. The contours agreed well with the underlining anatomy (the parotid); therefore, we assume that the accuracy of deformable image registration was acceptable in this study. To evaluate how the errors in deformable image registration can affect our results would be a difficult task. Our basic assumption is that the deformable image registration method is reasonably accurate (more accurate than the rigid transformation method) in performing the dose accumulation.
Bone alignment can correct for systematic and random setup errors, but not for anatomical changes. The initial IMRT plan was designed to avoid the parotid glands, located both to the right and to the left of the tumor. Because of the high doses surrounding parotid glands nearly on all sides, almost any setup error will lead to an increase in dose to at least one parotid gland. By eliminating the systematic and random setup uncertainties, the mean parotid dose with bone alignment is less than that with BB alignment. However, bone alignment will not solve the issue of anatomical changes (parotid shrinkage and medial motion), the delivered dose with bone alignment is still higher than the planned parotid dose. Adaptive radiotherapy techniques have the potential to further improve the cumulative dosimetry by adjusting the radiation treatment plan to account for internal anatomic changes as the treatment progresses (21,22). In our future work we will investigate combining bone alignment with adaptive radiotherapy, perhaps achieving even greater dose sparing of the parotid glands. Patients with the largest systematic displacements and the largest anatomical changes would experience the greatest benefits.
CONCLUSIONS
In this study, we analyzed the delivered dose to parotid glands by using in-room volumetric CT images and a deformable dose mapping technique. We compared the differences in the planned dose and the actual delivered dose for parotid glands from two daily setup protocols. With an immobilization mask, weekly portal imaging, and BB alignment, the parotid gland mean dose increased by 5–7Gy in 45% of the patients, compared with the original treatment plan. This is because the marks on the immobilization mask do not represent patient’s internal anatomy accurately. Using bone alignment, instead of BB alignment, reduced the parotid gland mean dose in both parotid glands for 45% of the patients, and in at least one parotid gland for 91% of the patients. Daily image-guided bone alignment (via, for example, orthogonal MV or kV 2D images, in-room volumetric CT images, or cone-beam CT images) is worth the additional effort in order to reduce the occurrence of xerostomia for H&N IMRT patients. Additional benefits of using adaptive radiotherapy to further reduce parotid dose (replanning during the course of IMRT treatment) are also expected, but were not explored in this study. We demonstrated that in-room volumetric image data can be used to reconstruct the cumulative dose distribution.
Acknowledgments
Supported in part by a fellowship from the American Auxiliary Legion of Texas and by NCI grant CA74043.
Footnotes
This work was presented at the 48th Annual Meeting of the American Association of Physicists in Medicine, July 30–August 3, 2006, Orlando, FL.
Conflicts of Interest Notification:
No actual or potential conflicts of interest exist.
Publisher's Disclaimer: This is a PDF file of an unedited manuscript that has been accepted for publication. As a service to our customers we are providing this early version of the manuscript. The manuscript will undergo copyediting, typesetting, and review of the resulting proof before it is published in its final citable form. Please note that during the production process errors may be discovered which could affect the content, and all legal disclaimers that apply to the journal pertain.
References
- 1.Astreinidou E, Bel A, Raaijmakers CP, et al. Adequate margins for random setup uncertainties in head-and-neck IMRT. Int J Radiat Oncol Biol Phys. 2005;61:938–944. doi: 10.1016/j.ijrobp.2004.11.016. [DOI] [PubMed] [Google Scholar]
- 2.Hong TS, Tomé WA, Chappell RJ, et al. The impact of daily setup variations on head-and-neck intensity-modulated radiation therapy. Int J Radiat Oncol Biol Phys. 2005;61:779–788. doi: 10.1016/j.ijrobp.2004.07.696. [DOI] [PubMed] [Google Scholar]
- 3.Siebers JV, Keall PJ, Wu Q, et al. Effect of patient setup errors on simultaneously integrated boost head and neck IMRT treatment plans. Int J Radiat Oncol Biol Phys. 2005;63:422–433. doi: 10.1016/j.ijrobp.2005.02.029. [DOI] [PubMed] [Google Scholar]
- 4.Zhang L, Garden AS, Lo J, et al. Multiple regions-of-interest analysis of setup uncertainties for head-and-neck cancer radiotherapy. Int J Radiat Oncol Biol Phys. 2006;64:1559–1569. doi: 10.1016/j.ijrobp.2005.12.023. [DOI] [PubMed] [Google Scholar]
- 5.Barker J, Garden A, Ang K, et al. Quantification of volumetric and geometric changes occurring during fractionated radiotherapy for head-and-neck cancer using an integrated CT-linear accelerator system. Int J Radiat Oncol Biol Phys. 2004;59:960–970. doi: 10.1016/j.ijrobp.2003.12.024. [DOI] [PubMed] [Google Scholar]
- 6.Court L, Rosen I, Mohan R, et al. Evaluation of mechanical precision and alignment uncertainties for an integrated CT/LINAC system. Med Phys. 2003;30:1198–1210. doi: 10.1118/1.1573792. [DOI] [PubMed] [Google Scholar]
- 7.Zhang L, Dong L, Court L, et al. Validation of CT-assisted targeting (CAT) software for soft tissue and bony target localization. Med Phys. 2005;32:2106. [Google Scholar]
- 8.de Boer HC, van Os MJH, Jansen PP, et al. Application of the No Action Level (NAL) protocol to correct for prostate motion based on electronic portal imaging of implanted markers. Int J Radiat Oncol Biol Phys. 2005;61:969–983. doi: 10.1016/j.ijrobp.2004.09.035. [DOI] [PubMed] [Google Scholar]
- 9.Wang H, Dong L, Lii M, et al. Implementation and validation of a 3-dimensional deformable registration algorithm for targeted prostate cancer radiotherapy. Int J Radiat Oncol Biol Phys. 2005;61:725–735. doi: 10.1016/j.ijrobp.2004.07.677. [DOI] [PubMed] [Google Scholar]
- 10.Wang H, Dong L, O’Daniel J, et al. Validation of an accelerated ‘demons’ algorithm for deformable image registration in radiation therapy. Phys Med Biol. 2005;50:2887–2905. doi: 10.1088/0031-9155/50/12/011. [DOI] [PubMed] [Google Scholar]
- 11.Chao KSC, Deasy JO, Markman J, et al. A prospective study of salivary function sparing in patients with head-and-neck cancers receiving intensity-modulated or three-dimensional radiation therapy: initial results. Int J Radiat Oncol Biol Phys. 2001;49:907–916. doi: 10.1016/s0360-3016(00)01441-3. [DOI] [PubMed] [Google Scholar]
- 12.Eisbruch A, Ten-Haken RK, Kim HM, et al. Dose, volume, and function relationships in parotid salivary glands following conformal and intensity-modulated irradiation of head and neck cancer. Int J Radiat Oncol Biol Phys. 1999;45:577–587. doi: 10.1016/s0360-3016(99)00247-3. [DOI] [PubMed] [Google Scholar]
- 13.Marucci L, Niemierko A, Leibsch NJ, et al. Spinal cord tolerance to high-dose fractionated 3D conformal proton-photon irradiation as evaluated by equivalent uniform dose and dose volume histogram analysis. Int J Radiat Oncol Biol Phys. 2004;59:551–555. doi: 10.1016/j.ijrobp.2003.10.058. [DOI] [PubMed] [Google Scholar]
- 14.Niemierko A. Reporting and analyzing dose distributions: a concept of equivalent uniform dose. Med Phys. 1997;24:103–110. doi: 10.1118/1.598063. [DOI] [PubMed] [Google Scholar]
- 15.Wu Q, Mohan R, Niemierko A, et al. Optimization of intensity-modulated radiotherapy plans based on the equivalent uniform dose. Int J Radiat Oncol Biol Phys. 2002;52:224–235. doi: 10.1016/s0360-3016(01)02585-8. [DOI] [PubMed] [Google Scholar]
- 16.Bel A, Keus R, Vijlbrief RE, et al. Setup deviations in wedged pair irradiation of parotid gland and tonsillar tumors with an electronic portal imaging device. Radiother Oncol. 1995;37:153–159. doi: 10.1016/0167-8140(95)01627-s. [DOI] [PubMed] [Google Scholar]
- 17.de Boer HC, van Sorenson de Koste JR, et al. Electronic portal image assisted reduction of systematic set-up errors in head and neck irradiation. Radiother Oncol. 2001;61:299–308. doi: 10.1016/s0167-8140(01)00437-6. [DOI] [PubMed] [Google Scholar]
- 18.Hunt MA, Kutcher GJ, Burman C, et al. The effect of set-up uncertainties on the treatment of nasopharynx cancer. Int J Radiat Oncol Biol Phys. 1993;27:437–447. doi: 10.1016/0360-3016(93)90257-v. [DOI] [PubMed] [Google Scholar]
- 19.Yan D, Wong J, Vicini F, et al. Adaptive modification of treatment planning to minimize the deleterious effects of treatment setup errors. Int J Radiat Oncol Biol Phys. 1997;38:197–206. doi: 10.1016/s0360-3016(97)00229-0. [DOI] [PubMed] [Google Scholar]
- 20.Wang H, Dong L, O’Daniel J, et al. Validation of an accelerated ‘demons’ algorithm for deformable image registration in radiation therapy. Phys Med Biol. 2005;50:2887–2905. doi: 10.1088/0031-9155/50/12/011. [DOI] [PubMed] [Google Scholar]
- 21.Wu C, Jeraj R, Olivera GH, et al. Re-optimization in adaptive radiotherapy. Phys Med Biol. 2002;47:3181–3195. doi: 10.1088/0031-9155/47/17/309. [DOI] [PubMed] [Google Scholar]
- 22.Wu Q, Liang J, Yan D. Application of dose compensation in image-guided radiotherapy of prostate cancer. Phys Med Biol. 2006;51:1405–1419. doi: 10.1088/0031-9155/51/6/003. [DOI] [PubMed] [Google Scholar]


