

Abstract
The latent viral load is the most important factor that predicts reactivation rates of animals latently infected with herpes simplex virus (HSV). To estimate the latent viral load, individual latently infected mouse trigeminal ganglia were dispersed into single cell suspensions and plated into 96-well real-time PCR plates, and HSV-2 genome copies were measured. By assuming a Poisson distribution for both the number of HSV-2 infected cells per well and the number of HSV-2 genome copies per infected cell, numbers of infected cells and mean genome copies per infected cell were determined. Both the number of HSV-2 infected cells and the mean HSV-2 genome copy per infected cell significantly correlated with the latent viral load (p < 10−4), indicating that both factors are responsible for the increase in the latent viral load.
Keywords: HSV-2, latent viral load, number of HSV-infected neurons, number of HSV genome copies per infected cells, Poisson distribution, Poisson-Poisson model
Introduction
Herpes simplex viruses 1 and 2 (HSV-1 and HSV-2) establish lifelong latent infections in sensory neurons that are punctuated by episodes of symptomatic and asymptomatic reactivations (Gupta et al., 2004; Koelle and Corey, 2003; Rouse and Kaistha, 2006; Stanberry et al., 1999). The latent viral load – the total quantity of viral genomes in a sensory ganglion - appears to remain stable over time (Hill et al., 1996), to be proportional to the titer of the infectious inoculum, and to correlate directly with rates of virus reactivation in explant ganglia (Hoshino et al., 2007; Maggioncalda et al., 1996) or in the guinea pig model (Hoshino et al., 2005; Lekstrom-Himes, Pesnicak, and Straus, 1998), although O'Neil et al reported that the latent viral load in ganglia was independent of the inoculum dose in rabbits (O'Neil et al., 2004). Current data indicate that latency is established in only a small percentage of all sensory neurons in non-immunocompromised humans (Wang et al., 2005). Moreover, the number of copies of HSV-1 genomes residing in each human latently infected neuron is modest (2−50 copies/cell) in most infected cells, based on estimates using quantitative PCR of single cells recovered from dissociated ganglia or by laser capture microdissection (Cai, Pizer, and Levin, 2002; Wang et al., 2005). Some neurons from humans (Wang et al. 2005) and experimentally infected mice (Chen et al., 2002; Sawtell, 1997; Sawtell et al., 2001) may contain ≥1,000 copies of HSV-1 genomes per cell.
We sought to more fully define the determinants of the latent viral load for HSV-2. As has been previously shown for HSV-1 (Sawtell, 1997; Sawtell et al., 2001), higher latent loads can result either from increased numbers of infected neurons or increased numbers of latent genomes per infected neuron, or both. To explore these possibilities in detail for HSV-2, we determined the presence and copy numbers of HSV-2 genomes in thousands of neurons in culture wells of cells plated from trigeminal ganglia (TG) from 2 strains of mice, each infected with a wide range of titers of HSV-2. To render this effort tractable, we assayed dissociated TG cells by PCR and analyzed the results using a Poisson distribution which is used for statistical analyses of infrequent events.
Results
Approximation of the distribution of HSV-2 genome copies in single infected cells using a Poisson distribution
Data obtained from human TG using laser capture microdissection, which isolates single cells for PCR, showed that the number of genome copies in single neurons is distributed over wide range; among HSV genome positive neurons about 40% of the neurons have 5−10 HSV genome copies, 30% have 10−20 copies, and a lower percentage of neurons have a larger number of genome copies (Wang et al., 2005). While the genome copy number determined by laser capture microdissection might be an underestimate, because only a portion of the neuron nucleus might be removed from the tissue section, prior studies in our laboratory showed that the combined efficiency of laser capture microdissection and PCR in recovering DNA from single neurons was over 90% (Wang et al 2005). From the shape of histogram showing the distribution of HSV-2 genome copies (Fig. 1), we postulated that a Poisson distribution analysis would be useful to estimate copy numbers in single infected neurons.
Figure 1.
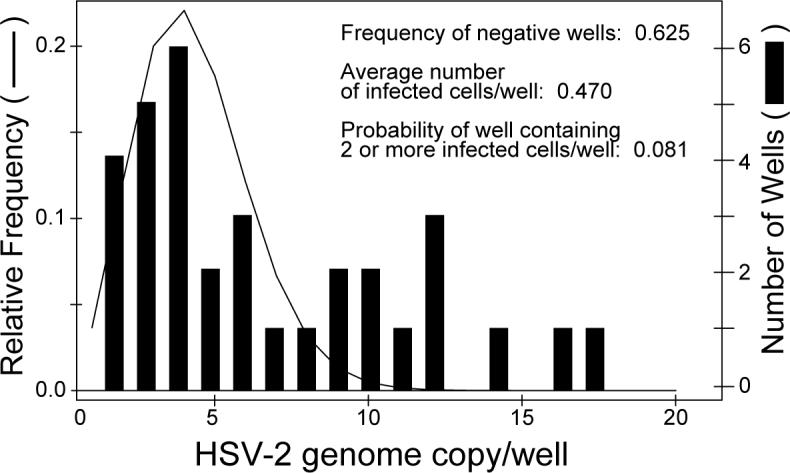
Distribution of HSV-2 genome copies in wells. The histograms represent the number of wells that contains cells that are positive for HSV-2 by real-time PCR. The line indicates an approximation of the relative frequency with an initial mean number of events (mean HSV-2 genome copies per well) of 3.3 that of the distribution of HSV-2 genome copies per well, derived from a Poisson distribution has been shifted right by adding 1 to yield 4.3.
We estimated the number of HSV-2 genome copies in single neurons by preparing single cell suspensions of TG from BL6 and DBA2 mice latently infected with HSV-2 by the cornea route, and diluted the cells into wells until a probability analysis predicted that most wells would contain ≤ 2 HSV-infected cells. We assumed that a single mouse TG contains 100 to 5,000 HSV-infected neurons. Therefore, we diluted suspensions of dissociated TG cells corresponding to half of a TG in 0.5 to 12 mL of PBS based on a rough estimate of the total latent viral load from extract DNA (see below) and plated the cells in 88 wells of 96-well real-time PCR plates. Analysis of wells for HSV-2 DNA by real time PCR indicated that while some wells contained low levels of HSV-2 DNA, most were negative for viral DNA. Thus, the probability of any well containing ≥ 2 HSV-infected cells was relatively small. Therefore, quantitative PCR results for HSV-2 DNA in plates with a small number of positive reactions should represent the distribution of genome copies in single infected cells. In one representative experiment with a small number of positive wells, 37.5% of wells were HSV-2 genome positive (Fig. 1). Based on Poisson distribution, if the average number of HSV-2-positive cells per well is a, the expected frequency of HSV-2-negative wells should be e−a (where e is the base of natural logarithm). Therefore, the frequency of negative wells, 0.625, should represented as e−a. Solving for a, the average number of HSV-2-positive cells per well (= a) should be 0.47 (-Ln of 0.625). Based on this number and assuming a Poisson distribution for infected cells per well, the probability of a well containing ≥ 2 infected cells is 0.08. Therefore among 37.5% of HSV-2 genome positive wells, 21% (8/37.5) should have ≥ 2 infected cells. In other words, 79% (100%−21%) of positive wells should contain only one infected cell.
From the pattern of the histogram of the experimental data (Fig.1), we chose a shifted Poisson distribution to fit the observed distribution of HSV-2 genome copies per well (an estimate of genome copies per infected cell), because a shifted Poisson distribution reasonably fits the data and is parsimonious. Since the number of HSV-2 genome copies is at least one per infected cell, the Poisson distribution is shifted one unit to the right for modeling the number of genome copies (See Materials and Methods). The line in Figure 1 is a Poisson distribution fitted to the observed data (histogram) in which the mean number of events (mean HSV-2 genome copies per well or infected cell) is 4.3. Thus, a shifted Poisson distribution can be used to model the distribution of HSV-2 genomes per infected cell.
Estimation of the number of HSV-2-infected cells per well and mean HSV-2 genome copy per cell
Examination of Figure 1 shows that the shifted Poisson distribution with a mean of 4.3 HSV-2 genome copies per well fits the observed distribution of HSV-2 genome copies per well when there are ≤ 7 HSV-2 genome copies per well. However, wells containing > 7 of HSV-2 genome copies (additional peaks in histogram, Fig. 1) were observed more frequently than expected from the shifted Poisson distribution. Two hypotheses could explain this observation- either these wells contain ≥ 2 HSV-2-infected cells or the findings are due to experimental variability. We suspect that the former hypothesis is correct, since the Poisson distribution predicts that if the average number of infected cells per well is 0.47, about 21% of positive wells have ≥ 2 HSV-2-infected cells, as discussed above. To estimate the actual probability of wells containing ≥ 2 HSV-2-infected cells, we used a second Poisson distribution to estimate the number of HSV-2-infected cells per well. This second Poisson distribution should account for the additional peaks in wells containing >7 HSV-2 genome copies (histogram, Fig. 1). Therefore the observed distribution of HSV-2-positive events per well can be expressed as the sum of the number of genome copies per infected cell over the number of infected cells per well. We assume that the copies per infected cell follows a shifted Poisson distribution and that the number of infected cells also follows a Poisson distribution. We call the composite a Poisson-Poisson model. Using the statistical estimation method of maximum likelihood, we can find the combination of Poisson parameters which best fits the observed data. Three different experiments with different TGs were performed and genome copies were determined by PCR and computer modeling based on the Poisson-Poisson model was performed (Fig. 2). The model based estimated cumulative frequency of HSV-2 genome copies per well (Fig. 2 left panels, thin lines) fit the observed data (thick dots in the same panels). The simulation recapitulated several of the peaks seen in the relative frequency of viral genome copies per well obtained from the PCR data (Fig. 2, right panels). Therefore, the total number of HSV-2-infected cells can be estimated based on the dilution of TG applied to PCR plates (i.e. TG cells plated per well) and the average number of infected cells per well.
Figure 2.

Computer modeling based on a Poisson-Poisson model for HSV-2 genome copies per infected cell and for the numbers of HSV-2-positive cells. Representative results of PCR and computer simulation of 3 different experiments with different TGs are shown. Cumulative (left panels) and relative (right panels) frequencies of HSV-2 genome copies per well were measured by real-time PCR. In the left panels, thick dots indicate cumulative frequencies derived from experimental data (real-time PCR), and thin lines indicate predictions based on computer simulations using the Poisson-Poisson model. In the right panels, the experimental data are shown as histograms, and thin lines indicate predicted relative frequencies based on computer simulations using the Poisson-Poisson model. Each set of panels was obtained from a separate experiment. Top panels are from TG 3, middle panels from TG 6, and bottom panels from TG 10 in Table 2.
Validation of the model
To validate this model, a single cell suspension was prepared from one latently infected TG from a DBA2 mouse infected with 1×10⁴ pfu of HSV-2 onto the cornea and two different dilutions were plated and individual wells were assayed for HSV-2 DNA and analyzed with the Poisson-Poisson model, while another fraction of the cell suspension was assayed directly for HSV-2 DNA. Different dilution factors affect the Poisson distribution for the number of HSV-2 infected cells per well, but not for the mean number of HSV-2 genome copies per infected cell. The first fraction of the cell suspension was diluted at 2 ml per TG and an equivalent fraction was diluted at 8 ml per TG; each were then distributed into 88 wells of a real-time PCR plate. Real-time PCR and mathematical analyses were done independently for the two plates. DNA was extracted from the second fraction of the TG cell suspension and the HSV-2 DNA load was determined by real-time PCR. The numbers of HSV-2-infected cells per well were different due to the different dilution factors, but the mean number of HSV-2 infected cells per TG and HSV-2 genome copies per infected cell from the two dilutions were reasonably close (Table 1). When the latent viral loads of the TG in Table 1 were estimated using the mathematical method (number of HSV-2 infected cells per TG multiplied by the mean HSV-2 genomes copies per infected cell) and compared with the viral load based on extracted DNA from the ganglia, the numbers were 4700 copies of HSV-2 DNA for the 2ml per TG dilution, 3790 copies for the 8 ml per TG dilution, and 5130 copies for the DNA extract. The similarity of these results indicates that the mathematical model, based on the Poisson-Poisson model, provides a reasonable approximation of the true viral load.
Table 1.
Comparison of the estimated total viral load per trigeminal ganglion obtained by mathematical modeling using dilutions of cells from HSV-2 infected ganglion (rows 2 and 3), and by direct extraction of DNA and real-time PCR of cells from other aliquots of the same HSV-2 infected ganglion (row 4).
| Method | Mean number of HSV-2 infected cells/well (95%CI) | Number of HSV-2 infected cells/TGa (95%CI) | Mean HSV-2 genome copy/infected cell (95%CI) | Estimated Total Viral Load/TGb (95%CI) |
|---|---|---|---|---|
| Dilution | 1.87 | 748 | 6.29 | 4700 |
| 2mL/TG | (1.47, 2.32) | (740, 757) | (5.29, 7.34) | (3980, 5520) |
| Dilution | 0.55 | 880 | 4.31 | 3790 |
| 8mL/TG | (0.39, 0.74) | (874, 888) | (3.61, 5.14) | (2770, 5070) |
| DNA extraction | NA | NA | NA | 5130 |
NA=not available
: The number of HSV-2 infected cells/TG was determined by multiplying (mean number of HSV-2 infected cells/well) × (dilution of TG (ml/TG) × 200, since each PCR well contains 5μL of TG cell suspension.
: The estimated total viral load/TG was determined by multiplying (number of HSV-2 infected cells/TG) × (mean HSV-2 genome copy/infected cell) for the row labeled Dilution. The estimated total viral load/TG was determined by multiplying (number of HSV-2 genomes in 200ng of extracted DNA) × (amount of DNA extracted from the TG) for the row labeled DNA extraction.
This model assumes that all of the HSV-2 genomes are present inside of the cells and that no viral DNA is released from cells after collagenase treatment. Therefore we tested for HSV-2 DNA in the supernatants collagenase treatment. None of 176 wells of supernatant derived from 4 TGs were positive for HSV-2 DNA. Therefore most, if not all, of the HSV-2 DNA remains inside the cells after collagenase treatment.
To further validate the results, we performed several experiments with two strains of mice and different doses of inocula in which we compared (a) the latent viral load per TG derived by multiplying the number of infected cells/TG times the mean HSV-2 genome copies per infected cell (obtained from the Poisson-Poisson model) with (b) the viral load obtained by PCR of 200 ng of DNA for extracted from ganglia and then corrected for the total amount of DNA in the ganglia (Table 2). When the data in Table 2 were plotted on a log scale, the correlation between the latent viral load from extracted DNA and from the Poisson-Poisson model was highly correlated (R=0.96, Figure 3). The slope of the regression line was 0.96 (95% CI , 0.82, 1.10) compared with an expected value of 1.0, and the y intercept was 0.08 (95% CI , −1.3, 1.5) compared with an expected value of 0.
Table 2.
HSV-2 latent viral loads in mice inoculated on the cornea with HSV-2.
| TGb | Mouse Strain | Dose of inoculum | Mean number of HSV-2 genome copies/cell (95%CI) | Number of HSV-2 infected cells/TGa (95%CI) | Estimated latent viral load/TG by modelc | Latent viral load/TG by extractiond |
|---|---|---|---|---|---|---|
| 1 | DBA2 | 1,250 | 5.1 (4.2, 6.1) |
128 (125, 131) |
648 | 1,080 |
| 2 | DBA2 | 2,500 | 7.0 (5.5, 8.4) |
76 (74, 78) |
533 | 1,640 |
| 3 | DBA2 | 160,000 | 27.0 (24.7, 29.0) |
1,370 (1,365, 1385) |
37,000 | 57,000 |
| 4 | DBA2 | 160,000 | 34.7 (29.1, 43.0) |
2,800 (2,761, 2,826) |
97,000 | 221,000 |
| 5 | BL6 | 625 | 5.7 (4.8, 6.6) |
136 (134, 139) |
768 | 852 |
| 6 | BL6 | 2,500 | 16.1 (13.1, 17.5) |
1,940 (1,927, 1,957) |
31,200 | 23,300 |
| 7 | BL6 | 2,500 | 28.8 (26.8, 30.4) |
1,460 (1,455, 1,474) |
42,200 | 89,700 |
| 8 | BL6 | 5,000 | 16.7 (14.8, 19.4) |
1,970 (1,956, 1,988) |
32,900 | 44,300 |
| 9 | BL6 | 5,000 | 7.8 (6.9, 8.8) |
952 (945, 961) |
7,440 | 3,920 |
| 10 | BL6 | 5,000 | 14.1 (12.6, 15.5) |
452 (446, 458) |
6,390 | 19,200 |
| 11 | BL6 | 5,000 | 5.3 (3.7, 7.3) |
14 (13.3, 15.1) |
74 | 68 |
| 12 | BL6 | 5,000 | 11.2 (9.5, 13.2) |
1,420 (1,409, 1,440) |
16,000 | 19,200 |
| 13 | BL6 | 5,000 | 9.8 (8.4, 11.2) |
831 (822, 841) |
8,180 | 8,570 |
| 14 | BL6 | 20,000 | 24.8 (22.6, 26.9) |
4,220 (4,206, 4,244) |
105,000 | 32,500 |
| 15 | BL6 | 20,000 | 15.5 (14.1, 16.9) |
3,020 (3,010, 3,040) |
47,000 | 98,400 |
| 16 | BL6 | 20,000 | 9.4 (7.2, 11.1) |
5,390 (5,359, 5,437) |
50,500 | 61,900 |
| 17 | BL6 | 20,000 | 16.8 (11.9, 19.1) |
3,500 (3,477, 3,558) |
58,900 | 53,700 |
: The number of HSV-2 infected cells/TG was determined by multiplying (number of HSV-2 infected cells/well) × (dilution of TG [ml/TG]) × 200
: In some cases, pairs of TGs were evaluated from the same animal. TG 3 and 4, 6 and 7, 8 and 9, 10 and 11, 12 and 13, 14 and 15, 16 and 17 are each left and right TG from the same animal
: The estimated viral load/TG was calculated by multiplying (mean number of HSV-2 genome copies) × (number of HSV-2-infected cells/TG)
: The latent viral load/TG by extraction was calculated by multiplying (number of HSV-2 DNA copies in 200ng of DNA) × (total amount of DNA extracted from the TG cell suspension)
Figure 3.
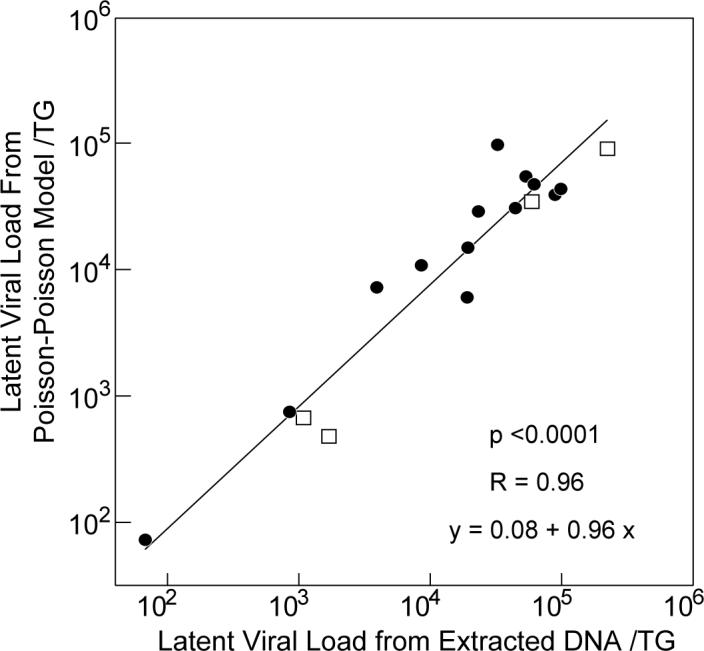
Comparison of total viral loads obtained experimentally by extraction of ganglia DNA and from computer simulation using the Poisson-Poisson model. The latent viral from extracted DNA was calculated by performing real-time PCR using 200ng of ganglia DNA and then correcting for the total amount of DNA per ganglia. The total viral load from computer simulation using the Poisson-Poisson model was calculated by multiplying the number of infected cells/TG by the mean number of HSV-2 genome copies per infected cell (see Table 2). Closed circles represent data obtained from C57BL6 mice; open squares represent data from DBA2 mice. The equation was derived from the linear regression line in the panel.
The latent load of HSV-2 in mouse ganglia is a linear function of both the number of infected neurons and the number of latent genome copies per neuron
The numbers of HSV-2 infected cells per TG ranged from 14 to 5390 (Table 2). For the 13 TG from BL6 mice, the number of HSV-2 infected cells per TG and the doses of the inocula correlated significantly (p=0.013 by Spearman's Rho test). When the number of HSV-2 infected cells per TG (log10) was plotted against the total latent viral load from extracted DNA per TG (log10), a substantial linear correlation was noted (R=0.92, Figure 4A). When the two strains of mice were analyzed separately, the slopes of regression lines of the two strains were very close (0.72 and 0.67 for BL6 and DBA2, respectively). Thus, the linear relationship between the latent viral load and the number of HSV-2 infected cells was similar for both strains of mice. However, analysis of covariance showed that the numbers of HSV-2 infected cells in BL6 mice were significantly higher than those in DBA2 mice (p=0.04), although the difference was small (1.5-fold). This difference might be due to different methods of infection (corneal scarification in BL6 mice vs. no scarification in DBA2 mice), differences in the genetic backgrounds of the mice, or difference in doses of the inoculum.
Figure 4.
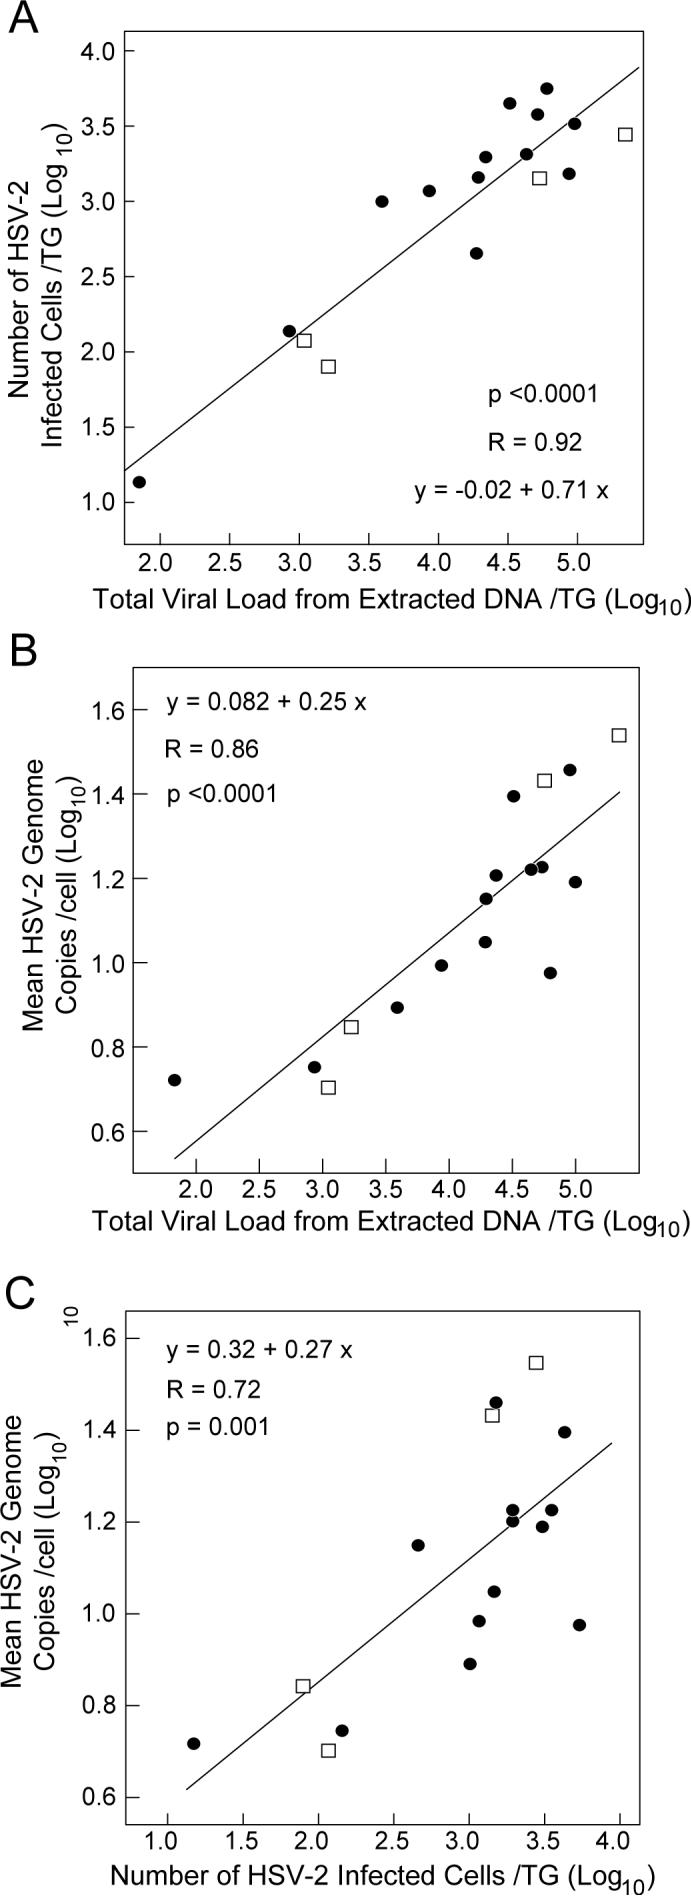
Relationship between the latent viral load, the number of HSV-2 infected cells per TG, and the mean HSV-2 genome copies/infected cell. The number of HSV-2 infected cells per TG (Panel A) and the mean number of HSV-2 genome copies per infected cell (Panel B) are compared with the latent viral loads. Panel C shows the correlation between the number of HSV-2 infected cells per TG (x-axis) and the mean number of HSV-2 genome copies per infected cell (y-axis). Linear regression lines are shown in the scale of log10 and equations of regression and R-values were derived from the lines. Closed circles represent data obtained from C57BL6 mice; open squares represent data from DBA2 mice.
We found that the mean number of HSV-2 genome copies per cell ranged from 5.1 to 34.7 (Table 2). The mean number of HSV-2 genome copies per cell (log10) also correlated strongly with the total latent viral load from extracted DNA per TG (log10) (R=0.86, Figure 4B). When the two strains of mice were analyzed separately, the slopes of the regression lines and their y-axis intersects were similar (y=0.20x+0.26 for BL6 and y=0.36x−0.35 for DBA2, respectively). Thus, when plotted on a log scale, the latent viral load as determined by extraction correlated with both the number of HSV-2 infected cells/TG and the HSV-2 genome copy/cell in a linear fashion, and these correlations were similar in the 2 strains of mice. When the mean number of HSV-2 genomes per cell (log10) was plotted against the number of HSV-2 infected cells per TG (log10), a significant linear correlation was noted (P=0.001, Figure 4C). This suggests that number of HSV-2 genomes per cell is not independent of the number of infected cells, and that similar factors, such as the titer of inocula, and the multiplicity of infection in cornea cells influences both the number of viral genomes per cell and the number of infected cells.
Discussion
In this study we have shown that in HSV-2 latently infected mouse TG, there were 14 to 5,390 infected cells per TG (median 1,424), and the mean number of HSV-2 genome copies per cell was from 5.1 to 34.7 (median 14.1). Based on the size and the morphology of cells we estimate that there are 10,000 neurons in a mouse TG, which is consistent with a prior estimate (Liu et al., 2001). In contrast, other reports calculated 17,000 to 25,000 neurons in a mouse TG (Liebl et al., 1997; Liu et al., 2000; Sawtell, 1997). Sawtell counted neurons that were identified by staining with antibody to neurofilament 200, which is more sensitive than our simple identification based on size and morphology. It is possible that we have underestimated the number of neurons. If we assume that only neurons contain latent HSV, then the frequency of neurons with latent HSV in the mouse is 20 − 50% (5,390/10,000 to 5,390/25,000) depending on the titer of the infectious inoculum and on the latent viral load. Sawtell and colleagues performed semi-quantitative PCR using known numbers of fixed neurons from mouse trigeminal ganglia and reported that the frequency of HSV-1 infected neurons was <1 to 30% (Sawtell, 1997; Sawtell, 1998; Sawtell et al., 1998; Sawtell et al., 2001). Thus, the frequencies of HSV-2 latently infected neurons that we calculated were similar to HSV-1 latently infected neurons estimated by Sawtell and colleagues. Furthermore, Sawtell showed that the number of HSV-1 genomes in single infected cells ranged over a thousand-fold (Sawtell, 1997). Using real-time PCR, we found 4 to 1,500 HSV-2 DNA copies/well, although 95% of wells contained less than 250 HSV-2 DNA copies.
Wang and colleagues performed real-time PCR on individual human neurons obtained by laser capture microdissection and found that 2 to 11% of neurons from human TG were positive for HSV-1 and that the median copy number of HSV genomes in infected cell was 11.3 (Wang et al., 2005). We found that mice receiving the lowest titers of inocula (625 PFU and 1,250 PFU for BL6 and DBA2, respectively, Table 2) had 82 to 136 HSV-2 infected cells per TG; therefore, about 0.4 − 1% of cells were latently infected. These mice had a mean of 4 to 6 copies of HSV-2 DNA per infected cell. Thus, with a low titer of inocula (which we suspect may be more relevant to the titers that occur in human HSV infections), the frequency of HSV infected neurons and the viral copy number per infected cell in HSV-2 latently infected mice was similar to that observed in HSV-1 latently infected humans.
We found that both the log10 of the number of HSV-2 infected cells per TG and the log10 of the mean copy number of HSV-2 genomes per infected cell were a linear function of the log10 of the latent viral load (Figure 4A and 4B). Interestingly, the slopes of the regression lines in each strain of mice were similar, suggesting that the relationship between the latent viral load and the number of HSV-2 infected cells per TG or the mean copy number of HSV-2 genomes per infected cell is independent of the strain of mouse. Since the estimated latent viral load is the product of the number of infected cells times the mean number of HSV genome copies per infected cell, the sum of the slopes of the two regression lines in Figures 4A and B should be 1. In fact, the sum of the slopes of the regression lines in Figures 4A and 4B was 0.96 (0.71 + 0.25), which is concurs with the high correlation coefficient shown in Figure 3.
The latent viral load is one of the most important determinants of the rate of reactivation in explant ganglia in mice (Hoshino et al., 2007; Maggioncalda et al., 1996) and the guinea pig model (Hoshino et al., 2005; Lekstrom-Himes, Pesnicak, and Straus, 1998); however, it is uncertain if one or both of the two components of the latent viral load, the number of infected neurons or the genome copy number in infected cells, is of primary importance in determining the rate of reactivation. Thompson et al reported that the number of infected neurons in TG is more important than the number HSV genomes per neuron (Thompson and Sawtell, 2000). Sawtell showed that the genome copy number in infected cells is also an important factor for reactivation (Sawtell, 1997; Sawtell et al., 1998). Our observation of the significant linear correlations among the total viral load, the number of HSV-2 infected cells, and the mean HSV-2 genome copy in infected cells indicates that these factors are not independent, and therefore that both the latent viral load and the number of infected neurons are important for determining the frequency of reactivation in explant ganglia. Previously, we showed that prophylactic vaccines reduce recurrent genital herpes in guinea pigs by reducing acute disease and reducing the latent viral load. Since the latent viral load correlates with the rate of recurrences, a prophylactic vaccine should reduce both the number of HSV-infected cells and the number of HSV genome copies per infected cell.
Materials and Methods
Animals and Virus
HSV-2 strain 333 was propagated and titered in Vero cells, as described previously (Hoshino et al., 2005). Nine to 10 week old C57BL6 or DBA2 mice were infected with HSV-2 strain 333 at various doses ranges (6.25 ×10² to 2.0 ×10⁴ PFU for BL6 mice, 2.5×10³ to 1.6×10⁵ PFU for DBA2 mice) onto both of their scarified (C57BL6) or not scarified (DBA2) corneas. Human IgG (1:8 dilution in PBS, 0.5 ml/animal) was administered intraperitoneally so that most infected mice would survive acute infection and maintain long term latency (Dalai et al., 2002).
Preparation of 88-well aliquots of cells from trigeminal ganglia
At 29 to 33 days after infection mice were sacrificed and their TG were harvested aseptically. One TG from each mouse was frozen immediately at −80°C for later PCR assay of the total latent viral load, while the contralateral TG from each mouse was dispersed with collagenase Type I (Sigma-Aldrich, St. Louis, MO, 3 mg/ml, 37°C for 1−1.5h) into a single cell suspension (Hoshino et al., 2005), heated for 30 min at 95°C to inactivate the collagenase, washed, and resuspended in TE buffer (10 mM Tris HCl pH 8.0, 1 mM EDTA). Aliquots of dispersed cells equivalent to half of each TG were stored at −80°C. We assumed that each TG contains about 100 to 5,000 HSV-2-infected cells based on an estimate of 10,000−25,000 neurons in a mouse TG (Liebl et al., 1997; Liu et al., 2001; Liu et al., 2000; Sawtell, 1997). The remainder of each cell suspension was diluted in 0.5 to 12 ml of PBS to yield an average of 0.5 to 3 HSV-2-infected cells/well. The TG cell suspensions were plated into 88 wells of Optical 96-well reaction plates (PE Applied Biosystem) and DNA was extracted by addition of TE buffer supplemented with proteinase K (0.4 mg/ml, Sigma) and Tween 20 (1%; Sigma). Each plate was incubated at 55°C for 1 hr followed by inactivation of proteinase K for 15 min at 75°C.
To determine if HSV-2 DNA was present outside of neurons, 2 mice were infected with 2.0 ×10⁴ PFU of HSV-2 and 6 weeks from infection, 4 TGs were dispersed in collagenase as described. After the cells were centrifuged, the remaining supernatants were transferred to another tube and heated to 95°C for 30 min to inactivate the collagenase. Supernatants were plated into 96-well PCR plates (44 wells for each TG with 5 ul of supernatant per well), treated with proteinase K and Tween 20 as described above, and the number of HSV-2 genome copies was measured.
To determine if the single cell suspension actually contained clumps of cells, 4 TGs from 2 mice were dissociated with collagenase, washed with PBS, fixed with 70% ethanol, and washed again. The cells were the treated with 50μL of RNAse A (Sigma) for 30 min at 37°C, and stained with propidium iodide (5μg/mL). Flow cytometry was performed using a FACS Caliber (Becton Dickinson, Franklin Lakes, NJ) and cell clumps were identified in the plot of FL2-area versus FL2-width. The frequency of clumped cells was 4.2−5.9%.
Real-time quantitative PCR
Real-time PCR for HSV-2 DNA was performed on extracts of each well of dissociated TG cells using a Taqman System, ABI 7700 Sequence Detector (PE Applied Biosystem, Foster City, CA) with primers and probes specific for HSV 2 glycoprotein D (gD2) sequences (Dalai et al., 2002). The sequence of the forward primer was, 5’- TCAGCGAGGATAACCTGGGA-3’, and the reverse primer was, 5’-GGGAGAGCGTACTTGCAGGA-3’. The probe was TAMRA-5’-CCAGTCGTTTATCTTCACTAGCCGCAGGTA-3’. A standard curve with known numbers of copies of a gD2-containing plasmid diluted in salmon sperm DNA was used to determine copy numbers. The lower limit of this PCR assay was ∼4 copies/reaction with excellent linearity (R>0.92) over 4 logs of DNA content. Addition of uninfected cells did not inhibit PCR of HSV-2 DNA in infected cells until about 10,000 uninfected cells were added per well.
DNA was also extracted from frozen cell suspensions each equivalent to a half TG using a Puregene DNA isolation kit (Gentra Systems, Minneapolis, Minnesota) and the number of HSV-2 genome copies was determined from 200 ng of extracted DNA using real-time PCR. The amount of DNA extracted from a TG was 8.7 ± 1.3 μg/TG (mean ± SE) measured by spectrophotometry. The total latent DNA viral load was calculated based on the fraction of total ganglia DNA that was assayed in the PCR reaction.
Computational and Statistical Analysis
We used separate Poisson models to obtain the mean number of HSV-2-infected cells per TG and the mean number of HSV-2 genome copies per infected cell. Since the number of genome copies is at least one within an infected cell, the Poisson distribution is shifted one unit for modeling the number of genome copies. Thus if we denote the number of genome copies for a given well as Y, the number of genome copies for a given cell as W, and the number of infected cells as X, we have Y = W1 +W2 + . . . WX, with Y=0 if X=0. We assume that X has a Poisson distribution with parameter λ and each W-1 has a Poisson distribution with parameter β. It is difficult to obtain reproducible results at less than 4 copies without assaying very large numbers of wells. Any genome copy numbers less than 4 were treated as censored over the interval 1 to 4, because the genome copy generated from standard curve is not fully reliable near the limit of detection and unequal distributions of viral genomes in each well. The observed data are skewed since there are a few wells with a large number of genome copies; thus, the variance of the sample is up to 100 times that of the sample mean. Some of the variation may be due to cells that are clumped together. In order to obtain a robust result, a truncated likelihood method was used. Any well where the number of genome copies exceeded 3 standard deviations of the sample mean was discarded. The truncated likelihood appropriately adjusts for this discarding rule in obtaining estimates of the Poisson parameters. The number of discarded wells was 0 in 3 plates, 1 in 5 plates, 2 in 6 plates, 3 in 2 plates, 4 in 1 plate out of 17 plates each of which contained 88 wells. The fraction of HSV-2 genome copies in discarded wells was 12.4 ± 2.1% (mean ± SE) of the total of HSV-2 genomes in each. The method of maximum likelihood was used to estimate λ and β. The 95% confidence intervals were provided by using the likelihood ratio statistic (Cox and Hinkley, 1974; Lehmann, 1983). For a sensitivity analysis, we also used a skewed model where the number of genome copies per cell minus 1, followed a negative binomial distribution, while the number of infected cells per well followed a Poisson distribution. The results of the two analyses were similar. Statistical analysis was done using Splus 5 for Unix software (Mathsoft, Inc. Seattle, WA).
Acknowledgements
This study was supported by the intramural research program of the National Institute of Allergy and Infectious Diseases. Yo Hoshino's work was partially supported by the Japan Herpes Virus Infection Forum (JHIF). We thank Kennichi Dowdell and Kening Wang for suggestions and assistance.
Footnotes
Publisher's Disclaimer: This is a PDF file of an unedited manuscript that has been accepted for publication. As a service to our customers we are providing this early version of the manuscript. The manuscript will undergo copyediting, typesetting, and review of the resulting proof before it is published in its final citable form. Please note that during the production process errors may be discovered which could affect the content, and all legal disclaimers that apply to the journal pertain.
This paper is dedicated to the memory of Stephen E. Straus, who was our mentor and inspiration for this study
References
- Cai GY, Pizer LI, Levin MJ. Fractionation of neurons and satellite cells from human sensory ganglia in order to study herpesvirus latency. J Virol Methods. 2002;104(1):21–32. doi: 10.1016/s0166-0934(02)00032-0. [DOI] [PubMed] [Google Scholar]
- Chen XP, Mata M, Kelley M, Glorioso JC, Fink DJ. The relationship of herpes simplex virus latency associated transcript expression to genome copy number: a quantitative study using laser capture microdissection. J Neurovirol. 2002;8(3):204–10. doi: 10.1080/13550280290049642. [DOI] [PubMed] [Google Scholar]
- Cox DR, Hinkley DV. Theoretical Statistics. Chapman and Hall.; London: 1974. [Google Scholar]
- Dalai SK, Pesnicak L, Miller GF, Straus SE. Prophylactic and therapeutic effects of human immunoglobulin on the pathobiology of HSV-1 infection, latency, and reactivation in mice. J Neurovirol. 2002;8(1):35–44. doi: 10.1080/135502802317247794. [DOI] [PubMed] [Google Scholar]
- Gupta R, Wald A, Krantz E, Selke S, Warren T, Vargas-Cortes M, Miller G, Corey L. Valacyclovir and acyclovir for suppression of shedding of herpes simplex virus in the genital tract. J Infect Dis. 2004;190(8):1374–81. doi: 10.1086/424519. [DOI] [PubMed] [Google Scholar]
- Hill JM, Gebhardt BM, Wen R, Bouterie AM, Thompson HW, O'Callaghan RJ, Halford WP, Kaufman HE. Quantitation of herpes simplex virus type 1 DNA and latency-associated transcripts in rabbit trigeminal ganglia demonstrates a stable reservoir of viral nucleic acids during latency. J Virol. 1996;70(5):3137–41. doi: 10.1128/jvi.70.5.3137-3141.1996. [DOI] [PMC free article] [PubMed] [Google Scholar]
- Hoshino Y, Dalai SK, Wang K, Pesnicak L, Lau TY, Knipe DM, Cohen JI, Straus SE. Comparative efficacy and immunogenicity of replication-defective, recombinant glycoprotein, and DNA vaccines for herpes simplex virus 2 infections in mice and guinea pigs. J Virol. 2005;79(1):410–8. doi: 10.1128/JVI.79.1.410-418.2005. [DOI] [PMC free article] [PubMed] [Google Scholar]
- Hoshino Y, Pesnicak L, Cohen JI, Straus SE. Rates of Reactivation of Latent Herpes Simplex Virus from Mouse Trigeminal Ganglia Ex Vivo Correlate Directly with the Viral Load and Inversely with the Number of Infiltrating CD8+T Cells. J Virol. 2007;81(15):8157–64. doi: 10.1128/JVI.00474-07. [DOI] [PMC free article] [PubMed] [Google Scholar]
- Koelle DM, Corey L. Recent progress in herpes simplex virus immunobiology and vaccine research. Clin Microbiol Rev. 2003;16(1):96–113. doi: 10.1128/CMR.16.1.96-113.2003. [DOI] [PMC free article] [PubMed] [Google Scholar]
- Lehmann EL. Theory of point estimation. John Wiley and Sons; New York: 1983. [Google Scholar]
- Lekstrom-Himes JA, Pesnicak L, Straus SE. The quantity of latent viral DNA correlates with the relative rates at which herpes simplex virus types 1 and 2 cause recurrent genital herpes outbreaks. J Virol. 1998;72(4):2760–4. doi: 10.1128/jvi.72.4.2760-2764.1998. [DOI] [PMC free article] [PubMed] [Google Scholar]
- Liebl DJ, Tessarollo L, Palko ME, Parada LF. Absence of sensory neurons before target innervation in brain-derived neurotrophic factor-, neurotrophin 3-, and TrkC-deficient embryonic mice. J Neurosci. 1997;17(23):9113–21. doi: 10.1523/JNEUROSCI.17-23-09113.1997. [DOI] [PMC free article] [PubMed] [Google Scholar]
- Liu T, Khanna KM, Carriere BN, Hendricks RL. Gamma interferon can prevent herpes simplex virus type 1 reactivation from latency in sensory neurons. J Virol. 2001;75(22):11178–84. doi: 10.1128/JVI.75.22.11178-11184.2001. [DOI] [PMC free article] [PubMed] [Google Scholar]
- Liu T, Khanna KM, Chen X, Fink DJ, Hendricks RL. CD8(+) T cells can block herpes simplex virus type 1 (HSV-1) reactivation from latency in sensory neurons. J Exp Med. 2000;191(9):1459–66. doi: 10.1084/jem.191.9.1459. [DOI] [PMC free article] [PubMed] [Google Scholar]
- Maggioncalda J, Mehta A, Su YH, Fraser NW, Block TM. Correlation between herpes simplex virus type 1 rate of reactivation from latent infection and the number of infected neurons in trigeminal ganglia. Virology. 1996;225(1):72–81. doi: 10.1006/viro.1996.0576. [DOI] [PubMed] [Google Scholar]
- O'Neil JE, Loutsch JM, Aguilar JS, Hill JM, Wagner EK, Bloom DC. Wide variations in herpes simplex virus type 1 inoculum dose and latency-associated transcript expression phenotype do not alter the establishment of latency in the rabbit eye model. J Virol. 2004;78(10):5038–44. doi: 10.1128/JVI.78.10.5038-5044.2004. [DOI] [PMC free article] [PubMed] [Google Scholar]
- Rouse BT, Kaistha SD. A tale of 2 alpha-herpesviruses: lessons for vaccinologists. Clin Infect Dis. 2006;42(6):810–7. doi: 10.1086/500141. [DOI] [PubMed] [Google Scholar]
- Sawtell NM. Comprehensive quantification of herpes simplex virus latency at the single-cell level. J Virol. 1997;71(7):5423–31. doi: 10.1128/jvi.71.7.5423-5431.1997. [DOI] [PMC free article] [PubMed] [Google Scholar]
- Sawtell NM. The probability of in vivo reactivation of herpes simplex virus type 1 increases with the number of latently infected neurons in the ganglia. J Virol. 1998;72(8):6888–92. doi: 10.1128/jvi.72.8.6888-6892.1998. [DOI] [PMC free article] [PubMed] [Google Scholar]
- Sawtell NM, Poon DK, Tansky CS, Thompson RL. The latent herpes simplex virus type 1 genome copy number in individual neurons is virus strain specific and correlates with reactivation. J Virol. 1998;72(7):5343–50. doi: 10.1128/jvi.72.7.5343-5350.1998. [DOI] [PMC free article] [PubMed] [Google Scholar]
- Sawtell NM, Thompson RL, Stanberry LR, Bernstein DI. Early intervention with high-dose acyclovir treatment during primary herpes simplex virus infection reduces latency and subsequent reactivation in the nervous system in vivo. J Infect Dis. 2001;184(8):964–71. doi: 10.1086/323551. [DOI] [PubMed] [Google Scholar]
- Stanberry L, Cunningham A, Mertz G, Mindel A, Peters B, Reitano M, Sacks S, Wald A, Wassilew S, Woolley P. New developments in the epidemiology, natural history and management of genital herpes. Antiviral Res. 1999;42(1):1–14. doi: 10.1016/s0166-3542(99)00004-2. [DOI] [PubMed] [Google Scholar]
- Thompson RL, Sawtell NM. Replication of herpes simplex virus type 1 within trigeminal ganglia is required for high frequency but not high viral genome copy number latency. J Virol. 2000;74(2):965–74. doi: 10.1128/jvi.74.2.965-974.2000. [DOI] [PMC free article] [PubMed] [Google Scholar]
- Wang K, Lau TY, Morales M, Mont EK, Straus SE. Laser-capture microdissection: refining estimates of the quantity and distribution of latent herpes simplex virus 1 and varicella-zoster virus DNA in human trigeminal Ganglia at the single-cell level. J Virol. 2005;79(22):14079–87. doi: 10.1128/JVI.79.22.14079-14087.2005. [DOI] [PMC free article] [PubMed] [Google Scholar]