

Abstract
Background
Dyslipidemia is very common in patients with human immunodeficiency virus (HIV) infection but current therapies are often suboptimal. Because niacin may cause insulin resistance and hepatotoxicity, it has generally been avoided in this setting.
Methods
Non-diabetic male subjects (N=33) who had well-controlled HIV infection on antiretroviral therapy, fasting triglycerides ≥ 2.26 mmol/L and non-high density lipoprotein cholesterol (non-HDL-C) ≥ 4.66 mmol/L received escalating doses of extended-release niacin up to 2000 mg nightly for up to 44 weeks.
Results
Fourteen subjects (42%) had prediabetes at entry. Twenty-three subjects (70%) received the maximum dose, eight (24%) received 1500 mg. Niacin was well-tolerated. Only four subjects (12%) discontinued study treatment. There were small increases in fasting glycemia and insulin resistance estimated by the homeostasis model assessment, but insulin resistance measures from the two-hour oral glucose tolerance test only transiently worsened. No subject developed persistent fasting hyperglycemia; one had persistently elevated 2-hour glucose > 11.1 mmol/L. There were no significant changes in serum transaminases or uric acid. At week 48, the median change in fasting lipid levels in mmol/L (interquartile range) were: total cholesterol −0.21 (−1.35, −0.05), HDL-C +.013 (−0.03, +0.28), non-HDL-C −0.49 (−1.37, +0.08), triglycerides −1.73 (−3.68, −0.72). Favorable changes in large HDL and large very low density lipoprotein particle concentration were observed by nuclear magnetic resonance spectroscopy.
Conclusions
Extended-release niacin in doses up to 2000 mg daily was safe, well-tolerated, and efficacious in HIV-infected subjects with atherogenic dyslipidemia. Increases in glycemia and insulin resistance tended to be transient.
Keywords: HIV, niacin, dyslipidemia, cholesterol, triglycerides, insulin resistance, oral glucose tolerance
INTRODUCTION
Dyslipidemia is very common in patients with human immunodeficiency virus (HIV) infection [1–3] and is accentuated by treatment with antiretroviral drugs [4, 5]. The lipid changes induced by antiretrovirals appear to be responsible at least in part for the increase in myocardial infarction reported among HIV-infected patients receiving combination antiretroviral therapy [6, 7]. Although guidelines suggest using statins and fibrates in patients on ART [8], the effectiveness of these agents is limited, even in combination [9]. Niacin may cause insulin resistance [10], worsening of diabetic control [11], and hepatotoxicity [12, 13]. Thus, niacin has generally been avoided in HIV-infected patients [8], where insulin resistance and diabetes mellitus are increasingly common, especially among those receiving antiretroviral treatment [14, 15] and when lipodystrophy is present [16].
In a recent cross-sectional evaluation of 100 stable, long-term recipients of indinavir-based antiretroviral regimens, 46% of subjects had fasting triglyceride levels of > 2.26 mmol/L, 75% had HDL cholesterol levels of < 1.0 mmol/L and 23% had both triglycerides > 2.26 mmol/L and non-HDL cholesterol levels of > 4.66 mmol/L [17]. Elevations in very low density lipoprotein (VLDL) cholesterol and low HDL cholesterol are much more common than isolated elevations in low density lipoprotein (LDL) in patients on antiretroviral therapy [4, 18]. Thus, lipid abnormalities which are potentially treatable with niacin [19, 20], are particularly prevalent among HIV-infected subjects receiving antiretroviral treatment and emphasize the need to identify additional agents for treatment such as niacin.
Recent studies suggest that the effect of niacin on glycemic control in diabetic subjects is small or transient [21, 22]. A 14 week study in 14 HIV-infected subjects showed that extended-release niacin improved total cholesterol, non-HDL cholesterol, and triglycerides but suggested that the drug caused insulin resistance [23]. The purpose of this 48 week study was to determine if extended-release niacin is safe and effective in dyslipidemic patients with HIV infection on antiretroviral therapy. In particular, we examined effects on glucose metabolism over an extended period of time
MATERIALS AND METHODS
Subjects
HIV-infected individuals ages 18 years or older were eligible for entry if they had fasting non-HDL-C ≥ 4.66 mmol/L and serum triglycerides ≥ 2.26 mmol/L within 30 days of study entry, on stable antiretroviral therapy for three months prior to study entry and planning to stay on current therapy, not be pregnant and if capable of becoming pregnant use adequate contraception. Laboratory criteria included fasting glucose level < 7.0 mmol/L, platelets ≥ 50,000/mm3, absolute neutrophil count > 750/mm3, hemoglobin > 91 g/L for men and > 89 g/L women, serum creatinine < 2 times the upper limit of normal, total bilirubin < 2.5 times upper limit of normal, alanine aminotransferase and aspartate aminotransferase < 2 times upper limit of normal. Subjects were exclude if they had known coronary heart disease or a coronary heart disease risk equivalent [19], class III or IV congestive heart failure, uncontrolled hypertension, acute gout, active peptic ulcer disease, current diagnosis of diabetes mellitus, untreated hypothyroidism, active or symptomatic gallbladder disease within one year, receipt of any prescription lipid-lowering agents or any niacin-containing products that contain > 100 mg daily within 30 days, systemic glucocorticoids above replacement levels, antidiabetic medication, serious drug dependence, active opportunistic infection, or other acute illness. At week 4 of study, subjects were required to have serum glucose < 11.1 mmol/L two hours after glucose challenge, before study drug was started. Replacement doses of androgens and estrogens were allowed. A total of 37 subjects entered the trial; results are presented for those 33 subjects who were eligible to initiate study drug at week 4. All subjects provided written informed consent per the guidelines of each of the 7 participating AIDS Clinical Trials Group sites’ Institutional Review Boards.
Drug treatment
Extended-release niacin (Niaspan®, Kos Pharmaceuticals) was supplied as 500 mg and 1000 mg tablets. At week 4, all subjects initiated extended-release niacin at 500 mg before bedtime with a low-fat snack. At week 8 (week 4 of niacin administration), all subjects increased extended-release niacin to 1000 mg before bedtime. Subsequent dose increases were dependent upon drug tolerability and achieving a composite lipid goal of non-HDL cholesterol < 4.14 mmol/L, LDL cholesterol < 3.37 mmol/L, and triglycerides < 5.65 mmol/L. If the triglycerides were > 4.52 mmol/L and the LDL cholesterol could not be calculated, then the decision to dose escalate was dependent on a composite goal of non-HDL-C < 4.14 mmol/L and triglycerides < 5.65 mmol/L. At week 14 (week 10 of niacin administration), subjects who had not achieved the composite lipid goal at their week 12 evaluation increased to 1500 mg before bedtime. At week 20 (week 16 of niacin adminstration), subjects who had not achieved the composite lipid goal at their week 18 evaluation increased to 2000 mg before bedtime. Subjects then remained on the dose reached by week 20 throughout the remainder of the study. Those who were unable to tolerate a dosage increase continued at the previously tolerated dose for the duration of the study. All doses of niacin were given with 325 mg of enteric-coated aspirin 30 minutes prior to niacin dosing. Aspirin-intolerant subjects had the option to use ibuprofen 200 mg or naproxen 225 mg instead of aspirin.
Evaluations
Fasting serum glucose (defined as at least 8 hours with no food or beverage other than water), uric acid, creatinine, and aminotransferase levels were performed locally at sites, and standard lipid profiles (performed centrally) were each obtained at entry and weeks 4, 8, 12, 18, 24, 32, 40 and 48. An oral glucose tolerance test (OGTT), with sampling at −10, −5, 30, 60, 90, and 120 minutes relative to ingestion of 75 gm dextrose, was done at weeks 4, 12, 24, and 48. Plasma for advanced lipoprotein testing, lipoprotein (a), and C-reactive protein were collected at 4, 24, and 48 weeks.
Assays
Centrally-performed assays used specimens stored at −70°C and shipped on dry ice. Advanced lipoprotein testing was done by nuclear magnetic resonance spectroscopy [24] (NMR Lipoprofile®), high sensitivity C-reactive protein was done using an immunometric assay (DPC Immulite 2000), and lipoprotein (a) was measured by an immunoturbidimetric assay (Denka Seiken USA) on EDTA plasma at LipoScience (Raleigh, NC). All other assays were performed at the ACTG central metabolic laboratory at Quest Diagnostics Incorporated (Baltimore, MD). Serum insulin concentration was measured by an enzyme-labeled immunometric assay (DPC Immulite 2000), all performed in a single run for each subject to eliminate inter-assay variability. Total cholesterol, HDL cholesterol, and triglycerides were measured using standard enzymatic techniques. LDL cholesterol was calculated by the Friedewald equation [25] when triglycerides were < 4.52 mmol/L. Non-HDL cholesterol was calculated as total cholesterol minus HDL cholesterol. Fructosamine (glycated albumin), a measure of glycemia over the preceding 2–3 weeks [26], used a colorimetric technique.
Definitions
Impaired fasting glucose (IFG) was defined as fasting glucose 5.55–6.94 mmol/L [27]. Impaired glucose tolerance (IGT) was defined as a 2-hour glucose level during OGTT of 7.77–11.0 mmol/L. Pre-diabetes was defined as the presence of either IFG or IGT. Diabetes mellitus was defined as fasting glucose of ≥ 7.0 mmol/L (confirmed on repeat testing) or a 2-hour glucose level of ≥ 11.1 mmol/L on oral glucose tolerance testing [27]. Normal glucose tolerance was defined as the absence of pre-diabetes or diabetes mellitus. Serious hyperglycemia was defined as persistent fasting glucose > 11.1 mmol/L or symptomatic diabetes mellitus.
Statistical analyses
The primary endpoints of the study were changes from week 4 in safety measures including glucose metabolism (fasting glucose, fasting insulin, HOMA-IR, and OGTT glucose and insulin area-under-the-curve [AUC]), hepatic transaminases, fructosamine, uric acid, and new onset of diabetes mellitus. The primary objective was to evaluate the safety and tolerability of extended-release niacin therapy. Secondary objectives included evaluating the efficacy of extended-release niacin through 44 weeks of therapy. Efficacy endpoints included changes from week 4 in lipid parameters and anthropometric measurements. Subjects who ever received study therapy and prematurely discontinued treatment after week 4 were included in an intention-to-treat approach. When antiretroviral drug changes occurred that had the potential to favorably affect lipid results, additional secondary analyses were conducted on lipid endpoints with censoring at the time of the regimen change. The study was powered based on both the primary safety objective and one of the secondary objectives. The sample size allowed us to have 85% power for a one-sided Wilcoxon-signed rank test with a type I error of 5% to detect 6% changes in non-HDL from week 4, assuming a standard deviation of 11%.
Wilcoxon-signed rank test was used to evaluate whether changes from week 4 were significant. Generalized Estimating Equation (GEE)-based repeated measure models were used to explore whether the parameters changed significantly over time, while taking into account the correlation of measurements within each participant. Exchangeable correlation structure was assumed. Mixed models were also used to confirm the results. The 95% confidence intervals for the estimated rates were calculated by the exact method. All analyses were performed using SAS release 8.02 (SAS Institute, Cary, North Carolina, USA).
RESULTS
Baseline demographic, clinical and laboratory features are shown in Table 1. Subjects were all male, had a median age of 43 years, and were predominantly white (67%) and smokers (64%). Subjects tended to be abdominally obese with 20 of 32 (63%) of those with a waist to hip ratio had a ratio of ≥ 0.95 and 10 of 32 (31%) of those with a waist circumference measurement had a waist circumference of ≥ 100 cm. Most (94%) of subjects received nucleoside reverse transcriptase inhibitors. Nearly half (48%) received nonnucleoside reverse transcriptase inhibitors and 70% were taking protease inhibitors. Fourteen (42%) of subjects had pre-diabetes. Of these, 5 had impaired fasting glucose alone, 5 had impaired glucose tolerance alone, 4 had both conditions.
Table 1.
Baseline characteristics of 33 subjects who initiated extended-release niacin at study week 4.
| Median age, years (range) | 43 (33, 62) |
| Gender | All male |
| Race/ethnicity | White, not hispanic - 22 (67%); Black - 6 (18%); Hispanic - 4 (12%); American Indian - 1 (3%) |
| Injection drug use | Previous - 1 (3%); Never - 32 (97%) |
| Cigarette smoking | Yes - 21 (64%); No - 12 (36%) |
| Median body mass index, kg/m2 (IQR) | 25.0 (22.9,28.1) |
| Median waist circumference, cm (IQR) | 93 (88, 101) |
| Median waist to hip ratio (IQR) | 0.96 (0.94, 1.0) |
| Median CD4+ cells/mm3 (IQR) | 488 (290, 605) |
| HIV RNA < 50 copies/mL | 32/33 (97%) |
| Glucose tolerance category | 19 (58%) normal; 14 (42%) pre-diabetes |
| Antiretroviral therapy | NRTIs 94% (abacavir 24%, stavudine 18%, lamivudine or emtricitabine 76%, didanosine 9%, tenofovir 18%, zidovudine 45%) |
| NNRTIs 48% (efavirenz 39%, nevirapine 6%) | |
| PIs 70% (lopinavir/ritonavir 45%, indinavir 9%, ritonavir 9%, amprenavir 9%, saquinavir 6%, nelfinavir 6%) |
Body mass index and glucose tolerance category were determined at week 4. IQR - interquartile range.
NRTI - nucleoside reverse transcriptase inhibitor; NNRTI - nonnucleoside reverse transcriptase inhibitor; PI - protease inhibitor.
Thirty-two of 33 subjects completed the study. Four subjects prematurely discontinued study therapy, but three of these individuals were followed until completion. The median daily dose of extended-release niacin achieved was 2000 mg. Twenty-three (70%) reached 2000 mg, 8 (25%) reached 1500 mg, and 1 (3%) reached 1000 mg. Three subjects stopped dose titration before reaching 2000 mg or meeting the composite lipid goal: one due to transiently elevated glucose and two due to missed visits.
Glucose metabolism
No cases of serious hyperglycemia occurred. The highest fasting serum glucose measured at sites during routine monitoring was 7.77 mmol/L and the highest fasting plasma glucose measured centrally was 7.83 mmol/L. No cases of persistently elevated fasting glucose (≥ 7.0 mmol/L on a repeat test) occurred, by either site or central testing. One subject who had impaired fasting glucose and normal glucose tolerance at week 4 developed a persistently elevated 120-minute glucose on OGTT (12.6 and 11.38 mmol/L at weeks 24 and 48, respectively). There was no overall change in glycemia over time based on site monitoring (p=0.4 by GEE, Figure 1). Centrally-performed glucose metabolism-related results are shown in Table 2. No changes in fructosamine levels occurred. A consistent increase in fasting plasma glucose and serum insulin occurred at all time points after study drug initiation, but the magnitude of increased glucose was small (median 0.22–0.33 mmol/L). This was reflected by significant increases in HOMA-IR at weeks 12, 24, and 48. The 30-minute Δ insulin/Δglucose, which reflects the B-cell response to oral glucose [28], was increased at week 12 only. There were no changes from baseline in the total glucose AUC or the 120-minute glucose values. Median insulin values during the entire OGTT are shown graphically in Figure 2. There were increases in the total insulin AUC at week 12 and decreases in the insulin sensitivity index [29] at weeks 12 and 24, both findings consistent with the development of insulin resistance. However both of these measures were not significantly different from week 4 at week 48.
Figure 1.
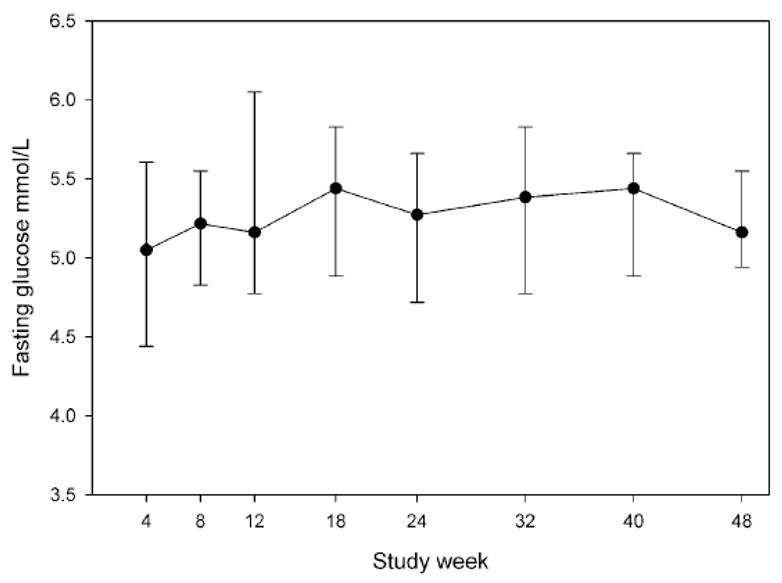
Median fasting serum glucose measured at study sites in mmol/L, by study week. Bars represent interquartile range. Ptrend =0.4 by the generalized estimating equation.
Table 2.
Measures of glucose metabolism while fasting and during 75 gm oral glucose challenge.
| Week 4 | Week 12 | Week 24 | Week 48 | |
|---|---|---|---|---|
| Fasting plasma glucose, mmol/L | 5.47 (5.05, 5.74) | 5.65 (5.3, 6.09) p=0.001 | 5.77 (5.32, 6.24) p=0.003 | 5.59 (5.24, 6.05) p=0.041 |
| Fasting insulin, pmol/L | 66 (38, 120) | 83 (54, 128) p=0.046 | 104* (49, 153) p=0.003 | 99 (56, 131) p=0.016 |
| HOMA IR, uU/ml × mmol/L | 2.4 (1.3, 4.6) | 3.1 (1.9, 5.4) p=0.034 | 3.9* (1.8, 6.5) p=0.002 | 3.5 (2.0, 5.2) p=0.009 |
| Fructosamine, mmol/L | 235 (222, 248) | 230 (221, 245) p=0.13 | 239 (229, 246) p=0.4 | 234 (222, 252) p=0.5 |
| OGTT | ||||
| 30-min glucose (mmol/L) | 9.57 (8.08, 10.16) | 9.13 (7.71, 10.3) p=0.8 | 9.05 (7.83, 10.16) p=0.9 | 8.91 (7.80, 9.80) p=0.6 |
| 30-min insulin (pmol/L) | 396 ‡ (243, 743) | 569 ‡ (368, 875) p=0.017 | 479* (333, 778) p=0.3 | 465* (271, 806) p=0.3 |
| 30-minute Δ insulin/Δglucose pmol/mmol | 100 ‡ (50, 238) | 150 ‡ (88, 238) p=0.001 | 138† (50, 200) p=0.2 | 113* (75, 188) p=0.057 |
| 120-min glucose, mmol/L | 6.91 (5.27, 7.96) | 6.83* (5.11, 8.05) p=0.2 | 6.97 (5.61, 8.63) p=0.1 | 6.02† (4.88, 7.49) p=0.3 |
| 120-min insulin, pmol/L | 361† (236, 889) | 396 (295, 608) p=0.2 | 375* (229, 993) p=0.2 | 299‡ (146, 611) p=0.4 |
| Total glucose AUC, mmol/L•min•103 | 0.99 (0.87, 1.07) | 0.97* (0.83, 1.13) p=0.4 | 0.98 (0.83, 1.14) p=0.3 | 0.92† (0.80, 1.03) p=0.4 |
| Total insulin AUC, pmol/L•min•103 | 52.1† (31.3, 110.4) | 70.1* (43.1, 123.6) p=0.025 | 69.5‡ (44.4, 106.3) p=0.11 | 50.7 ¶ (34.0, 87.5) p=0.9 |
| Insulin sensitivity index [Matsuda, 1999 #2068] | 4.0 (1.9, 5.6) | 2.8 (1.8, 4.3) p=0.003 | 2.3* (1.4, 4.9) p=0.003 | 2.8 (2.0, 5.0) p=0.15 |
Results are given as median (interquartile range). p-values are Wilcoxon signed rank test, for comparison with week 4. N=32 for each value, except as noted:
N=31
N=30
N=29
N=28.
Figure 2.
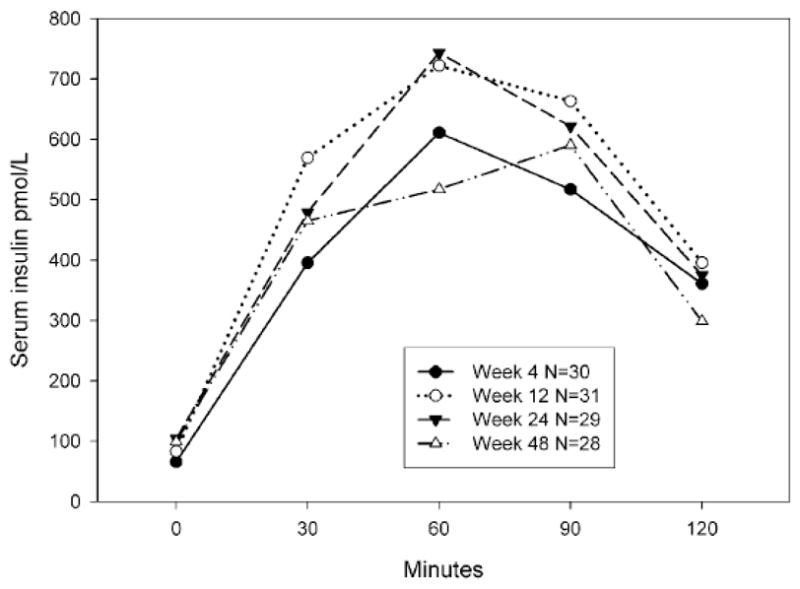
Median serum insulin levels during the 75 gm oral glucose tolerance test. The total insulin area under the curve was increased at week 12 as compared to week 4 (p=0.02) but not at week 24 or 48 (each p > 0.1)
Lipids and lipoproteins
Significant improvement in total cholesterol, HDL cholesterol, non-HDL cholesterol, and triglycerides occurred at all time points, except for the week 12 total cholesterol change (Table 3). Overall there were favorable changes in lipoproteins, including significant increases in large HDL and significant decreases in large VLDL, and lipoprotein(a). The decreases in total and small LDL particles were not statistically significant. LDL particle sizes did not change.
Table 3.
Baseline fasting lipid measures and their absolute changes on study drug at weeks 12, 24, 48.
| Week 4 | Week 12 | Week 24 | Week 48 | |
|---|---|---|---|---|
| Total cholesterol, mmol/L | 6.55 # (5.78, 7.07) | −0.34 # (−1.0, +0.31) p=0.11 | −0.62 (−1.6, +0.16) p<0.001 | −0.21 (−1.45, −0.6) p<0.001 |
| HDL cholesterol, mmol/L | 0.89 (0.80, 1.05) | +0.09 (−0.3, +0.21) p<0.001 | +0.08* (−0.3, +0.21) p=0.01 | +0.13* (−0.5, +0.28) p=0.002 |
| Apolipoprotein A1, g/L | 1.21* (1.11, 1.32) | +0.01* (−0.05, +0.08) p=0.5 | +0.04* (−0.03, +0.14) p=0.04 | +0.08 (+0.02, +0.17) p=0.001 |
| Non-HDL cholesterol, mmol/L | 5.62 (4.87, 6.01) | −0.52 (−1.14, +0.23) p=0.01 | −0.78* (−1.68, −0.05) p<0.001 | −0.49* (−1.37, +0.08) p<0.001 |
| Apolipoprotein B-100, g/L | 1.32 § (1.2, 1.5) | −0.08 ¶ (−0.22, −0.01) p=0.07 | −0.16 ¶ (−0.03, +0.01) p=0.003 | −0.13* (−0.36, −0.01) p=0.002 |
| Triglycerides, mmol/L | 5.40 (3.57, 7.85) | −1.74 (−2.49, +0.11) p=0.004 | −1.99* (−3.25, +0.16) p=0.002 | −1.73* (−3.68, −0.72) p<0.001 |
| Lipoprotein (a), nmol/L | 17.2 (7.8, 53.6) | ND | −2.6 (−15.8,+0) p=0.002 | −2.0 (−10.1,+0.7) p=0.01 |
| NMR | ||||
| Total LDL particles, nmol/L | 1780 (1254, 1964) | ND | −66 (−493, +221) p=0.2 | −23 (−313, +240) p=0.7 |
| Small LDL particles, nmol/L | 1510 (1102, 1833) | ND | −80 (−501, +230) p=0.3 | −17 (−327, +224) p=0.5 |
| LDL particle size, nm | 19.7 (19.5, 20) | ND | −0.1 (−0.5, +0.7) p=0.9 | +0.1 (−0.4, +0.7) p=0.3 |
| Large HDL particles, μmol/L | 0.9 (0.6, 1.8) | ND | +1.3 (−0.1, +3.7) p=0.001 | +0.9 (−0.2, +2.4) p=0.003 |
| Large VLDL particles, nmol/L | 24.6 (12.3, 32.5) | ND | −8.2 (−16.6, +0.3) p=0.02 | −9.9 (−20.3, −2.4) p<0.001 |
Results are given as median (interquartile range). p-values are Wilcoxon signed rank test, for comparison with week 4. ND - not done. N=32 for each value, except as noted:
N=31
N=30
N=28
N=23
N=33.
Three subjects had changes in antiretroviral therapy during study that may have favorably affected lipid results: stavudine to tenofovir and lopinavir/ritonaivr to atazanavir in one subject, indinavir/ritonavir to atazanavir in one subject, and stavudine to tenofovir in one subject. A post hoc analysis that censored subjects’ data at the time of these antiretroviral switches gave very comparable results (data not shown).
The proportion of subjects reaching the individual and composite lipid goals is shown in Table 4. At week 48, 7 of 32 (22%) subjects had achieved the composite lipid goal. The most common reason for failure to meet the composite lipid goal was failure to meet the non-HDL cholesterol goal with only 8 of 32 (25%) subjects achieving a non-HDL cholesterol level of < 4.14 mmol/L.
Table 4.
Proportions of subjects achieving individual and composite lipid goals.
| Week 4 (N=32) | Week 24 (N=32) | Week 48 (N=32) | |
|---|---|---|---|
| Composite lipid goal* | |||
| Not obtained | 31 (97%) | 26 (81%) | 25 (78%) |
| Obtained | 1 (3%) | 6 (19%) | 7 (22%) |
| Non-HDL cholesterol < 1.14 mmol/L | |||
| Not obtained | 31 (97%) | 23 (72%) | 24 (75%) |
| Obtained | 1 (3%) | 9 (28%) | 8 (25%) |
| LDL cholesterol < 3.37 mmol/L | |||
| Not obtained | 29 (91%) | 20 (63%) | 21 (66%) |
| Obtained | 3 (9%) | 12 (38%) | 11 (34%) |
| Triglycerides < 5.65 mmol/L | |||
| Not obtained | 15 (47%) | 7 (22%) | 5 (16%) |
| Obtained | 17 (53%) | 25 (78%) | 27 (84%) |
| Number of components achieved | |||
| 0 | 15 (47%) | 6 (19%) | 5 (16%) |
| 1 | 14 (44%) | 11 (34%) | 14 (44%) |
| 2 | 2 (6%) | 10 (31%) | 7 (22%) |
| 3 | 1 (3%) | 5 (16%) | 6 (19%) |
Defined as achieving all three of the individual lipid goals. If triglycerides were 4.52–5.65 mmol/L, the composite goal was defined as non-HDL-C < 4.14 mmol/L and triglycerides < 5.65 mmol/L.
Tolerability
There were no significant changes over time for hepatic transaminases or uric acid levels (data not shown). There were one grade 3 and two grade 2 transaminase elevations during the course of the study. Four subjects prematurely discontinued extended release niacin: one subject due to a grade 3 transaminase elevation, one due to flushing, one due to diarrhea, and one due to HIV disease progression unrelated to study drug. Three subjects (9%) had grade 2 flushing (bothersome but tolerable) and three had grade 3 flushing (interfering with normal activities).
DISCUSSION
Extended-release niacin in doses up to 2000 mg daily was safe and well-tolerated in these HIV-infected male subjects on stable, effective antiretroviral therapy who had elevated triglycerides and non-HDL cholesterol. Significant favorable changes in total, non-HDL cholesterol, HDL cholesterol, apolipoprotein A1, apolipoprotein B, lipoprotein (a) and particle sizes occurred. Increases in glycemia occurred but tended to be modest or transient. Insulin resistance occurred, with transient changes based on oral glucose tolerance testing, although more persistent effects on fasting insulinemia were noted. No subject developed persistent fasting hyperglycemia.
Published guidelines [8] suggest avoiding niacin in HIV-infected patients due to concern for the potential for inducing increased insulin resistance in patients already prone to insulin resistance and diabetes mellitus [14, 15] related to antiretroviral therapy [30, 31] and lipodystrophy [16]. Immediate-release niacin given at 2 grams per day for 2 weeks caused a > 50% decrease in insulin sensitivity in healthy male subjects, with a compensatory increase in pancreatic B-cell responsiveness [10]. Niacin given at 4.5 grams daily for 8 weeks was associated with significant worsening of diabetic control [11]. However, recent studies suggest that the effect of niacin on glycemic control in diabetic subjects [21, 22] is limited. A placebo-controlled trial of immediate-release niacin up to 3 grams daily in subjects with peripheral vascular disease demonstrated only mild increases in fasting glucose among diabetic and non-diabetic subjects receiving niacin [21]. Glycosylated hemoglobin did not increase significantly, and there were no significant differences in hypoglycemic therapy among diabetic patients in the trial who received active treatment, as compared with placebo. In that study, a transient rise in fasting glucose levels occurred among diabetic patients when niacin dosage was increased to 3000 mg/day, leading the authors to hypothesize that the short-term reductions in insulin sensitivity or worsening glycemic control that have been reported with niacin may only reflect a short-term effect, which may subsequently return to pre-therapy levels. A 14 week study in 14 HIV-infected subjects reported that extended-release niacin up to 2000 mg daily was associated with no insulin resistance by an index of insulin sensitivity derived from a frequently-sampled OGTT, but fasting measures suggested insulin resistance by HOMA-IR, similar to the current study [23].
We found that insulin resistance increased significantly and persistently by HOMA-IR, but measures based on the OGTT only transiently worsened. HOMA-IR is a measure that is calculated from the product of fasting insulin and glucose values [32] and thus is thought to primarily reflect hepatic, rather than peripheral, insulin resistance. We used both the insulin AUC during oral glucose tolerance testing (see Figure 2) as well as an insulin sensitivity index reported by Matsuda and Defronzo [29] that has a greater correlation with insulin-mediated glucose uptake than does HOMA-IR, and is proposed to be a composite of both hepatic and peripheral sensitivity to insulin. Using those tests, there was a significant early increase in insulin resistance, but by week 48 there were no differences from baseline (each p-value ≥ 0.15). These results suggest that niacin may have more persistent effects on insulin sensitivity of the liver than it does on peripheral tissue glucose uptake. This pattern is also supported by the observation that glucose AUC and the 120 minute glucose levels on OGTT were not increased from baseline at any time point. The clinical implications of this apparent discrepancy between hepatic and peripheral tissue insulin sensitivity are not known.
No incident cases of diabetes mellitus occurred by fasting glucose criteria, although a few instances of mild, isolated hyperglycemia did occur and one subject had a repeated 2-hour OGTT glucose value consistent with diabetes mellitus. Those subjects who had an elevated fasting glucose value (≥ 7.0 mmol/L), none had diabetes mellitus confirmed on follow-up testing. It is noteworthy that these subjects included a high prevalence of pre-diabetes (42%) and abdominal obesity (63%) at study entry. These results suggest that extended-release niacin need not be used with greater caution in HIV-infected patients than in other patient groups who have an increased risk of diabetes mellitus or the metabolic syndrome.
Treatment of HIV-associated dyslipidemia is difficult. Use of statins can be limited by drug interactions with protease inhibitors [8]. Use of lovastatin or simvastatin is contraindicated in patients receiving protease inhibitors because of interactions along the CYP450 3A4 metabolic pathway [33]. Although atorvastatin can be used with caution at low doses, pravastatin is the recommended statin, but it has relatively lower potency and many patients on pravastatin have persistent lipoprotein abnormalities [34]. Unfortunately, neither statins [9, 35, 36], fibrates [9, 37, 38], nor their combination [9] have been particularly effective in patients with combined dyslipidemia.
In this study, ERN at doses up to 2000 mg/day was safe, well-tolerated, and effective. The increase in HDL cholesterol and decreases in triglycerides and lipoprotein(a) observed in this study are similar to those seen with niacin in patients without HIV infection and are of a magnitude likely to be associated with decreased cardiovascular risk. These changes reflected increases in large HDL particles, which were at low levels prior to niacin, and may be associated with reduced cardiovascular risk [39, 40]. Additionally, large VLDL particles, which were elevated at entry and which have been associated with increased cardiovascular risk, decreased by more than 50%. In a previous study of subjects with elevated LDL cholesterol, extended-release niacin significantly increased large HDL particles and reduced VLDL and total LDL particles, with a non-significant decrease in small LDL particles [41]. The reduction in small LDL particles was not statistically significant in our study. Our study was not powered to detect a change in total LDL particle numbers given the wide range of these values at baseline and their variable response between individuals. It is not clear why the reductions in enzymatic total and non-HDL cholesterol values peaked at week 24 and were somewhat diminished at week 48. The lipoprotein data suggested that the response to niacin from week 24 to 48 was stable.
Nearly one-quarter of the subjects met the strict composite lipid goal, which is better than seen in similar statin and fibrate studies [9]. Because 66% did not meet the LDL-C and 75% did not meet the non-HDL-C goal, combination of niacin with a statin may be an especially effective intervention and deserves formal study in HIV-infected subjects.
Extended-release niacin was generally well-tolerated when administered before bedtime with 325 mg of aspirin. Most subjects were able to tolerate the full 2000 mg daily dose. Flushing occurred with modest frequency and was dose-limiting in only a single subject. Uric acid did not increase, and consistent with previous reports [42] hepatotoxicity with this preparation was minimal.
We conclude that extended-release niacin is safe and effective in antiretroviral drug-treated HIV-infected subjects with dyslipidemia. Modest effects on glucose metabolism occurred but were predominantly self-limited and would not be expected to have important clinical consequences. Further work with this compound, particularly in combination with statins or fibrates for refractory HIV-related lipid disorders, is needed.
Acknowledgments
Robert Zackin, ScD, was integral to the design of this study and the analysis plan. Dr. Zackin contributed greatly to this field and passed away prior to the completion of this study. Other members of the A5148 team were Richard Hafner, MD, Susan Owens, RN, MS, Stéphannie Charles, MS, Marilyn Kurtzhalts, Ann Johiro, RN, Vincent Parillo, and Melissa Kerkau, BS. These studies were supported by grants to the ACTG from the National Institute of Allergy and Infectious Diseases (AI-38855, AI-38858, AI-25859, and AI-27663). Final study design, analysis, and reporting of results were the sole responsibility of the ACTG. Mark E. McGovern is an employee of Kos Pharmaceuticals and contributed to the study design and to the manuscript. Kos Pharmaceuticals provided study drug and funding for some of the laboratory assays. The authors wish to thank William A. Meyer III and Lawrence A. Hirsch of Quest Diagnostics, James Otvos of Liposcience, Kathy L. Flynn and Gina-Bob Dubé of ACIDFast Racing for word-processing and bibliographic support, and all the subjects who volunteered. The AIDS Clinical Trials Group sites who participated include the following:
References
- 1.Grunfeld C, Kotler DP, Shigenaga JK, et al. Circulating interferon-alpha levels and hypertriglyceridemia in the acquired immunodeficiency syndrome. American Journal of Medicine. 1991;90:154–62. [PubMed] [Google Scholar]
- 2.Grunfeld C, Pang M, Doerrler W, Shigenaga JK, Jensen P, Feingold KR. Lipids, lipoproteins, triglyceride clearance, and cytokines in human immunodeficiency virus infection and the acquired immunodeficiency syndrome. Journal of Clinical Endocrinology and Metabolism. 1992;74:1045–52. doi: 10.1210/jcem.74.5.1373735. [DOI] [PubMed] [Google Scholar]
- 3.Shor Posner G, Basit A, Lu Y, et al. Hypocholesterolemia is associated with immune dysfunction in early human immunodeficiency virus-1 infection. American Journal of Medicine. 1993;94:515–9. doi: 10.1016/0002-9343(93)90087-6. [DOI] [PubMed] [Google Scholar]
- 4.Mauss S, Stechel J, Willers R, Schmutz G, Berger F, Richter WO. Differentiating hyperlipidaemia associated with antiretroviral therapy. AIDS. 2003;17:189–94. doi: 10.1097/00002030-200301240-00008. [DOI] [PubMed] [Google Scholar]
- 5.Stein JH. Dyslipidemia in the era of HIV protease inhibitors. Progress in Cardiovascular Diseases. 2003;45:293–304. doi: 10.1053/pcad.2003.4. [DOI] [PubMed] [Google Scholar]
- 6.Friis-Moller N, Sabin CA, Weber R, et al. Combination antiretroviral therapy and the risk of myocardial infarction. New England Journal of Medicine. 2003;349:1993–2003. doi: 10.1056/NEJMoa030218. [DOI] [PubMed] [Google Scholar]
- 7.El-Sadr W, Reiss P, De Wit S, et al. Relationship between prolonged exposure to combination ART and myocardial infarction: Effect of sex, age, and lipid changes. 12th Conference on Retroviruses and Opportunistic Infections; Boston, MA. 2005. [Google Scholar]
- 8.Dubé MP, Stein JH, Aberg JA, et al. Guidelines for the evaluation and management of dyslipidemia in HIV-infected adults receiving antiretroviral therapy. Recommendations of the HIV Medical Association of the Infectious Disease Society of America and the Adult AIDS Clinical Trials Group. Clin Infect Dis. 2003;37:613–27. doi: 10.1086/378131. [DOI] [PubMed] [Google Scholar]
- 9.Aberg JA, Zackin RA, Brobst SW, et al. A randomized trial of the efficacy and safety of fenofibrate versus pravastatin in HIV-infected subjects with lipid abnormalities: AIDS Clinical Trials Group Study 5087. AIDS Research & Human Retroviruses. 2005;21:757–67. doi: 10.1089/aid.2005.21.757. [DOI] [PubMed] [Google Scholar]
- 10.Kahn SE, Beard JC, Schwartz MW, et al. Increased B-cell secretory capacity as a mechanism for islet cell adaptation to nicotinic acid-induced insulin resistance. Diabetes. 1989;38:562–8. doi: 10.2337/diab.38.5.562. [DOI] [PubMed] [Google Scholar]
- 11.Garg A, Grundy SM. Nicotinic acid as therapy for dyslipidemia in non-insulin-dependent diabetes mellitus. JAMA. 1990;264:723–6. [PubMed] [Google Scholar]
- 12.Dalton TA, Berry RS. Hepatotoxicity associated with sustained-release niacin. Am J Med. 1992;93:102–4. doi: 10.1016/0002-9343(92)90689-9. [DOI] [PubMed] [Google Scholar]
- 13.McKenney JM, Proctor JD, Harris S, Chinchili VM. A comparison of the efficacy and toxic effects of sustained- vs immediate-release niacin in hypercholesterolemic patients. JAMA. 1994;271:672–7. [PubMed] [Google Scholar]
- 14.Justman JE, Benning L, Danoff A, et al. Protease inhibitor use and the incidence of diabetes mellitus in a large cohort of HIV-infected women. J Acquir Immune Defic Syndr. 2003;32:298–302. doi: 10.1097/00126334-200303010-00009. [DOI] [PubMed] [Google Scholar]
- 15.Brown TT, Cole SR, Li X, et al. Antiretroviral therapy and the prevalence and incidence of diabetes mellitus in the multicenter AIDS cohort study. Archives of Internal Medicine. 2005;165:1179–84. doi: 10.1001/archinte.165.10.1179. [DOI] [PubMed] [Google Scholar]
- 16.Hadigan C, Meigs JB, Corcoran C, et al. Metabolic abnormalities and cardiovascular disease risk factors in adults with human immunodeficiency virus infection and lipodystrophy. Clin Infect Dis. 2001;32:130–139. doi: 10.1086/317541. [DOI] [PubMed] [Google Scholar]
- 17.Henry K, Kitch D, Dube M, et al. C-Reactive protein levels over time and cardiovascular risk in HIV-infected individuals suppressed on an indinavir-based regimen: AIDS Clinical Trials Group 5056s. AIDS. 2004;18:2434–7. [PubMed] [Google Scholar]
- 18.Stein JH, Klein MA, Bellehumeur JL, et al. Use of human immunodeficiency virus-1 protease inhibitors is associated with atherogenic lipoprotein changes and endothelial dysfunction. Circulation. 2001;104:257–62. doi: 10.1161/01.cir.104.3.257. [DOI] [PubMed] [Google Scholar]
- 19.Expert Panel on Detection Evaluation and Treatment of High Blood Cholesterol in Adults. Executive Summary of the Third Report of the National Cholesterol Education Program (NCEP) Expert Panel on Detection, Evaluation, and Treatment of High Blood Cholesterol in Adults (Adult Treatment Panel III) JAMA. 2001;285:2486–97. doi: 10.1001/jama.285.19.2486. [DOI] [PubMed] [Google Scholar]
- 20.Carlson LA. Nicotinic acid: the broad-spectrum lipid drug. A 50th anniversary review. Journal of Internal Medicine. 2005;258:94–114. doi: 10.1111/j.1365-2796.2005.01528.x. [DOI] [PubMed] [Google Scholar]
- 21.Elam MB, Hunninghake DB, Davis KB, et al. Effect of niacin on lipid and lipoprotein levels and glycemic control in patients with diabetes and peripheral arterial disease: the ADMIT study: A randomized trial. Arterial Disease Multiple Intervention Trial. JAMA. 2000;284:1263–70. doi: 10.1001/jama.284.10.1263. [DOI] [PubMed] [Google Scholar]
- 22.Grundy SM, Vega GL, McGovern ME, et al. Efficacy, safety, and tolerability of once-daily niacin for the treatment of dyslipidemia associated with type 2 diabetes: results of the assessment of diabetes control and evaluation of the efficacy of niaspan trial. Archives of Internal Medicine. 2002;162:1568–76. doi: 10.1001/archinte.162.14.1568. [DOI] [PubMed] [Google Scholar]
- 23.Gerber MT, Mondy KE, Yarasheski KE, et al. Niacin in HIV-infected individuals with hyperlipidemia receiving potent antiretroviral therapy. Clinical Infectious Diseases. 2004;39:419–25. doi: 10.1086/422144. [DOI] [PubMed] [Google Scholar]
- 24.Otvos JD. Handbook of Lipoprotein Testing. 3. Washington, DC: AACC Press; 2000. Measurement of lipoprotein subclass profiles by nuclear magnetic resonance spectroscopy; pp. 497–508. [PubMed] [Google Scholar]
- 25.Friedewald WT, Levy RI, Fredrickson DS. Estimation of the concentration of low-density lipoprotein cholesterol in plasma, without use of the preparative ultracentrifuge. Clin Chem. 1972;18:499–502. [PubMed] [Google Scholar]
- 26.Armbruster DA. Fructosamine: structure, analysis, and clinical usefulness. Clinical Chemistry. 1987;33:2153–63. [PubMed] [Google Scholar]
- 27.American Diabetes Association. Diagnosis and classification of diabetes mellitus. Diabetes Care. 2004;27:S5–S10. doi: 10.2337/diacare.27.2007.s5. [DOI] [PubMed] [Google Scholar]
- 28.Phillips DI, Clark PM, Hales CN, Osmond C. Understanding oral glucose tolerance: comparison of glucose or insulin measurements during the oral glucose tolerance test with specific measurements of insulin resistance and insulin secretion. Diabetic Medicine. 1994;11:286–92. doi: 10.1111/j.1464-5491.1994.tb00273.x. [DOI] [PubMed] [Google Scholar]
- 29.Matsuda M, DeFronzo RA. Insulin sensitivity indices obtained from oral glucose tolerance testing: comparison with the euglycemic insulin clamp. Diabetes Care. 1999;22:1462–70. doi: 10.2337/diacare.22.9.1462. [DOI] [PubMed] [Google Scholar]
- 30.Dubé MP, Edmondson-Melançon H, Qian D, Aqeel R, Johnson DJ, Buchanan TA. Prospective evaluation of the effect of initiating indinavir-based therapy on insulin sensitivity and B-cell function in HIV-infected patients. J Acquir Immune Defic Syndr. 2001;27:130–4. doi: 10.1097/00126334-200106010-00006. [DOI] [PubMed] [Google Scholar]
- 31.Walli R, Herfort O, Michl GM, et al. Treatment with protease inhibitors associated with peripheral insulin resistance and impaired oral glucose tolerance in HIV-1-infected patients. AIDS. 1998;12:F167–73. doi: 10.1097/00002030-199815000-00001. [DOI] [PubMed] [Google Scholar]
- 32.Matthews DR, Hosker JP, Rudenski AS, Naylor DF, Treacher DF, Turner RC. Homeostasis model assessment: insulin resistance and B-cell function from fasting plasma glucose and insulin concentrations in man. Diabetologia. 1985;28:412–9. doi: 10.1007/BF00280883. [DOI] [PubMed] [Google Scholar]
- 33.Fichtenbaum CJ, Gerber JG, Rosenkranz SL, et al. Pharmacokinetic interactions between protease inhibitors and statins in HIV seronegative volunteers: ACTG Study A5047. AIDS. 2002;16:569–77. doi: 10.1097/00002030-200203080-00008. [DOI] [PubMed] [Google Scholar]
- 34.Stein JH, Merwood MA, Bellehumeur JL, et al. Effects of pravastatin on lipoproteins and endothelial function in patients receiving human immunodeficiency virus protease inhibitors. American Heart Journal. 2004;147:E18. doi: 10.1016/j.ahj.2003.10.018. [DOI] [PubMed] [Google Scholar]
- 35.Moyle GJ, Lloyd M, Reynolds B, Baldwin C, Mandalia S, Gazzard BG. Dietary advice with or without pravastatin for the management of hypercholesterolemia associated with protease inhibitor therapy. AIDS. 2001;15:1503–8. doi: 10.1097/00002030-200108170-00007. [DOI] [PubMed] [Google Scholar]
- 36.Doser N, Kübli S, Telentic A, et al. Efficacy and safety of fluvastatin in hyperlipidemic protease inhibitor-treated HIV-infected patients. AIDS. 2002;16:1982–3. doi: 10.1097/00002030-200209270-00024. [DOI] [PubMed] [Google Scholar]
- 37.Miller J, Brown D, Amin J, et al. A randomized, double-blind study of gemfibrozil for the treatment of protease inhibitor-associated hypertriglyceridaemia. AIDS. 2002;16:2195–200. doi: 10.1097/00002030-200211080-00012. [DOI] [PubMed] [Google Scholar]
- 38.Calza L, Manfredi R, Chiodo F. Use of fibrates in the management of hyperlipidemia in HIV-infected patients receiving HAART. Infection. 2002;30:26–31. doi: 10.1007/s15010-001-2052-3. [DOI] [PubMed] [Google Scholar]
- 39.Kuller L, Arnold A, Tracy R, et al. Nuclear magnetic resonance spectroscopy of lipoproteins and risk of coronary heart disease in the cardiovascular health study. Arteriosclerosis, Thrombosis & Vascular Biology. 2002;22:1175–80. doi: 10.1161/01.atv.0000022015.97341.3a. [DOI] [PubMed] [Google Scholar]
- 40.Asztalos BF, Batista M, Horvath KV, et al. Change in alpha1 HDL concentration predicts progression in coronary artery stenosis. Arteriosclerosis, Thrombosis & Vascular Biology. 2003;23:847–52. doi: 10.1161/01.ATV.0000066133.32063.BB. [DOI] [PubMed] [Google Scholar]
- 41.Morgan JM, Capuzzi DM, Baksh RI, et al. Effects of extended-release niacin on lipoprotein subclass distribution. American Journal of Cardiology. 2003;91:1432–6. doi: 10.1016/s0002-9149(03)00394-1. [DOI] [PubMed] [Google Scholar]
- 42.Goldberg A, Alagona P, Jr, Capuzzi DM, et al. Multiple-dose efficacy and safety of an extended-release form of niacin in the management of hyperlipidemia. Am J Cardiol. 2000;85:1100–5. doi: 10.1016/s0002-9149(00)00703-7. [DOI] [PubMed] [Google Scholar]