

Summary
Ionotropic glutamate receptors (iGluRs) are ligand-gated transmembrane ion channels activated by the binding of the agonist glutamate. All-atom molecular dynamics simulations with explicit solvent are used, in conjunction with an umbrella sampling strategy, to compute the free energy landscapes governing the opening or closing of the AMPA-sensitive GluR2 S1S2 ligand-binding domain in the apo, DNQX-, and glutamate-bound forms. The apo S1S2 is found to easily access low-energy conformations that are more open than observed in X-ray crystal structures. A free energy of 9 to 12 kcal/mol becomes available upon glutamate binding for driving the conformational changes in S1S2 associated with receptor activation. Small-angle X-ray scattering profiles calculated from computed ensemble averages were found to agree better with experimental results than profiles calculated from static X-ray crystal structures. Water molecules in the cleft may contribute to stabilizing the apo S1S2 in an open conformation. Free energy landscapes were also computed for the glutamate-bound T686A and T686S S1S2 mutants, and the results elaborate on findings from experimental functional studies.
Introduction
Ligand-gated ion channels mediate information transfer across cell membranes. Ionotropic glutamate receptors (iGluRs) are ligand-gated ion channels that reside in the membrane of the postsynaptic neuron. iGluRs are abundantly expressed in the brain and spinal cord, and they mediate excitatory responses at the vast majority of central nervous system (CNS) synapses in higher vertebrates (Dingledine et al., 1999). iGluRs are important in the development and function of the CNS and in the formation of synaptic plasticity, which underlies memory and learning (Asztely and Gustafsson, 1996; Cull-Candy et al., 2006; Isaac et al., 2007). Dysfunction in iGluRs are implicated in a range of diseases and injuries, including stroke, epilepsy, schizophrenia, depression, Rasmussen’s encephalitis, amyotrophic lateral sclerosis, Alzheimer’s disease, Huntington’s disease, and Parkinson’s disease (Bräuner-Osborne et al., 2000; Dingledine et al., 1999; Hollmann and Heinemann, 1994; Kristiansen et al., 2007; O’Neill et al., 2004; O’Neill and Witkin, 2007; Rogers et al., 1994).
The extracellular ligand-binding domain of these receptors respond to the binding of the neurotransmitter glutamate (agonist) by undergoing a conformational change that opens cation-permeable channels (activation), thereby transducing chemical signals from the presynaptic neuron into electrical impulses in the postsynaptic cell. After activation, the agonist either dissociates from the ligand-binding domain, and the receptor returns to the resting state (deactivation), or the agonist remains bound, but the channel closes as a result of conformational changes in the receptor that decouple agonist binding from activation (desensitization) (Armstrong et al., 2006). X-ray crystallography has revealed that the portion of iGluRs that binds agonists is composed of two discontinuous polypeptide segments called S1 and S2 (Stern-Bach et al., 1994) that, when linked together, fold into a bilobate, or “clamshell”-like, structure known as the S1S2 ligand-binding core (Armstrong et al., 1998; Kuusinen et al., 1995). iGluR subunits assemble into tetramers in vivo, and S1S2 has been suggested to assemble as a dimer-of-dimers (Armstrong and Gouaux, 2000; Ayalon and Stern-Bach, 2001; Nakagawa et al., 2005; Schorge and Colquhoun, 2003; Tichelaar et al., 2004).
iGluRs have been the subject of intense study, and a wealth of insight has been gained into the structure (Armstrong et al., 2006; Holm et al., 2005; Madden, 2002; Madden et al., 2005; Mayer, 2006; McFeeters and Oswald, 2004; Nakagawa et al., 2005; Ramanoudjame et al., 2006; Speranskiy and Kurnikova, 2005; Tichelar et al., 2004) and dynamics (Ahmed et al., 2007; Arinaminpathy et al., 2006; Cheng et al., 2005; Mamonova et al., 2005; Mendieta et al., 2005; Valentine and Palmer, 2005) of the S1S2 ligand-binding core. For instance, X-ray crystal structures of the apo and ligand-bound complexes have revealed the fundamental conformational change underlying iGluR function. The binding core, open in the absence of a bound ligand, closes in a clamshell-like fashion upon ligand binding. The energetic factors governing such conformational changes, however, have yet to be revealed. Though very informative, X-ray crystal structures of the apo and ligand-bound complexes can only provide a static view of the most stable conformational state of the system. Knowledge of the free energy landscape governing the thermodynamic equilibrium among various accessible conformations is required in order to understand how the receptor functions. For instance, a straightforward question such as—how much useful free energy becomes available for driving the conformational changes associated with receptor activation upon ligand binding?—has not been answered. One reason is that the microscopic factors controlling the conformational energetics of the ligand-binding domain cannot be readily extracted from experiments as they require consideration of conformational states that are inherently transient or not strongly populated. Molecular dynamics (MD) simulations based on detailed atomic models present a rich avenue to start addressing these issues.
Simple “brute force” simulations are, however, somewhat limited in the case of complex macromolecular systems such as iGluRs, which undergo significant conformational changes. These difficulties are further compounded by the fact that a quantitative analysis of energetic factors underlying iGluR function necessitates a comparison of the relative free energy of several conformational states (open/closed with/without bound ligand), some of which are expected to be of marginal stability (e.g., open with bound ligand and closed without bound ligand). A more promising strategy for obtaining quantitatively meaningful results that can be compared with experiment is to consider the “free energy landscape”, or “potential of mean force” (PMF), along specifically chosen coordinates called “order parameters” that report the conformation of a macromolecular system (for example, see Banavali and Roux, 2005; Huang et al., 2003; Ravindranathan et al., 2005). The relative free energy between two or more states is a measure of the probability of finding the system in those states. PMF calculations with enhanced sampling methods along multi-dimensional order parameters are effective means of studying relatively rare, i.e., on the μs-ms timescale (Ahmed et al., 2007; Cheng et al., 2005; Valentine and Palmer, 2005), and complex molecular motions governing biological function. Umbrella sampling computations correspond to simulations in which one or several biasing potentials have been introduced to help accelerate the convergence of configurational sampling (Torrie and Valleau, 1977). The distribution functions from all sampling windows are then unbiased and recombined to obtain the final estimate of the PMF using the weighted histogram analysis method (WHAM) (Kumar et al., 1992; Souaille and Roux, 2001).
In the present study, we used all-atom MD simulations with explicit solvent, in conjunction with an umbrella sampling strategy, to compute the free energy landscapes, described by the PMFs, governing the opening or closing of the α-amino-3-hydroxy-5-methyl-4-isoxazole propionic acid (AMPA)-sensitive GluR2 S1S2 core in the apo, 6,7-dinitro-2,3-quinoxalinedione (DNQX)-bound, and glutamate-bound forms. AMPA is a full agonist of GluR2, and DNQX is an antagonist. The apo S1S2 is found to easily adopt conformations that are more open than observed in X-ray crystal structures (within ~0.5 kcal/mol from the free energy minimum). A free energy of 9 to 12 kcal/mol becomes available upon glutamate binding for driving the conformational changes in S1S2 associated with receptor activation: 9 kcal/mol if the ligand initially docks in the ligand-binding cleft while the latter is in the apo S1S2 crystal structure conformation or 12 kcal/mol if the ligand docks in a more open cleft. Features in the glutamate-bound S1S2 free energy landscape suggest a sequence of interactions in the cleft that correspond to different states of cleft closure. Ensemble average small-angle X-ray scattering (SAXS) profiles calculated from the free energy landscapes agree closely with experimental profiles (Madden et al., 2005). A cluster of water molecules in the cleft may contribute to stabilizing the apo S1S2 in an open conformation. The free energy landscapes governing the opening or closing of glutamate-bound T686A and T686S S1S2 mutants were also computed and were found to agree qualitatively with experimental functional studies (Robert et al., 2005).
Results and Discussion
Free Energy Landscapes
Free energy landscapes computed using umbrella sampling methods depend on the (somewhat arbitrary) choice of order parameter used to describe the conformational change of interest. Nonetheless, this choice becomes critical only when one aims to compute the kinetic rate between stable states (or basins). In this study, we do not characterize kinetic rates of conformational changes. Our primary goal in computing these free energy landscapes is to determine the relative differences in free energy among conformational states (the quantity that governs conformational changes) and the equilibrium populations of these states. The equilibrium populations among well-defined stable states are independent of the choice of order parameter as long as the order parameter accurately distinguishes these states.
To monitor the thermodynamics of the opening and closing of the S1S2 core, we have identified a two-dimensional (2D) order parameter (ξ1, ξ2) (Figure 1). ξ1 describes the distance between the center-of-mass (COM) of residues 479–481 in Lobe 1 and residues 654–655 in Lobe 2. ξ2 describes the distance between the COM of residues 401–403 in Lobe 1 and residues 686–687 in Lobe 2. In comparing the X-ray crystal structures of apo and agonist-bound S1S2, the distance between T480 and S654 (captured in ξ1) and the distance between E402 and T686 (captured in ξ2) both differ by ~3.5 Å. These two pairs of residues are hydrogen-bonded in the agonist-bound structures. Since ξ1 and ξ2 describe distances across two different edges of the ligand-binding cleft, they describe the relative conformations between Lobes 1 and 2 more effectively than, for example, an angle between the two lobes, which would not necessarily capture a tilt of one lobe with respect to the other. S654 and T655 are in the vicinity of a flexible region of Lobe 2 (the peptide bond between D651 and S652 adopts multiple conformations in the crystal structures (Armstrong and Gouaux, 2000)), so local motions might affect the observed ξ1. The effect of local motions, however, is expected to be minimal since the COM of two residues, both of which lie near the beginning of a helix, will be relatively resistant to neighboring fluctuations and should accurately report overall lobe motions. This choice of order parameter is appropriate for distinguishing different degrees of separation between the two lobes and is therefore sufficient for the present study focused on thermodynamic equilibrium factors. The equilibrium free energy landscape that governs conformational transitions in S1S2 for each protein system is presented as a function of this 2D order parameter, W (ξ1, ξ2), and also as a function of a one-dimensional (1D) reduced coordinate, W (ξ12), where ξ12= (ξ1+ξ2)/2. W (ξ1, ξ2) and W (ξ12) for the apo, DNQX-, and glutamate-bound S1S2 are shown in Figure 2.
Figure 1.

Representation of GluR2 S1S2 solvated by a 150 mM NaCl aqueous solution. A 2D order parameter describing the opening or closing of the binding cleft is indicated by the coordinates ξ1 and ξ2. ξ1 describes the distance between the center-of-mass (COM) of residues 479–481 in Lobe 1 and residues 654–655 in Lobe 2 (red spheres). ξ2 describes the distance between the COM of residues 401–403 in Lobe 1 and residues 686–687 in Lobe 2 (green spheres). The crystal structure of the apo S1S2 (PDB 1FTO, chain A) is shown in the left panel, and the crystal structure of the glutamate-bound S1S2 (PDB 1FTJ, chain A) is shown in the right panel. The glutamate ligand in the right panel is shown in stick representation. Na+ and Cl− ions are shown as purple and green spheres, respectively. For clarity, solvent molecules in front of the protein are not shown.
Figure 2.
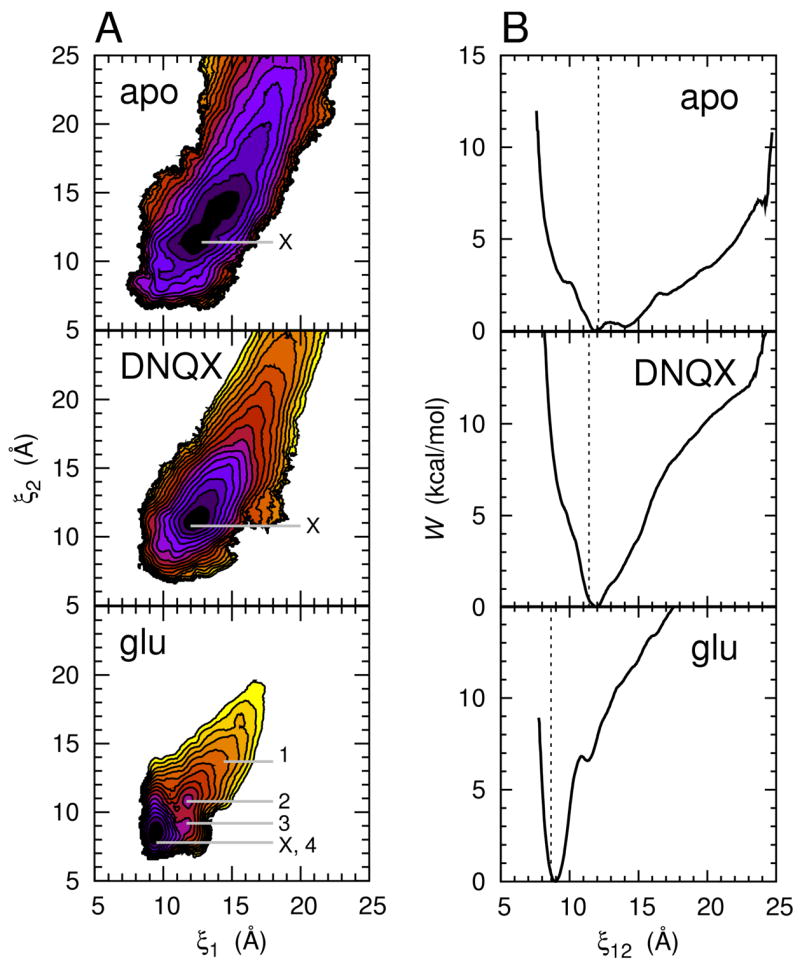
The free energy landscapes for conformational changes in GluR2 S1S2 as described by the order parameter (ξ1, ξ2). 2D (A) and 1D (B) PMF plots are shown for the apo, DNQX-, and glutamate-bound S1S2. In (A), each color contour corresponds to 1 kcal/mol. The positions marked ×indicate X-ray crystal structure conformations (only chain A from each crystal structure is marked; the other chains are positioned very closely to chain A (see text)). The crystal structure conformation of the AMPA-bound S1S2 is at nearly the identical position as the glutamate-bound S1S2. The positions labeled 1–4 in the glu panel correspond to snapshots, shown in Figure 4, of the ligand-binding cleft taken from MD trajectories. In (B), the PMF along the reduced coordinate ξ12= (ξ1+ ξ2)/2 is shown. The dashed lines indicate the X-ray crystal structure conformations.
The free energy landscape governing the conformation of the apo S1S2 features a broad basin that extends to include conformations of the ligand-binding cleft that are more open than observed in available X-ray crystal structures (Figure 2). According to the calculated free energy landscape, these more open conformations are easily accessible with little energetic cost. The crystal structure of the apo S1S2 is positioned at (12.8 Å, 11.4 Å) for chain A and (12.3 Å, 10.7 Å) for chain B, while the computed global free energy minimum is at (12.1 Å, 11.5 Å). The free energy required to go to conformations of the cleft that are more open than seen in crystal structures, however, is only ~0.5 kcal/mol. It is encouraging to note that, even though the starting conformations for the MD umbrella sampling simulations were generated from the glutamate-bound S1S2 crystal structure (chain A), the deepest free energy minimum appears at the position of the apo crystal structure and not at the glutamate-bound structure. Since Prob(ξ12) ∞ exp[−W (ξ12)/kBT], where Prob(ξ12) is the probability of observing a conformation ξ12, from W (ξ12) (Figure 2B-apo) we estimate 91% of the conformational ensemble populates the space in which W (ξ12) ≤ 1.0 kcal/mol, 11.05 Å ≤ ξ12 ≤15.35 Å. This conformational range corresponds to a cleft opening of about 16 to 30° relative to the glutamate-bound S1S2 crystal structure, determined using the program HINGEFIND (Wriggers and Schulten, 1997). The crystal structure of the glutamate-bound S1S2 is positioned at (9.5 Å, 7.8 Å) for chain A, (9.5 Å, 7.7 Å) for chain B, and (9.4 Å, 7.8 Å) for chain C. An energy of 4.0 kcal/mol is required for the apo S1S2 to reach this region of conformational space from the X-ray crystal conformation of the apo S1S2. Water molecules occupy the open, apo cleft and interact favorably with several residues in the cleft, especially the guanidinium group of R485. These water molecules may stabilize the cleft in open conformations. The binding of ligands to R485 would decrease the cleft’s affinity for water, making it easier for the cleft to close.
The DNQX-bound S1S2 free energy landscape is moderately funneled at its global free energy minimum, (12.7 Å, 11.3 Å) (Figure 2). The crystal structure of the DNQX-bound S1S2 is positioned at (12.0 Å, 10.8 Å) for chain A and (12.3 Å, 10.5 Å) for chain B. The starting conformations for umbrella sampling were generated from the crystal structure of the DNQX-bound S1S2 (chain A). DNQX mediates interactions between Lobes 1 and 2 by interacting with Y450 and R485 in Lobe 1 and T686, E705, and M708 in Lobe 2. These interactions contribute to restricting the range of highly populated conformations to a small region around the free energy minimum. About 86% of the conformational ensemble populates the space in which W (ξ12) ≤ 1.0 kcal/mol, 11.20 Å ≤ ξ12 ≤12.70 Å. 9.2 kcal/mol would be required for the DNQX-bound S1S2 to go from its crystal structure conformation to the closed conformation corresponding to the crystal structure of the glutamate-bound S1S2. This barrier to closing is due to steric clash between DNQX and residues in Lobe 2, in particular E705. DNQX therefore inhibits S1S2 closure, and transmembrane channel opening, via a “foot-in-the-door” mechanism as suggested from structural studies (Armstrong and Gouaux, 2000; Mayer, 2006).
The glutamate-bound S1S2 free energy landscape features a narrow and deep basin at (9.4 Å, 8.4 Å), where the computed global free energy minimum is located (Figure 2). The crystal structure of the glutamate-bound S1S2 is positioned at (9.5 Å, 7.8 Å) for chain A, (9.5 Å, 7.7 Å) for chain B, and (9.4 Å, 7.8 Å) for chain C. The crystal structure of the AMPA-bound S1S2 is similarly positioned at (9.3 Å, 7.8 Å) for chain A, (9.3 Å, 7.8 Å) for chain B, and (9.3 Å, 7.9 Å) for chain C. The starting conformations for umbrella sampling were generated from the glutamate-bound S1S2 crystal structure (chain A). About 94% of the conformational ensemble populates the space in which W (ξ12) ≤ 1.0 kcal/mol, 8.50 Å ≤ ξ12 ≤ 9.45 Å. The numerous hydrogen bonds formed between the glutamate ligand and each of the two lobes as well as hydrogen bonds formed directly between the two lobes contribute to the restricted range of highly populated conformations. State 1, at (14.4 Å, 13.7 Å), corresponds to a low-energy conformation for the apo S1S2 that is more open than observed in crystal structures. A metastable substate is observed at (11.7 Å, 10.8 Å) (Figure 2A-glu, state 2), which is near the location of the global free energy minima in both the apo and DNQX-bound S1S2 free energy landscapes. The lowest free energy pathway from state 2 to the fully closed state at (9.4 Å, 8.4 Å), state 4, traverses an intermediate state, state 3. The position of 3 with respect to 2 and 4 suggests that complete cleft closure occurs by Lobes 1 and 2 coming together first primarily along ξ2, in going from 2 to 3, followed by ξ1, in going from 3 to 4. Conversely, when the glutamate-bound S1S2 is in 4, cleft opening occurs reversibly by the lobes separating first primarily along ξ1 followed by ξ2. A remarkable amount of free energy becomes available for driving cleft closure upon binding a glutamate ligand: the free energy of going from the crystal structure conformation of the apo S1S2 (approximately 2) to 4 is −8.8 kcal/mol, and the free energy of going from 1 to 4 is −11.7 kcal/mol.
The measured equilibrium dissociation constant (Kd) for glutamte binding to S1S2 is 0.48 μM (Abele et al., 2000), which corresponds to about −8.7 kcal/mol. Our glutamate-bound S1S2 computations consider, however, only the conformational free energy of the system in which glutamate is already bound to S1S2; they do not consider the process of taking the ligand from bulk solvent and docking it into the cleft. This docking step must be taken into account before computed results can be compared with the measured Kd (Woo and Roux, 2005)
The crystal structures of glutamate- and AMPA-bound S1S2 show that the peptide bond between D651 and S652 can adopt conformations that allow two additional hydrogen bonds to form between Lobes 1 and 2 that are not seen in our simulations (Armstrong and Gouaux, 2000). This alternate conformation is seen in chain C but not chain A of the glutamate-bound S1S2 crystal structure. The formation of these additional hydrogen bonds is expected to increase the stability of the closed cleft relative to our computed values. Computations that explicitly consider the “flipping” of the peptide bond between D651 and S652 would have to be carried out in order to evaluate how much additional stability is obtained.
Over the course of all simulations, the average root-mean-square deviation (RMSD) measured separately in Lobe 1 (calculated at α-carbon atoms of residues 394–495 and residues 732–771) and Lobe 2 (calculated at α-carbon atoms of residues 500–728) with respect to the corresponding crystal structure (chain A) was ~1 Å, consistent with the magnitude of thermal fluctuation. This observation also indicates that distributions in ξ1 and ξ2 reflect fluctuations in the relative orientation of the two lobes rather than intra-lobe distortions. The broad free energy basin of the apo S1S2 and the narrow basin of the glutamate-bound S1S2 are consistent with previous MD simulations of Arinaminpathy et al. (2006), which showed more conformational fluctuation in the apo protein, in both open and closed states, compared with the glutamate-bound protein.
Comparison with Experiments Probing S1S2 in Solution
The present simulations sample and explore conformations that are not limited to the neighborhood of available X-ray crystal structures. In particular, low-energy conformations—~10° more open than seen in crystal structures of the apo GluR2— are accessible according to the computations. Thus, it is important to validate, as much as possible, the S1S2 free energy landscapes and conformations resulting from the simulations using all available experimental information.
i) Small-Angle X-ray Scattering Analysis
Small angle X-ray scattering (SAXS) provides partial, but important, clues about S1S2 conformations in solution that are helpful to ascertain the accuracy of the simulations. To validate the S1S2 free energy landscapes and conformations resulting from the simulations, SAXS curves were calculated from the simulations and compared with experimental results. Figure 3A shows the radii of gyration, Rg, and forward scattering, I0, for the apo, DNQX-, and AMPA-bound S1S2 as determined by fitting the SAXS data of Madden et al. (2005) to the Guinier law in the range 2πsRg < 1.3, where s is the magnitude of the scattering vector in reciprocal space (see Experimental Procedures).
Figure 3.

Small-angle X-ray scattering. (A) Rg for the apo, DNQX-, and AMPA-bound S1S2 were obtained by fitting experimental SAXS profiles (Madden et al., 2005) to the Guinier law in the range 2πsRg < 1.3. (B) Rg obtained by fitting calculated scattering profiles to the Guinier law in the same range. Rg values are shown in (C) and (D). Ensemble average scattering profiles from simulations (black) are compared with scattering profiles calculated from X-ray crystal structures (PDB 1FTO (apo, red), 1FTL (DNQX, red), 1FTM (AMPA, red), 1FTJ (glu, green)). Calculated scattering are shown as circles and Guinier fits are shown as lines. The calculated curves were scaled such that I0 matched those obtained for the experimental curves. The AMPA and glu crystal results are nearly indistinguishable. (C) Comparison of ensemble average scattering profiles from simulations (black lines) with experimental profiles (red circles). Error bars in the experimental data indicate standard deviation. Rg for the calculated scattering profiles and χ2 (evaluated using all experimental data) are shown. The dashed line in the apo panel is the scattering profile that results when binding cleft waters are omitted from the scattering calculations. In the bottom panel, the calculated scattering profile for the glutamate-bound S1S2 is compared with experimental data for AMPA-bound S1S2. (D) Comparison of scattering profiles calculated from X-ray crystal structures with experimental profiles (red circles). Crystallographically unresolved protein termini and sidechains were built into the models since they contribute to X-ray scattering. Rg for the calculated scattering profiles and χ2 (evaluated using all experimental data) are shown. As in (C), the dashed line in the apo panel is the scattering profile that results when binding cleft waters are omitted from the scattering calculations. In the bottom panel, experimental data for the AMPA-bound S1S2 is compared with calculated scattering profiles for both AMPA-bound (solid line) and glutamate-bound (dashed line) S1S2.
Ensemble average scattering profiles were calculated for each protein system using snapshots taken from simulation trajectories. Experimental SAXS data for glutamate-bound S1S2 were not available, so calculated scattering profiles for the glutamate-bound S1S2 were compared with SAXS data for AMPA-bound S1S2, which seems to be a reasonable comparison. For each system, two snapshots were selected every 0.1 Å along ξ12 in the following ranges: 8.2 Å ≤ ξ12 ≤ 24.0 Å for the apo S1S2, 8.6 Å ≤ ξ12 ≤ 24.2 Å for the DNQX-bound S1S2, and 8.1 Å ≤ ξ12 ≤24.3 Å for the glutamate-bound S1S2. The two snapshots were selected from different time frames, one from 800 ps < t ≤ 900 ps and the other from 900 ps < t ≤ 1000 ps of the respective umbrella window trajectories. Since multiple snapshots can map to a single value of ξ12, snapshots were taken from the minimum W (ξ1, ξ2) corresponding to each ξ12. A scattering curve Isol(s) was calculated for each snapshot using the program CRYSOL (Svergun et al., 1995) (see Experimental Procedures), and ensemble average scattering profiles 〈Isol (s)〉 were calculated using Equation 7. Figure 3C shows a comparison between the calculated 〈Isol (s)〉 and experimental scattering profiles, including the calculated Rg (determined using the Guinier approximation) and the χ2 value, which is a measure of the quality of agreement. The calculated and experimental profiles agree very well. All water molecules and Na+ and Cl− ions were removed from the DNQX- and glutamate-bound protein system snapshots before Isol(s) was calculated. For the apo protein system snapshots, however, a cluster of water molecules within the ligand-binding cleft near the charged guanidinium group of R485 (approximately 25 waters for conformations where ξ12 = 12 Å) was included in the calculation of Isol(s). All other water molecules and all Na+ and Cl− ions were removed. This water cluster may contribute to stabilizing the apo S1S2 in an open cleft conformation. Inclusion of the water cluster in the apo S1S2 markedly improved agreement between the calculated and experimental scattering profiles (Figure 3C-apo). Inclusion of additional water molecules outside the ligand-binding cleft did not improve agreement. The continuum model of the hydration shell used in CRYSOL may not adequately account for tightly-bound water molecules within the binding cleft of the apo S1S2, thus necessitating the explicit inclusion of these waters. The DNQX and glutamate ligands both bind to the guanidinium group of R485, interfering with its interaction with solvent, so water molecules were not explicitly included in these snapshots.
Scattering profiles were also calculated from X-ray crystal structures of the apo, DNQX-, glutamate-, and AMPA-bound S1S2 (all chain A) and compared with experiment (Figure 3D). Crystallographically unresolved protein termini and sidechains were built into the models since they contribute to X-ray scattering (see Experimental Procedures). As with the simulated snapshots, inclusion of a water cluster (25 molecules) in the ligand-binding cleft of the apo S1S2 markedly improved agreement between the calculated and experimental profiles.
For the apo and DNQX-bound S1S2, the calculated ensemble average profiles from the simulations agree significantly better with the experimental profiles than the calculated profiles from the crystal structures. The differences in agreement are seen primarily in Rg for the apo S1S2 and in both Rg and χ2 for the DNQX-bound S1S2 (Figure 3). In the original analysis of the SAXS data where only crystal structures were used for the atomic models, it was suggested that the apo S1S2 primarily samples conformations intermediate to the DNQX- and AMPA-bound S1S2 structures (Madden et al., 2005). Our analysis, on the other hand, suggests that the apo S1S2 is not limited to this range of conformations but rather extensively populates more open conformations. For the glutamate-/AMPA-bound S1S2, the calculated ensemble average profile from the simulations and the calculated profiles from the crystal structures agree similarly with the experimental profile (the calculated ensemble average profile agrees slightly better, as seen in the χ2 value). The similarity in these calculated profiles is not surprising given that the narrow and deep global free energy minimum for the glutamate-bound S1S2 is positioned closely to the crystal structure conformations of both the glutamate- and AMPA-bound S1S2. Fits to the Guinier law in the determination of Rg for the calculated profiles are shown in Figure 3B. The experimental scattering profiles reflect ensembles of conformational states, and the relative populations of these conformational states appear to be captured in the computed free energy landscapes.
ii) Fluorescence Resonance Energy Transfer
Recent fluorescence resonance energy transfer (FRET) experiments, aimed at characterizing the largest molecular motions in S1S2, have measured the distance between fluorophores attached to residue 394 in Lobe 1 and residue 652 in Lobe 2 in the apo and various ligand-bound forms (Ramanoudjame et al., 2006). It was concluded that, in solution, S1S2 exhibits a smaller degree of cleft closure in going from the apo to agonist-bound forms than indicated by the crystal structures. Such a small movement upon cleft closure might be taken as an indication that the apo state in solution is opened to a lesser extent than observed in the crystal structure. This does not, however, seem plausible. Analysis of steric clashes suggests that, unless the apo cleft opens to at least the extent observed in the crystal structure of the apo S1S2, a ligand will have a very difficult time maneuvering into the partially open cleft to reach the binding site. In fact, the present computations suggest rather the opposite, that the apo state could sometimes be even more open than observed in the crystal structure, a finding that is consistent with SAXS data (see above). Alternatively, the small movement detected by FRET could be interpreted as an indication that AMPA- and glutamate-bound S1S2 are more open than indicated by the crystal structures. The free energy landscape of glutamate-bound S1S2 calculated in solution, however, indicates that the complex resides at the bottom of a deep well, consistent with the crystal structure, suggesting that large excursions to more opened states are unlikely. A third possibility is that the small movement detected by FRET might be inherent to the method. Because the rate of energy transfer varies as the inverse sixth-power of the donor-acceptor distance according to Förster’s theory, short distances tend to be weighted more heavily in FRET-based distance measurements (Stryer and Haugland, 1967), hence yielding an appearance of small distances for both the apo and agonist-bound states of S1S2. To draw definitive conclusions, simulations of S1S2 including explicitly the attached fluorophores would have to be performed in order to reasonably compare computed ensemble average distances with the experimental measurements.
State-Dependent Interactions within the Ligand-Binding Cleft
Specific protein-ligand and intra-protein interactions within the S1S2 ligand-binding cleft give rise to features in the free energy landscape of S1S2 with a bound glutamate (Figures 2 and 4). State 1 in Figure 2A-glu corresponds to a glutamate-bound open form of S1S2. In the absence of ligand, this is an energetically easily accessible conformation of the apo S1S2 that is more open than observed in X-ray crystal structures (Figure 2A-apo). With a bound ligand, such an open form of S1S2 has the character of an unstable “virtual” state, which should ultimately relax to the closed form. In such an open state, the glutamate ligand interacts only with Lobe 1. This occurs spontaneously during the umbrella sampling MD simulations. This state might correspond to the “dock” step of the “dock-lock” mechanism of glutamate receptor ligand binding suggested previously on the basis of functional and kinetics studies (Abele et al., 2000; Cheng et al., 2005) where the ligand is bound exclusively to Lobe 1 prior to complete cleft closure. In state 1 the binding cleft is open wide enough such that the glutamate ligand can easily access its crystallographically observed binding partners in Lobe 1 (P478, T480, and R485) without necessarily interacting with residues in Lobe 2. Comparison with the apo simulations indicates that binding of the ligand to R485 displaces water molecules clustered around the guanidinium group of that residue. Thus, if occupation by water molecules stabilizes the cleft in open conformations in the absence of ligand, then the displacement of these water molecules would be the first step driving cleft closure.
Figure 4.
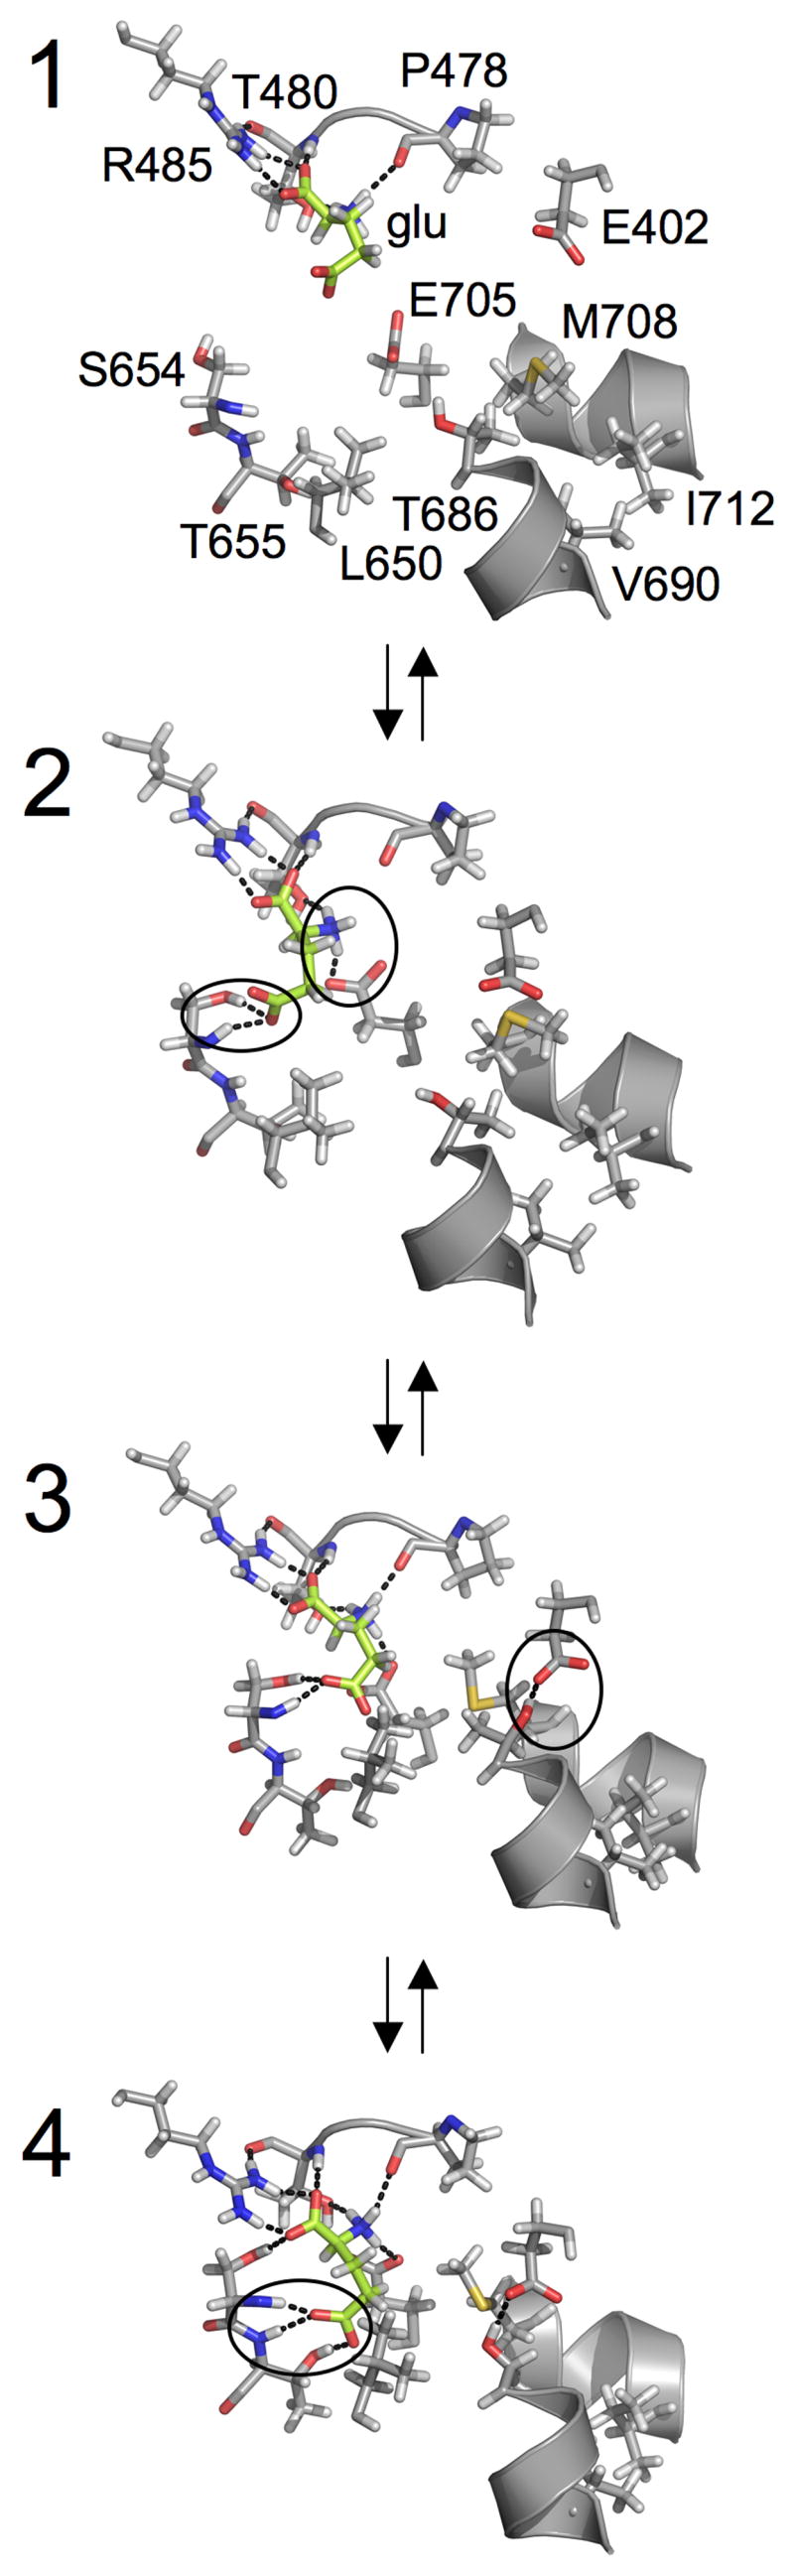
Ligand-binding cleft interactions corresponding to different states of S1S2 opening or closing in the presence of a glutamate ligand. The snapshots, taken from MD trajectories, correspond to the conformational states labeled 1–4 in Figure 2A-glu. Carbon atoms of the glutamate ligand are colored green. Dotted lines indicate hydrogen bonding interactions. Water molecules are not shown in order to focus on direct protein-ligand and protein-protein interactions. Key interactions associated with each conformational state are circled. The hydrogen bonding of the ligand α-amino group with the S654 backbone/sidechain and the ligand γ-carboxylate group with the E705 sidechain characterize the transition from 1 to 2. The hydrogen bonding of the E402 sidechain with the T686 sidechain characterize the transition from 2 to 3. A shift of the ligand γ-carboxylate group’s hydrogen bonding partners from the S654 backbone/sidechain to both the S654 backbone and the T655 backbone/sidechain characterize the transition from 3 to 4.
Further cleft closure is driven by the formation of additional hydrogen bonds between the ligand and Lobe 2 while the former remains strongly bound to Lobe 1. For instance, the transition from state 1 to state 2, which is near the crystal structure conformation of the apo S1S2, is characterized by the formation of hydrogen bonds between the glutamate ligand α-amino group with the S654 backbone/sidechain and the ligand γ-carboxylate group with the E705 sidechain. In the apo S1S2 crystal structure, the sidechains of E705 and K730 interact. The disruption of this interaction to form the hydrogen bond between the glutamate ligand and E705 is consistent with the suggestion of a conformational switch involving E705 and K730 (Armstrong and Gouaux, 2000; Armstrong et al., 2003; Mayer et al., 2006). In going from 1 to 2, the ligand-bound complex is further stabilized by 5.1 kcal/mol.
The transition from 2 to 3, which yields an additional stabilization free energy of 0.2 kcal/mol, is characterized by the formation of a hydrogen bond between the sidechains of E402 and T686. The association of these two residues is captured in ξ2. Protein-ligand interactions remain similar to those in 2. A 0.6 kcal/mol barrier separates 2 and 3. Analysis indicates that this small free energy barrier corresponds to the cost of aligning E402 and T686 such that steric hindrance is avoided and hydrogen bond formation is allowed. This interaction is further examined in the next section.
Finally, 6.4 kcal/mol is gained in the transition from 3 to 4, which results in a fully closed S1S2. This final transition is characterized by a shift in the glutamate ligand γ-carboxylate group’s hydrogen bonding partners from the S654 backbone/sidechain to both the S654 backbone and the T655 backbone/sidechain. This shift in hydrogen bonding is captured in ξ1. In this fully closed, or “locked”, conformation, the ligand-binding pocket is fully encapsulated by the protein (i.e., the ligand cannot be seen from outside the protein in a molecular surface representation of the complex). S1S2 opening and the release of a bound glutamate ligand from 4 would be accomplished via the hydrogen bonding events occurring in reverse order. It has been suggested, however, that concerted movement of a helix in Lobe 2 may allow ligand dissociation without S1S2 opening (McFeeters and Oswald, 2002). Overall, a total stabilization of 9 to 12 kcal/mol is gained during the transformation from the open to the closed state in the presence of a bound ligand: 8.8 kcal/mol from the crystal structure conformation of the apo S1S2 (approximately 2) to 4 or 11.7 kcal/mol from 1 to 4. This is the free energy that is available upon ligand binding to move the segments in Lobe 2 connected to the gate of the GluR2 transmembrane domain, leading to channel opening.
T686A and T686S Mutants
In order to further probe details of conformational transitions in S1S2, we computed free energy landscapes for two mutants of the glutamate-bound S1S2, T686A and T686S. In comparing the free energy landscapes of the mutants in Figure 5 with the free energy landscape of the wild-type (WT) glutamate-bound S1S2 in Figure 2A-glu, the free energy barrier separating state 2 from the edge of the basin in the WT free energy landscape (i.e., state 3 in Figure 2A-glu) is seen to largely vanish in the mutant free energy landscapes. During S1S2 closure, steric hindrance is reduced between residues 402 and 686 in both T686A and T686S compared with WT. During S1S2 opening, no hydrogen bonds are broken between these two residues in T686A. A hydrogen bond is broken, however, in the T686S protein, but S686 appears more mobile about the χ1 bond than T686 (T686 is restricted to conformations where the sidechain methyl group can occupy the hydrophobic groove formed by L650, V690, L704, M708, and I712) and may offer a less stable hydrogen bond than T686. The free energy required to go from the fully closed state to state 2 is 7.7 kcal/mol for T686A and 8.3 kcal/mol for T686S.
Figure 5.
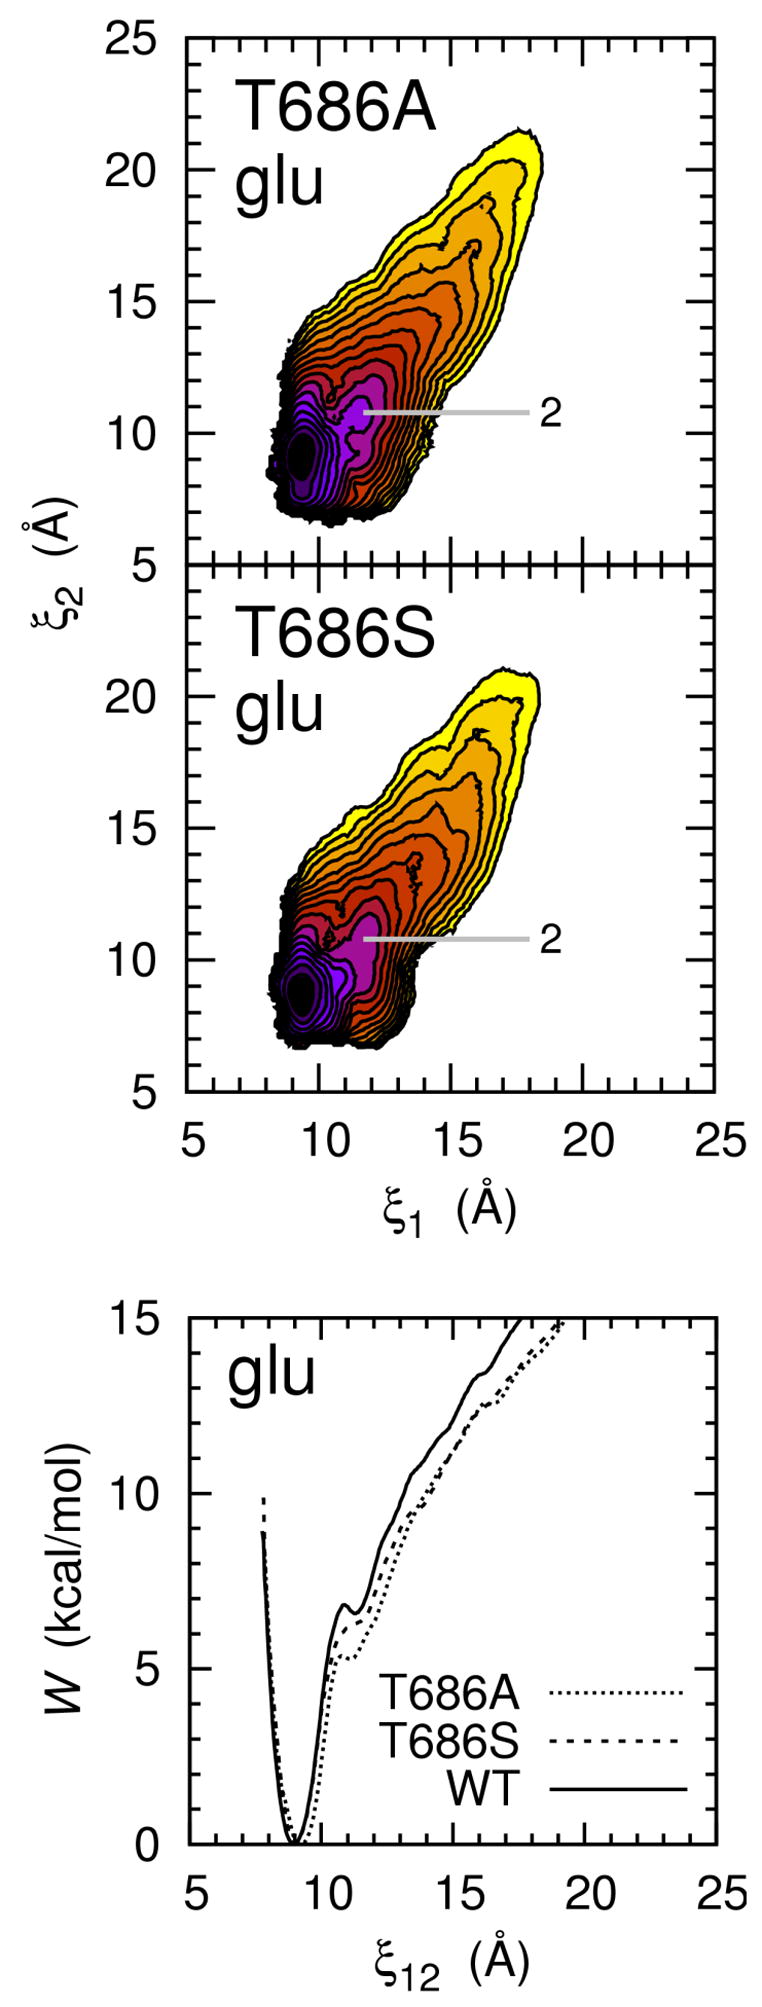
The free energy landscapes for conformational changes in the T686A and T686S glutamate-bound S1S2. In the 2D PMF maps (top two panels), each color contour corresponds to 1 kcal/mol. Conformational state 2 from Figure 2A-glu is labeled. In the 1D PMF plot (bottom panel), the PMF along the reduced coordinate ξ12 is shown. The WT plot is the same shown in Figure 2B-glu.
In the 1D PMF plots for the T686A, T686S, and WT S1S2 (Figure 5, bottom panel), the free energies associated with conformations where ξ12 > 9.0 Å follow the order T686A < T686S < WT. Transitions between state 2 and more fully closed states would occur more easily in the mutant proteins than in the WT protein. Though a comparison is difficult, these results are consistent with those of Robert et al. (2005), who observed a reduction in apparent affinity and efficacy of glutamate in T686A and T686S mutants of GluR2 and suggest that the T686 mutations destabilize binding cleft closure, which increases the rate of agonist dissociation. These mutations were also observed to speed recovery from desensitization.
Conclusion
All-atom MD simulations with explicit solvent, in conjunction with an umbrella sampling strategy, were used to compute free energy landscapes that govern conformational changes in GluR2 S1S2 driving receptor activation. We find that the apo S1S2 can easily adopt conformations where the binding cleft is more open than has been observed in X-ray crystal structures. Further analysis indicates that the conformations sampled by the simulations are compatible with experimental SAXS data. It is possible that crystal lattice contacts may contribute to stabilizing the apo S1S2 in the crystallographically observed conformation, while the apo S1S2 explores more open conformations in solution. In addition, the analysis of SAXS data suggests a dense cluster of water molecules may form in the apo cleft near the guanidinium group of R485. This cluster of water may stabilize the cleft in an open conformation. Ligand-binding to R485 would disrupt the formation of this cluster, facilitating cleft closure. The free energy landscapes for the WT and mutant S1S2 reveal key interactions in the ligand-binding cleft associated with different states of cleft closure and support the importance of the E402-T686 interaction (Robert et al., 2005) in stabilizing a closed cleft. A free energy of 9 to 12 kcal/mol becomes available upon glutamate binding for driving the conformational changes in S1S2 associated with opening the GluR2 transmembrane ion channel: 9 kcal/mol if the ligand docks in the cleft while the latter is in the apo S1S2 crystal structure conformation or 12 kcal/mol if the ligand docks in a more open cleft.
Experimental Procedures
Atomic Models
The atomic models for the apo, DNQX-bound, glutamate-bound, and AMPA-bound GluR2 S1S2 monomers were constructed from the following X-ray crystal structures (PDB ID): 1FTO (apo), 1FTL (DNQX), 1FTJ (glu), and 1FTM (AMPA) (Armstrong and Gouaux, 2000). Each of these PDB entries contains multiple copies of S1S2 within the asymmetric unit. Our models were all constructed from chain A (the other chains share similar conformations). The choice of chain A was arbitrary; given the small conformational differences among chains in each crystal structure and the presence of thermal fluctuations in the MD simulations, the present results are not expected to be sensitive to small differences in the starting conditions. The model of the AMPA-bound S1S2 was used only in calculating SAXS profiles. The terminal amino acids and several sidechains are unresolved in the crystal structures, so they were built into the models. Missing sidechains were built using the program SCWRL (Canutescu et al., 2003), which searches for optimal rotamers using a backbone-dependent library of sidechains. T686A and T686S mutations of the glutamate-bound S1S2 model were also generated using SCWRL. Crystallographic waters observed in the ligand-binding cleft were included in our models.
DNQX was parameterized for the CHARMM PARAM27 all-atom potential energy function for proteins (MacKerell et al., 1998). In brief, this procedure involved (1) charge-fitting a geometry-optimized molecule to quantum mechanical (QM) electrostatic potential maps (using the Gaussian 03 program (Frisch et al., 2004) for quantum chemical calculations and the FITCHARGE module of CHARMM (Anisimov et al., 2005; Bayly et al., 1993) for charge-fitting), (2) optimizing force constants via the reproduction of vibrational frequencies and potential energy distributions from QM calculations (using Gaussian 03, the MOLVIB module of CHARMM, and a novel genetic algorithm to search for force constants), and (3) optimizing dihedral parameters associated with rotatable bonds via the reproduction of dihedral potential energy surfaces from QM calculations.
PMF from Umbrella Sampling Simulations
The PMF corresponds to the average reversible thermodynamic work function W (ξ) done by the mean force 〈F(ξ)〉 along the chosen order parameter ξ, i.e.,
| (1) |
where 〈ρ(ξ)〉 is the average distribution function, ξ* and W (ξ*) are arbitrary constants, kB is Boltzmann’s constant, and T is temperature (Roux and Schulten, 2004).
A 2D order parameter (ξ1, ξ2) is used to describe the opening or closing of the S1S2 (Figure 1). ξ1 describes the distance between the center-of-mass (COM) of residues 479–481 in Lobe 1 and residues 654–655 in Lobe 2. ξ2 describes the distance between the COM of residues 401–403 in Lobe 1 and residues 686–687 in Lobe 2.
Starting coordinates for the umbrella sampling windows were obtained using a targeted (biased-potential) MD procedure to generate conformations positioned in 1.0 Å increments along ξ1 from 8.0 to 22.0 Å and 1.0 Å increments along ξ2 from 6.0 to 26.0 Å. Starting coordinates for each window of both the apo and glutamate-bound S1S2 simulations were generated from the crystal structure of the glutamate-bound S1S2 (the glutamate ligand was removed to yield apo S1S2 coordinates). Starting coordinates for each window of the DNQX-bound protein simulations were generated from the crystal structure of the DNQX-bound S1S2. During the generation of starting conformations, (1) RMSD restraints were applied separately to each lobe of S1S2 (Lobe 1: residues 394–495 and residues 732–771, Lobe 2: residues 500–728) with respect to the crystal structure such that the RMSD for each lobe < 1 Å, and (2) the DNQX and glutamate ligands were restrained to remain bound to R485 as observed in the crystal structures to be consistent with the “dock-lock” mechanism of GluR ligand binding (Abele et al., 2000; Cheng et al., 2005), where the ligand is suggested to bind to Lobe 1 prior to complete cleft closure.
All simulations were performed using the program CHARMM (Brooks et al., 1983). The all-atom potential energy function PARAM27 for proteins (MacKerell et al., 1998) and the TIP3P potential function for water (Jorgensen et al., 1983) were used. The total number of atoms in each simulation system is ~47,000. To electrically neutralize each system, 37 Na+ and either 42 Cl− (for the apo and DNQX-bound protein systems) or 41 Cl− (for the glutamate-bound protein system) ions were added in the bulk solution to yield 150 mM NaCl. Periodic boundary conditions were used with an orthorhombic cell of approximate dimensions 97 Å × 77 Å × 65 Å. Electrostatic interactions were computed using the particle mesh Ewald (PME) algorithm (Essmann et al., 1995), and short-range non-bonded interactions were truncated at 10 Å. The SHAKE algorithm (Ryckaert et al., 1977) was used to constrain bond lengths involving hydrogen atoms. A timestep of 2 fs was used. The initial protein configuration of each system was first relaxed with Langevin dynamics in the presence of harmonic restraints at constant volume for 200 ps to avoid spurious disruption of the protein structure. The cell dimensions were subsequently allowed to vary in accord with a constant pressure (1 atm) and temperature (300 K) thermodynamic ensemble (Feller et al., 1995).
For the umbrella sampling PMF calculations, 200 independent simulations with biasing harmonic potential functions of 2.0 kcal/mol/Å2 centered on the (ξ1, ξ2) positions of the starting coordinates described above were generated. The COM biasing potentials were implemented using the MMFP module of CHARMM (Brooks et al., 1983). The entire simulation time included in the PMF calculations is 200 ns (1 ns of trajectory generation per window) for each of the apo, DNQX-, and glutamate-bound WT S1S2 systems. The entire simulation time is 180 ns (0.9 ns per window) for the glutamate-bound T686A and T686S systems. The distribution functions in (ξ1, ξ2) from all windows were unbiased and recombined using the weighted histogram analysis method (WHAM) (Kumar et al., 1992; Souaille and Roux, 2001) to calculate the PMF W (ξ1, ξ2). W (ξ1, ξ2) was also projected onto the reduced coordinate ξ12= (ξ1+ ξ2)/2 to give a 1D PMF W (ξ12).
Cleft opening or closing described in terms of rotation about an effective hinge connecting Lobes 1 and 2 was calculated using the script HINGEFIND (Wriggers and Schulten, 1997) implemented in the program VMD (Humphrey et al., 1996).
Small-Angle X-ray Scattering Analysis
The scattering intensity profile for a molecule in vacuum is given by the Debye equation (Debye, 1915):
| (2) |
where F(s) is the molecular structure factor in vacuum,
| (3) |
In Equations 2 and 3, s is the scattering vector in reciprocal space (|s|= s= (2/λ)sinθ, where λ is the X-ray wavelength and θ is half the scattering angle), fj (s) is the vacuum atomic scattering factor of the jth atom, N is the number of atoms in the molecule, r j are the coordinates of the jth atom, rjk is the distance between atoms j and k, and 〈 〉Ω denotes a spherical average in reciprocal space. The scattering profile can also be written
| (4) |
Where is the weighted interatomic distance distribution function.
In evaluating the scattering profile for a molecule in solution, the solvent scattering must be taken into account. In this case,
| (5) |
where G(s) is the solvent scattering amplitude, and F(s) − G(s) is the total excess scattering amplitude. The solvent scattering amplitude may be expressed (Svergun et al., 1995)
| (6) |
where ρ0 is the average bulk solvent scattering density, A(s) is the scattering amplitude from the excluded volume (i.e., the volume occupied by the solute), ρb is the scattering density of the hydration shell surrounding the solute, and B(s) is the scattering amplitude from the hydration shell.
Ensemble average scattering profiles 〈Isol (s)〉 using snapshots j taken from simulation trajectories are calculated as follows:
| (7) |
where kB is Boltzmann’s constant and T is temperature. Isol, j (s) were calculated using the program CRYSOL (Svergun et al., 1995), which uses a continuum model of the hydration shell modeled to be 3 Å thick to simulate the first hydration layer. In the CRYSOL fitting process, ρ0 was fixed at 0.334 eÅ−3. ρb ranged from 0.344 to 0.351 eÅ−3, which falls between values calculated for staphylococcal nuclease (Smolin and Winter, 2004) and observed for lysozyme, Escherichia coli thioredoxin reductase, and protein R1 of E. coli ribonucleotide reductase using small-angle X-ray and neutron scattering techniques (Svergun et al., 1998). The excluded volume for the protein snapshots ranged from 38500 to 41400 Å−3, consistent with values obtained using the rolling ball algorithm described by Richards (Richards, 1977; Voss et al., 2006). SAXS data for the GluR2 S1S2 in the apo, DNQX-bound, and AMPA-bound forms were kindly provided by D.R. Madden and P. Vachette (Madden et al., 2005).
The radii of gyration, Rg, were determined from the Guinier approximation (Guinier, 1939), in the range 2πsRg < 1.3, where I0 is the forward scattering. The intercept of the Guinier plot (ln[I(s)] vs. (2πs)2) gives I0, and the slope yields Rg. The quality of agreement between the calculated and experimental scattering profiles is evaluated using the χ2 function,
| (8) |
where N is the number of experimental data points, Iexp (si) and Icalc(si) are the experimental and calculated scattering profiles, respectively, and σ(si) is the experimental standard deviation. Interpolation in the calculated profiles was performed using a cubic spline.
Acknowledgments
We thank N.K. Banavali, Y. Deng, J.D. Faraldo-Gómez, E. Harder, V. Jogini, G. Lamoureux, S.Y. Noskov, A.C. Pan, J.L. Robertson, and D. Sezer for helpful discussion. We thank D.R. Madden and P. Vachette for kindly providing the GluR2 S1S2 SAXS data. This work was partially supported by National Institutes of Health Grants GM 62342 and CA 93577. Computational support from the National Center for Supercomputing Applications (NCSA) and the Pittsburgh Supercomputing Center (PSC) obtained through the National Resource Allocations Committee (NRAC) was used for the calculations.
Footnotes
Publisher's Disclaimer: This is a PDF file of an unedited manuscript that has been accepted for publication. As a service to our customers we are providing this early version of the manuscript. The manuscript will undergo copyediting, typesetting, and review of the resulting proof before it is published in its final citable form. Please note that during the production process errors may be discovered which could affect the content, and all legal disclaimers that apply to the journal pertain.
References
- Abele R, Keinänen K, Madden DR. Agonist-induced isomerization in a glutamate receptor ligand-binding domain. A kinetic and mutagenetic analysis. J Biol Chem. 2000;275:21355–21363. doi: 10.1074/jbc.M909883199. [DOI] [PubMed] [Google Scholar]
- Ahmed AH, Loh AP, Jane DE, Oswald RE. Dynamics of the S1S2 glutamate binding domain of GluR2 measured using 19F NMR spectroscopy. J Biol Chem. 2007;282:12773–12784. doi: 10.1074/jbc.M610077200. [DOI] [PubMed] [Google Scholar]
- Anisimov VM, Lamoureux G, Vorobyov IV, Huang N, Roux B, MacKerell AD., Jr Determination of electrostatic parameters for a polarizable force field based on the classical drude oscillator. J Chem Theo Comp. 2005;1:153–168. doi: 10.1021/ct049930p. [DOI] [PubMed] [Google Scholar]
- Arinaminpathy Y, Sansom MS, Biggin PC. Binding site flexibility: molecular simulation of partial and full agonists within a glutamate receptor. Mol Pharmacol. 2006;69:11–18. doi: 10.1124/mol.105.016691. [DOI] [PubMed] [Google Scholar]
- Armstrong N, Jasti J, Beich-Frandsen M, Gouaux E. Measurement of conformational changes accompanying desensitization in an ionotropic glutamate receptor. Cell. 2006;127:85–97. doi: 10.1016/j.cell.2006.08.037. [DOI] [PubMed] [Google Scholar]
- Armstrong N, Gouaux E. Mechanisms for activation and antagonism of an AMPA-sensitive glutamate receptor: crystal structures of the GluR2 ligand binding core. Neuron. 2000;28:165–181. doi: 10.1016/s0896-6273(00)00094-5. [DOI] [PubMed] [Google Scholar]
- Armstrong N, Mayer M, Gouaux E. Tuning activation of the AMPA-sensitive GluR2 ion channel by genetic adjustment of agonist-induced conformational changes. Proc Natl Acad Sci USA. 2003;100:5736–5741. doi: 10.1073/pnas.1037393100. [DOI] [PMC free article] [PubMed] [Google Scholar]
- Armstrong N, Sun Y, Chen GQ, Gouaux E. Structure of a glutamate-receptor ligand-binding core in complex with kainate. Nature. 1998;395:913–917. doi: 10.1038/27692. [DOI] [PubMed] [Google Scholar]
- Asztely F, Gustafsson B. Ionotropic glutamate receptors. Their possible role in the expression of hippocampal synaptic plasticity. Mol Neurobiol. 1996;12:1–11. doi: 10.1007/BF02740744. [DOI] [PubMed] [Google Scholar]
- Ayalon G, Stern-Bach Y. Functional assembly of AMPA and kainate receptors is mediated by several discrete protein-protein interactions. Neuron. 2001;31:103–113. doi: 10.1016/s0896-6273(01)00333-6. [DOI] [PubMed] [Google Scholar]
- Banavali NK, Roux B. The N-terminal end of the catalytic domain of SRC kinase Hck is a conformational switch implicated in long-range allosteric regulation. Structure. 2005;13:1715–1723. doi: 10.1016/j.str.2005.09.005. [DOI] [PubMed] [Google Scholar]
- Bayly CI, Cieplak P, Cornell WD, Kollman PA. A well-behaved electrostatic potential based method using charge restraints for deriving atomic charges: the RESP model. J Phys Chem. 1993;97:10269–10280. [Google Scholar]
- Bräuner-Osborne H, Egebjerg J, Nielsen EØ, Madsen U, Krogsgaard-Larsen P. Ligands for glutamate receptors: design and therapeutic prospects. J Med Chem. 2000;43:2609–2645. doi: 10.1021/jm000007r. [DOI] [PubMed] [Google Scholar]
- Brooks BR, Bruccoleri RE, Olafson BD, States DJ, Swaminathan S, Karplus M. CHARMM: A program for macromolecular energy, minimization, and dynamics calculations. J Comput Chem. 1983;4:187–217. [Google Scholar]
- Canutescu AA, Shelenkov AA, Dunbrack RL., Jr A graph-theory algorithm for rapid protein side-chain prediction. Protein Sci. 2003;12:2001–2014. doi: 10.1110/ps.03154503. [DOI] [PMC free article] [PubMed] [Google Scholar]
- Cheng Q, Du M, Ramanoudjame G, Jayaraman V. Evolution of glutamate interactions during binding to a glutamate receptor. Nat Chem Biol. 2005;1:329–332. doi: 10.1038/nchembio738. [DOI] [PubMed] [Google Scholar]
- Cull-Candy S, Kelly L, Farrant M. Regulation of Ca2+-permeable AMPA receptors: synaptic plasticity and beyond. Curr Opin Neurobiol. 2006;16:288–297. doi: 10.1016/j.conb.2006.05.012. [DOI] [PubMed] [Google Scholar]
- Debye P. Zerstreuung von Röntgenstrahlen. Ann Phys (Leipzig) 1915;46:809–823. [Google Scholar]
- Dingledine R, Borges K, Bowie D, Traynelis SF. The glutamate receptor ion channels. Pharmacol Rev. 1999;51:7–61. [PubMed] [Google Scholar]
- Essmann U, Perera L, Berkowitz ML, Darden T, Lee H, Pedersen LG. A smooth particle mesh Ewald method. J Chem Phys. 1995;103:8577–8593. [Google Scholar]
- Feller SE, Zhang Y, Pastor RW, Brooks BR. Constant pressure molecular dynamics simulation: The Langevin piston method. J Chem Phys. 1995;103:4613–4621. [Google Scholar]
- Frisch MJ, Trucks GW, Schlegel HB, Scuseria GE, Robb MA, Cheeseman JR, Montgomery JA, Jr, Vreven T, Kudin KN, Burant JC, et al. Gaussian 03, Revision C.02. Gaussian, Inc; Wallingford, CT: 2004. [Google Scholar]
- Guinier A. La diffraction des rayons X aux très faibles angles: applications à l’etude des phénomènes ultra-microscopiques. Ann Phys (Paris) 1939;12:161–236. [Google Scholar]
- Hollmann M, Heinemann S. Cloned glutamate receptors. Annu Rev Neurosci. 1994;17:31–108. doi: 10.1146/annurev.ne.17.030194.000335. [DOI] [PubMed] [Google Scholar]
- Holm MM, Lunn ML, Traynelis SF, Kastrup JS, Egebjerg J. Structural determinants of agonist-specific kinetics at the ionotropic glutamate receptor 2. Proc Natl Acad Sci USA. 2005;102:12053–12058. doi: 10.1073/pnas.0505522102. [DOI] [PMC free article] [PubMed] [Google Scholar]
- Huang N, Banavali NK, MacKerell AD., Jr Protein-facilitated base flipping in DNA by cytosine-5-methyltransferase. Proc Natl Acad Sci USA. 2003;100:68–73. doi: 10.1073/pnas.0135427100. [DOI] [PMC free article] [PubMed] [Google Scholar]
- Humphrey W, Dalke A, Schulten K. VMD - Visual Molecular Dynamics. J Molec Graphics. 1996;14:33–38. doi: 10.1016/0263-7855(96)00018-5. [DOI] [PubMed] [Google Scholar]
- Isaac JTR, Ashby M, McBain CJ. The role of the GluR2 subunit in AMPA receptor function and synaptic plasticity. Neuron. 2007;54:859–871. doi: 10.1016/j.neuron.2007.06.001. [DOI] [PubMed] [Google Scholar]
- Jorgensen WL, Chandrasekhar J, Madura JD, Impey RW, Klein ML. Comparison of simple potential functions for simulating liquid water. J Chem Phys. 1983;79:926–935. [Google Scholar]
- Kristiansen LV, Huerta I, Beneyto M, Meador-Woodruff JH. NMDA receptors and schizophrenia. Curr Opin Pharmacol. 2007;7:48–55. doi: 10.1016/j.coph.2006.08.013. [DOI] [PubMed] [Google Scholar]
- Kumar S, Rosenberg JM, Bouzida D, Swendsen RH, Kollman PA. The weighted histogram analysis method for free-energy calculations on biomolecules. I The method J Comput Chem. 1992;13:1011–1021. [Google Scholar]
- Kuusinen A, Arvola M, Keinänen K. Molecular dissection of the agonist binding site of an AMPA receptor. EMBO J. 1995;14:6327–6332. doi: 10.1002/j.1460-2075.1995.tb00323.x. [DOI] [PMC free article] [PubMed] [Google Scholar]
- MacKerell AD, Jr, Bashford D, Bellott M, Dunbrack RL, Jr, Evanseck JD, Field MJ, Fischer S, Gao J, Guo H, Ha S, et al. All-atom empirical potential for molecular modeling and dynamics studies of proteins. J Phys Chem B. 1998;102:3586–3616. doi: 10.1021/jp973084f. [DOI] [PubMed] [Google Scholar]
- Madden DR, Armstrong N, Svergun D, Perez J, Vachette P. Solution X-ray scattering evidence for agonist- and antagonist-induced modulation of cleft closure in a glutamate receptor ligand-binding domain. J Biol Chem. 2005;280:23637–23642. doi: 10.1074/jbc.M414523200. [DOI] [PubMed] [Google Scholar]
- Madden DR. The structure and function of glutamate receptor ion channels. Nat Rev Neurosci. 2002;3:91–101. doi: 10.1038/nrn725. [DOI] [PubMed] [Google Scholar]
- Mamonova T, Hespenheide B, Straub R, Thorpe MF, Kurnikova M. Protein flexibility using constraints from molecular dynamics simulations. Phys Biol. 2005;2:S137–147. doi: 10.1088/1478-3975/2/4/S08. [DOI] [PubMed] [Google Scholar]
- Mayer ML. Glutamate receptors at atomic resolution. Nature. 2006;440:456–462. doi: 10.1038/nature04709. [DOI] [PubMed] [Google Scholar]
- Mayer ML, Ghosal A, Dolman NP, Jane DE. Crystal structures of the kainate receptor GluR5 ligand binding core dimer with novel GluR5-selective antagonists. J Neurosci. 2006;26:2852–2861. doi: 10.1523/JNEUROSCI.0123-06.2005. [DOI] [PMC free article] [PubMed] [Google Scholar]
- McFeeters RL, Oswald RE. Emerging structural explanations of ionotropic glutamate receptor function. FASEB J. 2004;18:428–438. doi: 10.1096/fj.03-0873rev. [DOI] [PubMed] [Google Scholar]
- McFeeters RL, Oswald RE. Structural mobility of the extracellular ligand-binding core of an ionotropic glutamate receptor. Analysis of NMR relaxation dynamics. Biochemistry. 2002;41:10472–10481. doi: 10.1021/bi026010p. [DOI] [PubMed] [Google Scholar]
- Mendieta J, Gago F, Ramírez G. Binding of 5′-GMP to the GluR2 AMPA receptor: insight from targeted molecular dynamics simulations. Biochemistry. 2005;44:14470–14476. doi: 10.1021/bi051084x. [DOI] [PubMed] [Google Scholar]
- Nakagawa T, Cheng Y, Ramm E, Sheng M, Walz T. Structure and different conformational states of native AMPA receptor complexes. Nature. 2005;433:545–549. doi: 10.1038/nature03328. [DOI] [PubMed] [Google Scholar]
- O’Neill MJ, Bleakman D, Zimmerman DM, Nisenbaum ES. AMPA receptor potentiators for the treatment of CNS disorders. Curr Drug Targets CNS Neurol Disord. 2004;3:181–194. doi: 10.2174/1568007043337508. [DOI] [PubMed] [Google Scholar]
- O’Neill MJ, Witkin JM. AMPA receptor potentiators: application for depression and Parkinson’s disease. Curr Drug Targets. 2007;8:603–620. doi: 10.2174/138945007780618517. [DOI] [PubMed] [Google Scholar]
- Ramanoudjame G, Du M, Mankiewicz KA, Jayaraman V. Allosteric mechanism in AMPA receptors: a FRET-based investigation of conformational changes. Proc Natl Acad Sci USA. 2006;103:10473–10478. doi: 10.1073/pnas.0603225103. [DOI] [PMC free article] [PubMed] [Google Scholar]
- Ravindranathan KP, Gallicchio E, Levy RM. Conformational equilibria and free energy profiles for the allosteric transition of the ribose-binding protein. J Mol Biol. 2005;353:196–210. doi: 10.1016/j.jmb.2005.08.009. [DOI] [PubMed] [Google Scholar]
- Richards FM. Areas, volumes, packing and protein structure. Annu Rev Biophys Bioeng. 1977;6:151–176. doi: 10.1146/annurev.bb.06.060177.001055. [DOI] [PubMed] [Google Scholar]
- Robert A, Armstrong N, Gouaux JE, Howe JR. AMPA receptor binding cleft mutations that alter affinity, efficacy, and recovery from desensitization. J Neurosci. 2005;25:3752–3762. doi: 10.1523/JNEUROSCI.0188-05.2005. [DOI] [PMC free article] [PubMed] [Google Scholar]
- Rogers SW, Andrews PI, Gahring LC, Whisenand T, Cauley K, Crain B, Hughes TE, Heinemann SF, McNamara JO. Autoantibodies to glutamate receptor GluR3 in Rasmussen’s encephalitis. Science. 1994;265:648–651. doi: 10.1126/science.8036512. [DOI] [PubMed] [Google Scholar]
- Roux B, Schulten K. Computational studies of membrane channels. Structure. 2004;12:1343–1351. doi: 10.1016/j.str.2004.06.013. [DOI] [PubMed] [Google Scholar]
- Ryckaert JP, Ciccotti G, Berendsen HJC. Numerical integration of cartesian equations of motion of a system with constraints: molecular dynamics of n-alkanes. J Comput Phys. 1977;23:327–341. [Google Scholar]
- Schorge S, Colquhoun D. Studies of NMDA receptor function and stoichiometry with truncated and tandem subunits. J Neurosci. 2003;23:1151–1158. doi: 10.1523/JNEUROSCI.23-04-01151.2003. [DOI] [PMC free article] [PubMed] [Google Scholar]
- Smolin N, Winter R. Molecular dynamics simulations of staphylococcal nuclease: properties of water at the protein surface. J Phys Chem B. 2004;108:15928–15937. [Google Scholar]
- Souaille M, Roux B. Extension to the weighted histogram analysis method: combining umbrella sampling with free energy calculations. Comput Phys Comm. 2001;135:40–57. [Google Scholar]
- Speranskiy K, Kurnikova M. On the binding determinants of the glutamate agonist with the glutamate receptor ligand binding domain. Biochemistry. 2005;44:11508–11517. doi: 10.1021/bi050547w. [DOI] [PubMed] [Google Scholar]
- Stern-Bach Y, Bettler B, Hartley M, Sheppard PO, O’Hara PJ, Heinemann SF. Agonist selectivity of glutamate receptors is specified by two domains structurally related to bacterial amino acid-binding proteins. Neuron. 1994;13:1345–1357. doi: 10.1016/0896-6273(94)90420-0. [DOI] [PubMed] [Google Scholar]
- Stryer L, Haugland RP. Energy transfer: a spectroscopic ruler. Proc Natl Acad Sci USA. 1967;58:719–726. doi: 10.1073/pnas.58.2.719. [DOI] [PMC free article] [PubMed] [Google Scholar]
- Sun Y, Olson R, Horning M, Armstrong N, Mayer M, Gouaux E. Mechanism of glutamate receptor desensitization. Nature. 2002;417:245–253. doi: 10.1038/417245a. [DOI] [PubMed] [Google Scholar]
- Svergun D, Barberato C, Koch MHJ. CRYSOL - a program to evaluate X-ray solution scattering of biological macromolecules from atomic coordinates. J Appl Cryst. 1995;28:768–773. [Google Scholar]
- Svergun DI, Richard S, Koch MH, Sayers Z, Kuprin S, Zaccai G. Protein hydration in solution: experimental observation by x-ray and neutron scattering. Proc Natl Acad Sci USA. 1998;95:2267–2272. doi: 10.1073/pnas.95.5.2267. [DOI] [PMC free article] [PubMed] [Google Scholar]
- Tichelaar W, Safferling M, Keinänen K, Stark H, Madden DR. The three-dimensional structure of an ionotropic glutamate receptor reveals a dimer-of-dimers assembly. J Mol Biol. 2004;344:435–442. doi: 10.1016/j.jmb.2004.09.048. [DOI] [PubMed] [Google Scholar]
- Torrie GM, Valleau JP. Nonphysical sampling distributions in Monte Carlo free-energy estimation: umbrella sampling. J Comput Phys. 1977;23:187–199. [Google Scholar]
- Valentine ER, Palmer AG., III Microsecond-to-millisecond conformational dynamics demarcate the GluR2 glutamate receptor bound to agonists glutamate, quisqualate, and AMPA. Biochemistry. 2005;44:3410–3417. doi: 10.1021/bi047984f. [DOI] [PubMed] [Google Scholar]
- Voss NR, Gerstein M, Steitz TA, Moore PB. The geometry of the ribosomal polypeptide exit tunnel. J Mol Biol. 2006;360:893–906. doi: 10.1016/j.jmb.2006.05.023. [DOI] [PubMed] [Google Scholar]
- Woo HJ, Roux B. Calculation of absolute protein-ligand binding free energy from computer simulations. Proc Natl Acad Sci USA. 2005;102:6825–6830. doi: 10.1073/pnas.0409005102. [DOI] [PMC free article] [PubMed] [Google Scholar]
- Wriggers W, Schulten K. Protein domain movements: detection of rigid domains and visualization of hinges in comparisons of atomic coordinates. Proteins. 1997;29:1–14. [PubMed] [Google Scholar]