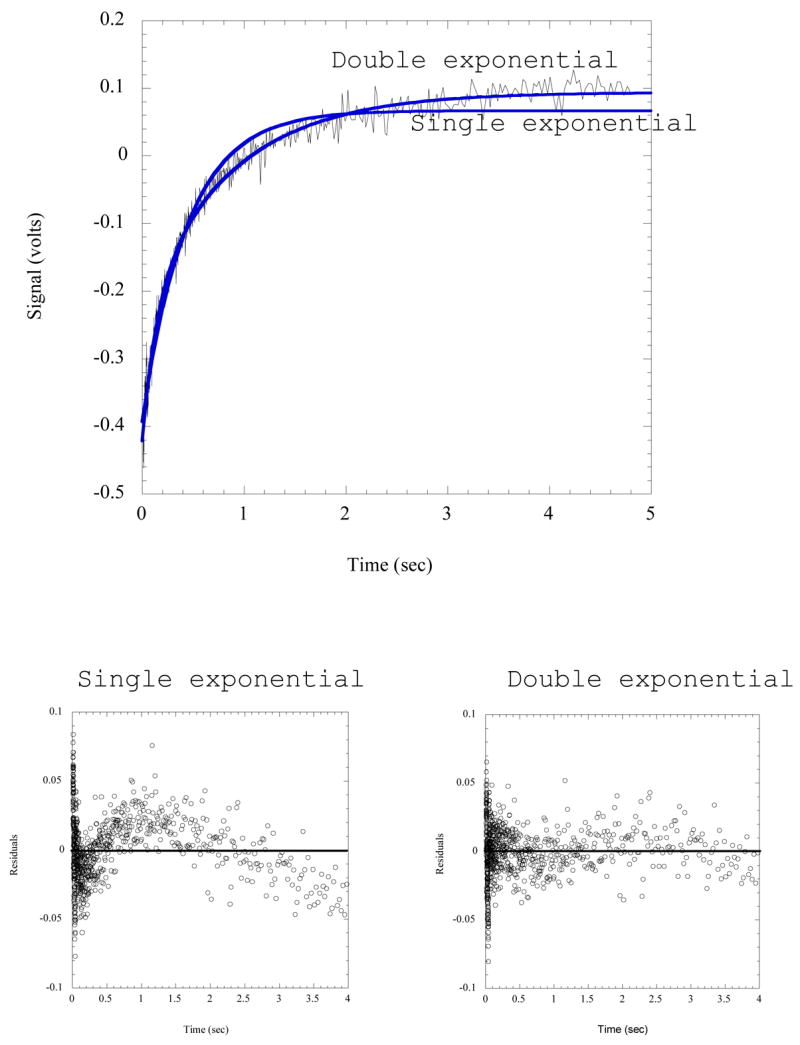
Figure 7.

Comparison of single and double exponential fits to stopped flow fluorescence data. The reaction trace shown records the formation of His-tRNAHis by rapid mixing of HisRS·His~AMP with tRNAHis, employing MDCC-labeled HisRS. Fits to both a single and double exponential are shown on the plot; and the resulting residuals are plotted below. The wave-like pattern of the residuals relative to zero for the single exponential is indicative of a poorer fit.
