Abstract
To clarify how the information of spatiotemporal sequence of the hippocampal CA3 affects the postsynaptic membrane potentials of single pyramidal cells in the hippocampal CA1, the spatio-temporal stimuli was delivered to Schaffer collaterals of the CA3 through a pair of electrodes and the post-synaptic membrane potentials were recorded using the patch-clamp recording method. The input–output relations were sequentially analyzed by applying two measures; “spatial clustering” and its “self-similarity” index. The membrane potentials were hierarchically clustered in a self-similar manner to the input sequences. The property was significantly observed at two and three time-history steps. In addition, the properties were maintained under two different stimulus conditions, weak and strong current stimulation. The experimental results are discussed in relation to theoretical results of Cantor coding, reported by Tsuda (Behav Brain Sci 24(5):793–847, 2001) and Tsuda and Kuroda (Jpn J Indust Appl Math 18:249–258, 2001; Cortical dynamics, pp 129–139, Springer-Verlag, 2004).
Keywords: Spatiotemporal coding, Spatial clustering and its self-similarity, Single neuron, Hippocampus, Time-history, Patch-clamp recording
Introduction
Physiologically, it is believed that contextual information is temporarily stored in the hippocampus in the form of short-term memory. It is an important theme for the investigation of memory systems to clarify how information is coded and represented in hippocampus. There are roughly three regions in hippocampus: dentate gyrus, CA3, and CA1. Input from entorhinal cortex is sent via a circuit to dentate gyrus. Dentate gyrus is connected through a circuit with CA3, and CA3–CA1. The CA3 area is characterized by a distinct biological neural network, which has a recurrent (feedback) connection. On this subject, Nakazawa et al. (2002) have reported that after knocking out feedback in CA3 of mice using genetic techniques, an extremely large number of cues were required to accomplish one action. According to these observations, it can be hypothesized that the hippocampal CA3 network forms a context of time sequence, while CA1 maps the spatio-temporal context to its synaptic weight space (Tsukada et al. 1996; Tsukada and Pan 2005; Tsukada et al. 2007). In the CA1 area of the hippocampus, the magnitude of LTP depends not only on the frequency of applied stimuli, but also on time sequences (Tsukada et al. 1994, 1996; Aihara et al. 1997). However, the coding property of spatial clustering and its self-similarity has not been experimentally reported in the input–output relation of hippocampal CA1 neurons.
Tsuda (2001) and Tsuda and Kuroda (2001, 2004) reported the possibility of Cantor coding in CA3–CA1 network. Cantor coding is an information coding scheme for temporal sequences of events (Tsuda et al. 1987; Tsuda 1992, 1996; Tsuda and Yamaguti 1998). It forms a hierarchical structure in state space of neural dynamics. In the model, it is assumed that the CA3 state is wondering around quasi-attractors, each of which represents a single episodic event, and that CA3 outputs a temporal sequence of events, which should be encoded in CA1, especially in temporal dimensions. Input-dependent distribution of CA1 state is hierarchically clustered in the vector space.
The current study was done to clarify how information of spatiotemporal sequence from CA3 affects the post-synaptic membrane potential of hippocampal CA1 neurons. The spatiotemporal stimulus using two stimulating electrodes was delivered to Schaffer collaterals at variable spatio-temporal patterns, and post-synaptic membrane potentials were recorded using the patch-clamp recording method. The recorded responses were sequentially analyzed by using two measures; spatial clustering and its self-similarity index. The results are discussed theoretical results of Cantor coding.
Materials and methods
Preparations and patch-clamp recording
All procedures were approved by Tamagawa University Animal Care and Use Committee. Brain slices of Wister rats (4–5 weeks old) were made according to the standard procedure reported by Tsukada et al. (2005). The brain was sliced at an angle of 30–45° along the long axis of the hippocampus, with a thickness of 300 μm. Before the start of recording, slices were kept in bath solutions (142 NaCl/2 MgSO4/5 KCl/2.6 NaH2PO4/2 CaCl2/26 NaHCO3/10 glucose (mM), bubbled with 95% O2/5% CO2) at room temperature for at least 60 min.
The slice was placed in the recording chamber. Neurons were visualized with IR-DIC camera (C2741-79H, Hamamatsu, Japan). Recording electrodes were pulled from borosilicate glass and the resistance was 5–8 MΩ. Recordings were done at 28–30°C. The internal solution of the recording electrode was prepared following Magee (2001), and contained 120 KMeSO4/20 KCl/10 HEPES/10 EGTA/4 Mg2ATP/0.3 TrisGTP /14 Tris2phosphocreatine/4 NaCl (mM, pH 7.25 with KOH). The starting voltage of recorded neurons was between −55 and −62 mV, and the membrane potential was kept at −68 mV by current injection to the soma. Whole cell patch clamp recording was performed from the soma using an electrical amplifier (CEZ-3100, Nihonkoden, Japan). Signals were filtered at 10 kHz, sampled at 25 kHz, and stored (micro1401, CED, England). When needed, 50 μM D-APV (Sigma) was applied to the bath solutions.
Electrical stimulation
EPSPs were induced by extracellular electrical stimulation using two theta glass electrodes (TST-150-6, WPI, Florida). The tips of the two electrodes were set to the Schaffer collaterals, proximal and distal sites to the soma (Fig. 1a). The strength of the stimulating current was adjusted to the amplitude of the elicited EPSP to 1–6 mV. The duration of electrical stimulation was 200 μs. The two electrodes were set without overlap of the stimulating pathway between the two electrodes, as was checked in paired-pulse facilitation (50 ms interval). One of four input spatial patterns of electrical stimulations was randomly applied in 30 ms intervals for 20 s. The four input spatial patterns were as follows: (1) electrical stimulation through both electrodes (“11”), (2) electrical stimulation through one electrode (“10”), (3) electrical stimulation through the other electrode (“01”), and (4) no electrical stimulation (“00”). In the CA1 area in vivo, a range of oscillations was observed, including theta (4–8 Hz), alpha (8–13 Hz), beta (13–30 Hz), and gamma (over 30 Hz) waves (Buzsaki and Draguhn 2004). In the present study, we applied electrical stimulation below 33 Hz (mean: 22 Hz) and analyzed at 33 Hz bin width, because afferent sensory input comes to hippocampus on gamma frequency band (Csicsvari et al. 2003).
Fig. 1.
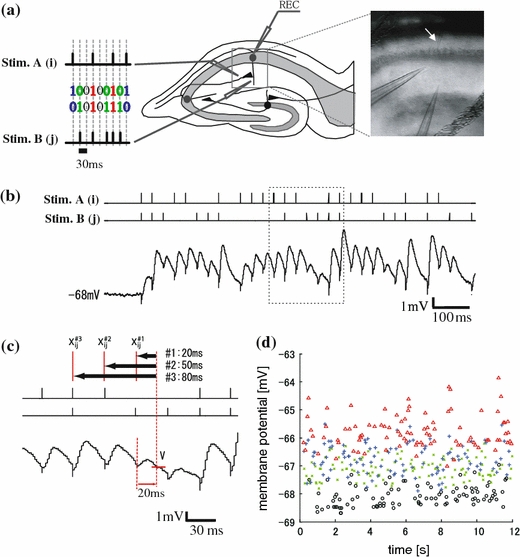
Experimental procedure and sample traces. (a) Schematic diagram (left) and IR-DIC image of hippocampal slices (right). Two independent extracellular electrodes were set onto the Schaffer collaterals in hippocampal CA1 areas. There were four input spatial patterns of electrical stimulation: electrical stimulation through both electrodes (“11” (red)), either electrode (“10” (blue) and “01” (green)), and neither electrode (“00” (black)). A random-ordered successive input spatial pattern appears sequentially in 30 ms intervals. The right image indicates IR-DIC image of the hippocampal CA1 areas. The white arrow indicates the recording electrode. The lower two electrodes are stimulation electrodes. (b) Sample traces of membrane potentials recorded from the soma of pyramidal neurons in rat hippocampal CA1 area. The upper two traces indicate the timing of electrical stimulation and the lower trace indicates membrane potentials recorded from neurons. The temporal timing of these traces was adjusted. (c) Schematic diagrams of the representative membrane potential (“amplitude”) and the stimulus patterns in the sequences. Three traces were corresponded to the timing of the rectangle area in (b). Left red vertical dotted line indicates one example of the timing of stimulation. Right dotted vertical line indicates the timing of 20 ms after pattern stimulation. The cross point of right dotted vertical line and red horizontal solid line indicates the representative value of the responses, “amplitude”. The “amplitudes” were classified by the pattern one time-history step (“X#1ij”), by the pattern two step before the sequence (“X#2ij”) and by the pattern three steps before the sequences (“X#3ij”). (d) Stable responses of the amplitudes classified into the four input spatial pattern groups for 12 s. The X-axis indicates recorded-timing (s) during a 12-s sequence of electrical stimulation. The Y-axis indicates amplitude (mV) at the timing of crossing line in (c). The color of plots indicate input spatial pattern; red, blue, green, and black traces indicate membrane potentials induced by the "11", "10", "01", and "00" type of electrical stimulation, respectively
Data analysis
The amplitude at the timing of 20 ms after each pattern of electrical stimulation was used as a representative value of responses, to analyze the coding property after action potentials (Fig. 1c). The timing dependency of the clustering property was not observed after action potentials (data not shown).
To clarify the fatigue point of the neuron by continual electrical stimulation, the moving average and standard deviation of the membrane potentials were measured in a 300 ms window from the starting point of electrical stimulation (data not shown). After 20 s of input spatio-temporal sequence, the standard deviation of the responses decreased drastically. Therefore, we analyzed the responses for 400 stimulus pairs from 0.3–12.3 s. The first 10 pairs were eliminated because of instability. Figure 1c shows the temporal change of the membrane potentials (amplitude) by continual electrical stimulation. As shown in Fig. 1d, no temporal change was observed in amplitudes, indicating there was no effect of fatigue and potent under continual electrical stimulation.
To clarify the input strength dependency, neural responses were classified into two groups, sub-threshold and supra-threshold. This classification was defined by whether the continual stimulation induced a few action potentials or not. Electrical stimulation to the neurons in the sub-threshold group induced no action potentials for 12 s of the analyzed period (n = 6), whereas some action potentials were observed in the supra-threshold group (n of APs; 8.00 ± 3.97 (mean ± S.E.M.), n = 6). We used two stimulating electrodes. Strong electrical stimulation was applied through one electrode, and weak electrical stimulation was applied through the other electrode. In sub-threshold groups, induced EPSPs through weak and strong pathway alone were 1.13 ± 0.13 and 2.16 ± 0.36 (mV), respectively. In supra-threshold groups, those in weak and strong pathway alone were 2.22 ± 0.53 and 5.15 ± 0.85 mV, respectively. We did not apply inputs through both electrodes before input of random spatio-temporal sequence. It is assumed that electrical stimulation at the same timing induced simply additive responses by the two inputs, because no input pathways overlapped. “00” pattern input induces no change in the membrane potentials.
To confirm that the dependency on input current intensity is not simply due to the difference ratio of the peak amplitudes of two EPSPs via two stimulating electrodes, standard deviations of the EPSP peak were standardized and averaged in each classified group (data not shown). There was no significant difference.
To see the overall tendency of the spatial clustering property and its self-similarity, we made two kinds of graphs, average time course of membrane potentials, and standard cumulative histograms. First, the average time course of membrane potentials is shown, which is dependent on the spatio-temporal input sequence. The X-axis indicates time in ms. The Y-axis indicates the averaged membrane potentials. Four traces indicate the time course of membrane potentials for the four spatio-temporal input sequence patterns. Second, the standard cumulative histogram indicates the distribution and ordering of the responses among the four spatial input patterns at the timing of 20 ms after electrical stimulation. The X-axis indicates the membrane potentials at the timing of 20 ms and the Y-axis indicates the cumulative frequency of the responses below the membrane potentials of the X-axis. The four traces indicate the cumulative frequency in four spatio-temporal input sequence pattern. By counting the instances of overlap and crossing in the four traces, the distribution tendency of membrane responses could be evaluated. By examining the order of traces, ordering of the responses could be estimated in this graph.
Statistical analysis
To evaluate how spatiotemporal information from CA3 affects the membrane potentials of CA1 neurons, the following two measures were used in this paper: (1) a “spatial clustering index”, which indicates a pattern classification measure for spatial input pattern (“11”, “10”, “01”, “00”) at each time-history, and (2) a “self-similarity index”, which indicates a measure of hierarchical self-similarity in time-history. Two-way ANOVAs and Fisher’s LSD were used for statistical analysis.
(1) Spatial clustering index: First, each response was classified into four groups (Gij (ij = 11, 10, 01, 00)) with regard to the spatial input pattern. The mean amplitude of each group was calculated and defined as the "weighted-center" of each group (W00, W01, W10, and W11). The difference between an amplitude (Vij {i, j=0 or 1}, where ij is stimulus pattern) and "weighted-center" except its own value (W00, W01, W10, W11) was defined as distances (D00, D01, D10, D11). If the shortest distance (Dmin) when Vij was given belonged to the identical group (Gij) of its own input pattern (ij), the “cluster point” (Cij) was assigned a zero (Cij = Cij + 0). If not, the “cluster point” was assigned one (Cij = Cij + 1). This procedure was applied to all values of Vij. The cluster points were normalized using the following equation;
 |
Nij is the number of responses belonging to Gij and 0.75 is the compensation factor of chance-level. “Spatial clustering index” ( ) was defined as the averaged value from four
  . The value
  ranged from 0 (non-overlapping state) to 1 (randomly overlapping).
  indicates a spatial clustering index for nth time-history steps shown in Fig. 1c. A sequence of spatial clustering index
  is calculated for each input sequence.
(2) Self-similarity index: A self-similarity index indicates a measure of hierarchical self-similarity. The four weighted centers (W00, W01, W10, and W11) for each time-history step of the spatial input pattern forms an observed pattern in amplitudes. The self-similarity measure (PN) is the necessary number of neighboring permutations to get a target-ordered pattern to correspond with the standard pattern (the ordered pattern of 1st time history step). The self-similarity index  is obtained by normalizing the measure PN for the chance level (3). The value
  ranged from 0 (same order) through 1 (random order) to 2 (completely opposite order).
  indicates a self-similarity index between nth and 1st time-history step (standard). A sequence of self-similarity index
  is calculated for each input sequence.
Results
Classification of average membrane potential in one, two, and three time-history steps under sub- and supra-threshold conditions
One example of the membrane potentials of one, two, and three time history steps (#1, #2, #3) is shown in Fig. 2a, b, and c respectively. First, the membrane potentials of (#1) were classified into four ordered traces of averaged membrane potentials depending on the spatial input pattern {X#1ij} = (00, 01, 10, and 11) (Fig. 2a). The ordering of averaged membrane potentials was the following over a time period of 25 ms: V11(t) > V10(t) > V01(t) > V00(t). This tendency was found in 4/6 neurons under sub-threshold conditions. In the remaining two neurons, the ordering was as follows; V11(t) > V01(t) > V10(t) > V00(t). Second, each of the membrane potentials of #1 was subdivided into four traces (#2) by 2nd time history steps (Fig. 2b). The new potentials of (#1, #2) were classified into 16 ordered traces depending on 16 spatio-temporal input patterns. Each one trace shows four traces for X#2ij when given by X#1ij. The membrane potential in Fig. 2b (X#2ij,X#100) was subdivided into four traces with the following order over 50 ms, V11(t) > V10(t) > V01(t) > V00(t). The ordering of four traces is identical to that of Fig. 2a {X#2ij}. A similar tendency was observed in the ordering in Fig. 2b, (X#2ij,X#101), (X#2ij,X#110), and (X#2ij,X#111), although two traces (X#211,X#111) and (X#211,X#110) partially overlapped in (X#2ij,X#111). These results show a conspicuous level of self-similarity in the ordering of average membrane potentials between two time-history steps. Third, each of the membrane potentials of #2 was subdivided into four traces (#3) by 3rd time history steps (Fig. 2c). The new potentials of (#1, #2, #3) were classified into 64 ordered traces depending on 64 spatio-temporal input patterns. Each one trace shows four traces for X#3ij when given by X#2ij. A similar tendency was observed in the ordering at three time-history steps in Fig. 2c, however, the probability of the ordering similar to standard ordering was decreased comparing to that at two time-history steps (Fig. 2b).
Fig. 2.
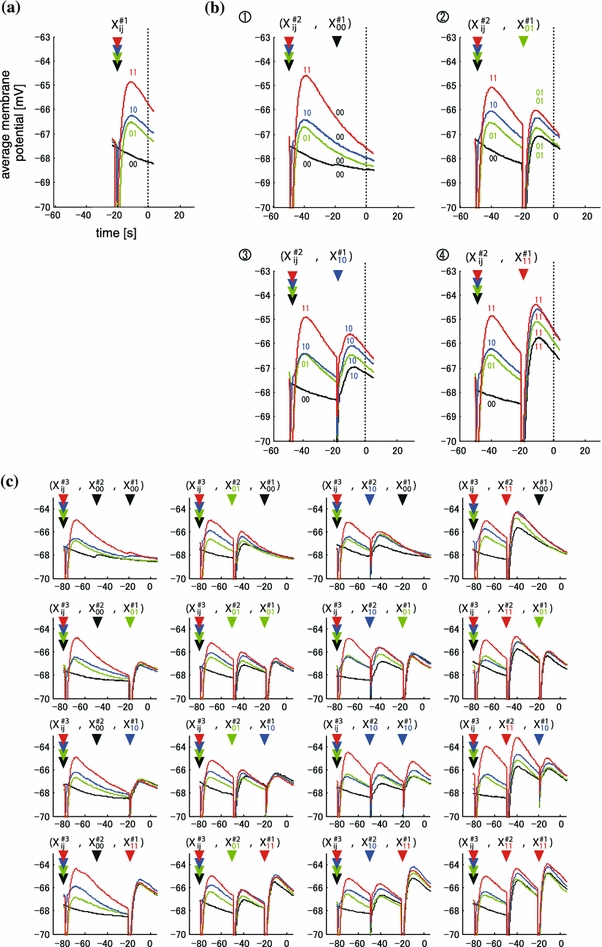
Example of time-course of average amplitude of the responses in sub-threshold group. (a) Time course of averaged amplitudes in the four groups, which is classified by the pattern one time- history step. The color of traces indicate spatial stimulation pattern by the 1 time-history step; Red, blue, green, and black traces indicate membrane potentials induced by the spatial pattern of “11”, “10”, “01”, and “00”, respectively. Input spatial pattern was applied at the timing of arrowheads of four colors (X#1ij). Vertical dotted line indicates the timing of represented value of amplitude. The X- and Y-axis indicate time (ms) and membrane potentials (mV), respectively. The timing of amplitudewas defined as 0 ms. (b) Time course of averaged amplitudes in the sixteen groups, which is classified by the pattern two history-steps. Each four traces in (a) was subclassified into four groups by the pattern at two time history step. The four graphs indicate subclassified traces of four spatial patterns: upper left, upper right, lower left, and lower right graph showed subdivided responses of “X#100” (black trace), “X#101” (green trace), “X#110” (blue trace), and “X#111” (red trace) in (a), respectively. In each graph, the color of right arrowhead above the traces indicates the timing and spatial pattern of input. Each trace was subclassified into four traces by the spatial pattern of two time-history steps. The color of the trace indicates the two preceding input temporal pattern: red, blue, green, and black indicate "11", "10", "01", and "00", respectively. (c) Time course of averaged amplitudes in the sixty-four groups, which is classified by the pattern three time-history steps. Each of four traces in (b) was subclassified into four groups by the pattern at three time history steps. The sixteen graphs indicate subclassified traces of four spatial patterns: each four graphs of upper, middle upper, middle lower, and lower row showed subdivided responses of “(X#2ij,X#100)” (upper left graph), “(X#2ij,X#101)” (upper right graph), “(X#2ij,X#110)” (lower left graph), and “(X#2ij,X#111)” (lower right graph) in (b), respectively
One example of the membrane potentials of one, two, and three time history steps (#1, #2) in supra-threshold condition is shown in Fig. 3a–c. First, as similar as those under sub-threshold conditions, the membrane potentials of (#1) were classified into four ordered traces of averaged membrane potentials depending on the spatial input pattern (Fig. 3a). The ordering of the averaged membrane potentials was as follows: V11(t) > V10(t) > V01(t) > V00(t) over a time period of 25 ms except around the time of the action potential. This tendency was found in 5/6 neurons under supra-threshold conditions. In the remaining neuron, the ordering was as follows; V11(t) > V01(t) > V10(t) > V00(t). Each membrane potential of #1 was subdivided into four traces (#2) by 2nd time history steps (Fig. 3b) as under sub-threshold condition. The membrane potential in Fig. 3b (X#2ij,X#100) and (X#2ij,X#101) was subdivided into four traces with the following order over 50 ms, V11(t) > V10(t) > V01(t) > V00(t). The ordering of the four traces is identical to that of Fig. 3a {X#1ij}. A different tendency was observed in the ordering in Fig. 3b; the upset response to Fig. 3a {X#1ij} was observed in two pair traces, ((X#211,X#111) and (X#210,X#111)) in (X#2ij,X#111), and ((X#210,X#110) and (X#211,X#110)) in (X#2ij,X#110). Third, each membrane potential of #2 was subdivided into four traces (#3) by 3rd time history steps (Fig. 3c). A similar tendency was observed in the ordering in Fig. 2c, however, the observed order was less pronounced that those at the two time-history steps. These results show a self-similarity in the ordering of average membrane potentials between two time-history steps in almost cases, but some “upset activity,” which did not simply depend on the preceding difference of membrane potentials, was observed.
Fig. 3.
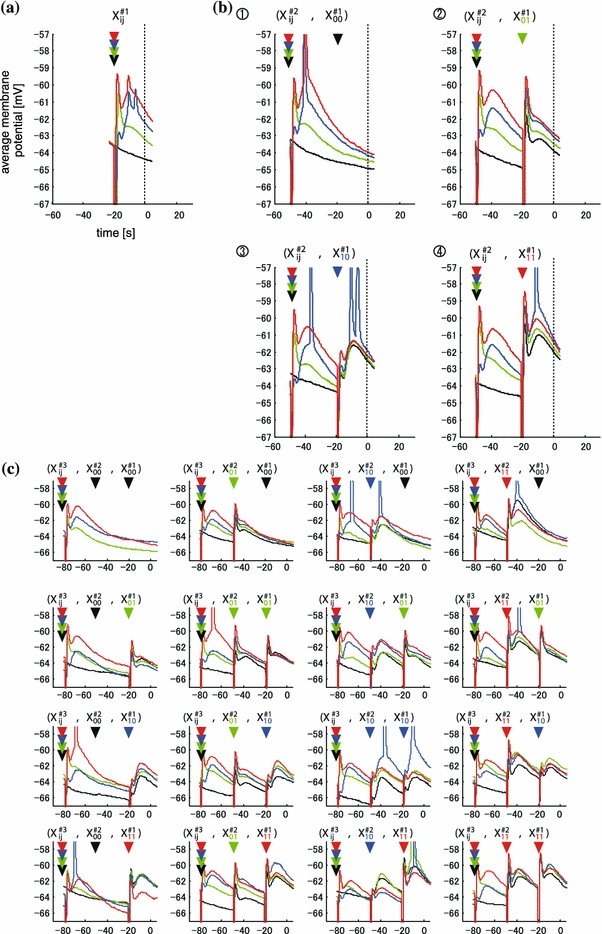
Example of time-course of average amplitude of the responses in supra-threshold group. The relationships among the graphs are consistent with those in Fig.2a–c. Time course of averaged amplitudes in the four (a), sixteen (b), and sixty-four groups (c), which is classified by the pattern one (a), two (b), and three (c) time-history steps sequences, respectively
Distributions of membrane amplitudes in one, two, and three time-history steps under sub- and supra-threshold conditions
We analyzed the spatial distribution of membrane amplitudes. Figure 4a–c shows one example of the standard cumulative histograms (SCH) of membrane amplitudes. The histograms were classified into four traces for each spatial input pattern. The SCH in Fig. 4a could clearly be classified into four traces depending on the spatial input pattern. The SCHs in Fig. 4b could also be classified into four traces, except for one instance of overlap between two traces (X#211,X#111) and (X#211,X#110) in (X#2ij,X#111). The SCHs in Fig. 4c (#3) were less easily classified; four traces frequently crossed and overlapped. The ordering properties of #3 also decreased in comparison with that of #2 and #1.
Fig. 4.
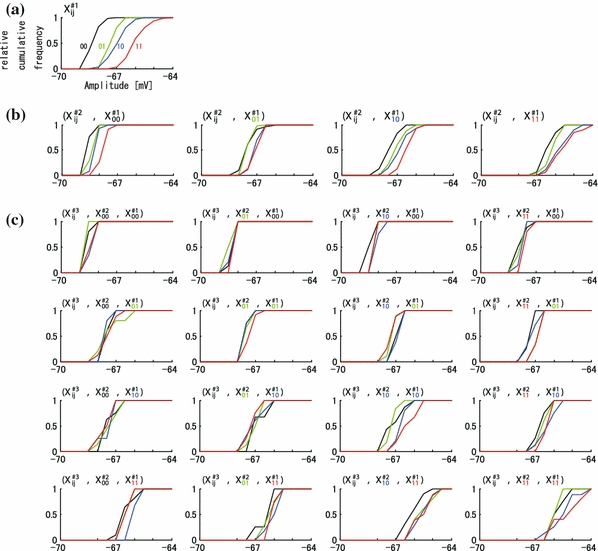
An example of distribution of membrane potentials by one, two, and three time history-steps in sub-threshold group. (a) Standardized cumulative histogram (SCH) of amplitude by the pattern of spatial input at one time-history step. The X-axis indicates the amplitudes (mV, referred also dotted lines in Fig. 2a). The colors of traces indicate the distribution of input spatial patterns: red, blue, green, and black traces indicate the spatial input pattern of “X#100”,“X#101”,“X#110”, and “X#111”, respectively. The Y-axis indicates standard cumulative frequency of amplitudes. (b) SCH by the pattern of spatial input at two time-history steps. The trace in (a) “X#100”,“X#101”,“X#110”, and “X#111” was further subclassified into “(X#2ij,X#100)” (left graph),“(X#2ij,X#101)” (middle left graph),“(X#2ij,X#110)” (middle right graph), and “(X#2ij,X#111)” (right graph) by the pattern at two time-history steps, respectively. In each graph, the distribution of the amplitudes by one time-history step is indicated by the color of the traces: black, green, blue, and red traces indicate the distribution of the response by “X#200”,“X#201”,“X#210”, and “X#211”, respectively. (c) SCH by the pattern of spatial input at three time-history steps. The graph in (b) “(X#2ij,X#100)”, “(X#2ij,X#101)”, “(X#2ij,X#110)”, and “(X#2ij,X#111)” was further subclassified into “(X#3ij,X#2ij,X#100)” (upper four graphs), “(X#3ij,X#2ij,X#101)” (upper middle four graphs), “(X#3ij,X#2ij,X#110)” (lower middle four graphs), and “(X#3ij,X#2ij,X#111)” (lower four graphs) in (c) by the pattern at three time-history steps, respectively. In each graph, the distribution of the amplitudes by three time-history steps is indicated by the color of the traces: black, green, blue, and red traces indicate the distribution of the response by “X#300”,“X#301”,“X#310”, and “X#311”, respectively
We also analyzed the spatial distribution of membrane amplitudes under supra-threshold conditions. Figure 5a–c shows one example of the SCH of membrane amplitudes. The SCH of Fig. 5a–b show similar property to those of Fig. 4a–b. In supra-threshold conditions (Fig. 5c), crossing and overlapping was observed less often than under sub-threshold conditions shown in Fig. 4c. As like as sub-threshold conditions, the ordering properties of #3 also decreased in comparison with those of #2 and #1 under supra-threshold conditions.
Fig. 5.
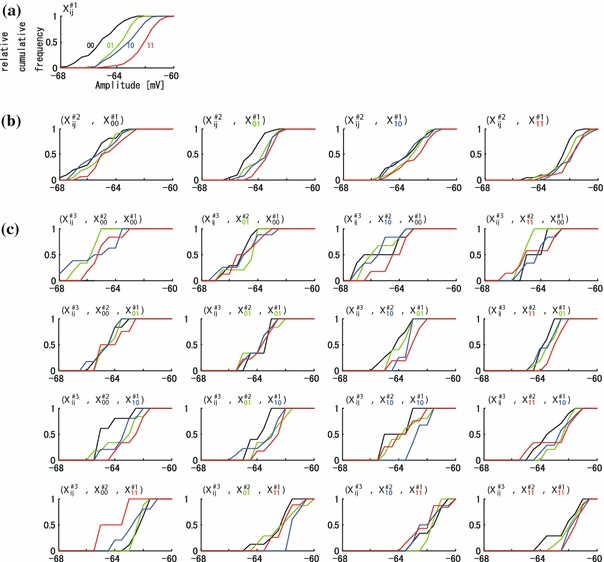
An example of distribution of membrane potentials by one, two, and three time-history steps in supra-threshold group. The relationship of the graphs is consistent with those in Fig. 4a–c. One (a), four (b), and sixteen (c) SCH histograms of amplitudes subclassified by one (a), two (b), and three (c) time-history steps, respectively
These results show a tendency of spatial clustering in the distribution of membrane potentials for at least three time-history steps. In addition, these results also suggest that the spatial clustering and self-similarity effects of the patterns of electrical stimulation decreased progressively over the history of stimulation.
Statistical analysis to evaluate the clustering property and self-similarity by spatio-temporal sequence
To quantify the clustering property and self-similarity for the hierarchical time-history effect, two indexes were measured (Fig. 6). The spatial clustering index increased progressively as the time-history steps increased (Fig. 6a). The index in sub-threshold group showed a rapid increase as a function of the time-history step; that of one time step was the smallest value, next, that of two time-steps rapidly increased to a significant value, and that of three time-steps reached a no significant level of random classification in pattern classification. On the other hand, the index of supra-threshold group tended to increase slowly; the indexes in one to three indexes were significantly smaller than the random classification level. From these results, a remarkable significant difference between sub- and supra-threshold groups appeared for three time-steps and one time-step. This shows that the spatial pattern classification properties were better in supra-threshold group than in sub-threshold group at that of three time-history steps.
Fig. 6.
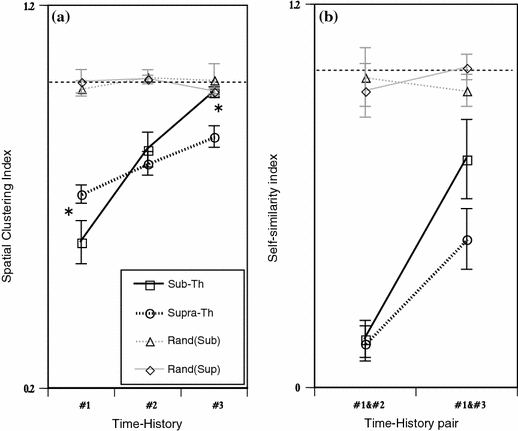
Quantitative analysis in spatial clustering and its self-similarity at the pattern of one, two, and three time-history steps. (a) Spatial clustering index at one, two, and three time-history steps under sub-threshold and supra-threshold conditions. The black solid and dotted lines indicate the spatial clustering index under sub-threshold (Sub-Th) and supra-threshold (Supra-Th) conditions, respectively. The gray solid and dotted lines indicate the randomized control for the sub-threshold (Rand(Sub)) and supra-threshold (Rand(Sup)) conditions, respectively. The X- and Y-axis indicate the time-history steps and the spatial clustering index, respectively. In X-axis, #0, #1, and #2 is defined as spatial clustering index classified by 1, 2, and 3 time-history steps, respectively. Error bars indicate standard errors of the mean *P < 0.05. (b) Self-similarity index of the neurons under sub-threshold and supra-threshold conditions. The X- and Y-axis indicate the pair of time-history steps and the self-similarity index, respectively. Error bars indicate standard errors of the mean *P < 0.05
Next, Fig. 6b show the self-similarity index. The index increased progressively as the time-history steps increased as similar as the spatial clustering index. The self-similarity indexes calculated by both groups were significantly smaller value to the random classification level. The difference between two groups was appeared in that of #1–#3, that of supra-one is better than that of sub- one in self-similarity properties. These results show that the range of #1–#3 time-history steps in both supra- and sub- threshold groups.
The dependency of time-history steps on NMDA receptors
To clarify the molecular mechanism underlying the clustering property’s dependence on input current intensity, we applied 50 μM D-APV (antagonist of NMDA type glutamate receptor) to the bath solutions, and measured the spatial clustering and self-similarity indices (Fig. 7). As shown in Fig. 7a, the statistically significant difference of the spatial clustering index for one and three time-history steps between sub- and supra-threshold groups disappeared when APV was applied. This result suggests that the two spatial clustering differences between sub- and supra-threshold groups were due to NMDA receptors. On the other hand, self-similarity with APV (Fig. 7b) was similar to that without APV (Fig. 6b). These results suggest that NMDA receptors do not contribute to the self-similarity in the time-history steps.
Fig. 7.
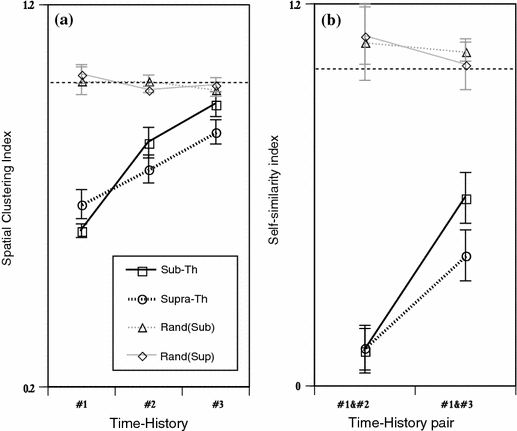
NMDA-receptor participation on spatial clustering and its self-similarity. The relationship of the graphs is consistent with those in Fig. 6a–b. Spatial clustering index (a) at one and two, and three time-history steps and (b) self-similarity index at the pairs of one and two, and one and three under 50 μM APV applied conditions were shown
Discussion
In this paper, in order to clarify how spatiotemporal sequence information from CA3 affects to the CA1 pyramidal neurons hierarchically, we sequentially applied one of four spatiotemporal stimulation patterns via two independent pathways, and the induced membrane potentials were recorded. The recorded responses were sequentially analyzed by using two measures; spatial clustering and its self-similarity. The spatial clustering index indicates a pattern classification measure for the spatial input pattern (“11”, “10”, “01”, and “00”) at each time-history step. Our results show significant clustering by two time-history steps for sub-threshold groups and by three for supra-threshold conditions. The self-similarity index is a measure of hierarchical self-similarity in time-history. Our results indicate that statistically significant self-similarity occurred between two time-history intervals for sub- and supra-threshold conditions. These results suggest that CA1 neurons have the potential to code the level of spatial clustering and its self-similarity.
Comparison of our experimental results with the proposition of Cantor coding by Tsuda and Kuroda
Tsuda (2001) and Tsuda and Kuroda (2001, 2004) reported the possibility of Cantor coding in hippocampal CA3–CA1 network. Cantor coding is an information coding scheme for temporal sequences of events. In the theoretical Cantor coding model, each individual neuron in CA1 receives infinite chaotic inputs from CA3. In the model simulation, Tsuda and Kuroda showed Cantor coding in the membrane potential of CA1 neurons.
Because of experimental limitations, we used a spatio-temporal random input (400 pulses) from CA3 to CA1 instead of infinite chaotic inputs to examine the spatial pattern classification and its self-similarity. In addition, the properties were maintained under two different stimulus conditions: weak and strong current stimulation (under sub- and supra-threshold conditions). Spatial clustering and its self-similarity were observed in one to three time history intervals. These results suggest that clustering and self-similarity are stable properties of CA1 neurons. These experimental results are very similar to the theoretical results of Tsuda and Kuroda (2001).
However, in the time-history dependency, the depth of the three time-step history may not seem enough to compare with the theoretical results. Let us consider the limitations of the experimental conditions. First, we only examined time-history dependency at one, two and three time-history steps. We did not examined four or more time history steps, because the number (400) of recording patterns is too small to analyze all the historical patterns. There is a possibility that significant spatial clustering will be observed at four or more time-history step using longer spatio-temporal input without fatigue. Second, in the current experiment, the averages of membranes were recorded from the cell body by using patch-clamp methods. We did not measure the local membrane potential of neurons. Localized membrane potentials may allow the system to classify even more patterns of input sequences (Tsukada et al. 1996; Tsukada and Pan 2005; Tsukada et al. 2007). By multi-unit recording, significant clustering properties at further time-history steps may be observed. Third, some modulation mechanism may influence the clustering property. One candidate is top-down information like attention (for example, through the cholinergic system as reported by Shinoe et al. (2005) to CA1 neurons.
Cellular mechanisms of spatial clustering and self-similarity properties
In our results, the properties were maintained under two different stimulus conditions, sub- and supra-threshold condition. A remarkable difference in spatial clustering between the two groups was observed at three time-history steps; not significant for the sub-threshold group, but significant for the supra-threshold group. This difference disappeared when APV was applied.
Neurons in CA1 receive two kinds of sequential information; information that can induce action potentials under supra-threshold condition, and information that cannot induce action potentials under sub-threshold condition. In general, induction of action potentials depends on the input sequence pattern. The action potential contributes to the membrane potential in dendrites by the back propagation which increases the probability of NMDA receptors opening, so that the induction of action potential influences the pattern classification. This is a possible mechanism for the pattern classification property that the supra-threshold group maintained in more time-history steps than the sub-threshold group. In this mechanism, then, NMDA receptors are involved in classification.
A cell mechanism of spatial clustering and its self-similarity
At excitatory synapses in the CA3–CA1 system, two glutamate receptors with distinctively different properties can be coactive: AMPA- and NMDA- type glutamate receptors, whose decay time and voltage dependency for opening are drastically different (Spruston et al. 1995; Andrasfalvy and Magee 2001). In general, NMDA receptor-mediated transmission plays an important role in long-term potentiation and the dynamic activity of neural networks (Daw et al. 1993; Schiller et al. 2000; Malenka and Bear 2004; Aihara et al. 2007). In our results, under NMDA receptor blockade conditions, the spatial clustering property became erratic and the classification in both groups disappeared. This finding suggests that NMDA receptors play a crucial role in producing the membrane potential dependency on the clustering property. NMDA-receptors are voltage-sensitive and have a long tail current of over 150 ms (Spruston et al. 1995; Aihara et al. 2000). In the present paper, electrical stimulation was applied at 30 ms intervals. It is reasonable that the opening of the NMDA receptor affected three successive patterns of electrical stimulation. In addition, weak input like in the sub-threshold condition could not induce the opening of NMDA channels because of insufficient depolarization. In our results, no significant clustering was observed at three time steps in the sequence. These results also support the hypothesis of participation of NMDA-R to time-history clustering.
However, self-similarity property was not influenced by blockade of NMDA receptors, because significant self-similarity was observed between one and three steps in the sequences under both sub- and supra-threshold conditions. Other voltage-gated channels such as Na+ and/or Ca2+ channels in dendrites may be related to these mechanisms.
Acknowledgments
We thank Jan Lauwereyns for English correction. This study was supported by Grant-in-Aid for a COE Fellow (Y. F) from the Ministry of Education, Culture, Sports, Science and Technology (MEXT) of Japan and by the 21st Century Center of Excellence Program (Integrative Human Science Program, Tamagawa Univ.), and Grant-in-Aid for Scientific Research (A) from the MEXT Japan (19200014) and Grant-in-Aid for Scientific Research on Priority Areas - Integrative Brain Science Project - from the MEXT of Japan (17021036, 70192838). One of the authors (I.T.) was supported by Grant-in-Aid for Scientific Research on Priority Areas - Integrative Brain Research - from the MEXT of Japan (18019002), and also supported by Grant-in-Aid for Scientific Research on Priority Areas – Understanding of Mobiligence - from the MEXT of Japan (18047001).
References
- Aihara T, Tsukada M, Crair MC, Shinomoto S (1997) Stimulus-dependent induction of long-term potentiation in CA1 area of the hippocampus: experiment and model. Hippocampus 7(4):416–426 [DOI] [PubMed]
- Aihara T, Abiru Y, Yamazaki Y, Watanabe H, Fukushia Y, Tsukada M (2007) The relation between spike-timing dependent plasticity and Ca2+ dynamics in the hippocampal CA1 network. Neuroscience 145:80–87 [DOI] [PubMed]
- Aihara T, Tsukada M, Matsuda H (2000) Two dynamic processes for the induction of long-term potentiation in hippocampal CA1 area. Biol Cybern 82:189–195 [DOI] [PubMed]
- Andrasfalvy BK, Magee JC (2001) Distance dependent increase in AMPA receptor number in the dendrites of adult hippocampal CA1 pyramidal neurons. J Neurosci 21(23):9151–9159 [DOI] [PMC free article] [PubMed]
- Buzsaki G, Draguhn A (2004) Neuronal oscillations in cortical networks. Science 304(5679):1926–1929 [DOI] [PubMed]
- Csicsvari J, Jamieson B, Wise KD, Buzsaki G (2003) Mechanisms of gamma oscillations in the hippocampus of the behaving rat. Neuron 37(2):311–322 [DOI] [PubMed]
- Daw N, Stein P, Fox K (1993) The role of NMDA receptors in information processing. Annu Rev Neurosci 16:207–222 [DOI] [PubMed]
- Magee JC (2001) Dendritic mechanisms of phase precession in hippocampal pyramidal neurons. J Neurophysiol 86(1):528–532 [DOI] [PubMed]
- Malenka RC, Bear MF (2004) LTP and LTD: an embarrassment of riches. Neuron 44(1):5–21 [DOI] [PubMed]
- Nakazawa K, Quirk MC, Chitwood RA, Watanabe M, Yeckel MF, Sun LD, Kato A, Carr CA, Johnston D, Wilson MA, Tonegawa S (2002) Requirement for hippocampal CA3 NMDA receptors in associative memory recall. Science 297:211–218 [DOI] [PMC free article] [PubMed]
- Schiller J, Major G, Koester HJ, Schiller Y (2000) NMDA spikes in basal dendrites of cortical pyramidal neurons. Nature 404:285–289 [DOI] [PubMed]
- Shinoe T, Matsui M, Taketo MM, Manabe T (2005) Modulation of synaptic plasticity by physiological activation of M1 muscarinic acetylcholine receptors in the mouse hippocampus. J Neurosci 25:11194–11200 [DOI] [PMC free article] [PubMed]
- Spruston N, Jonas P, Sakmann B (1995) Dendritic glutamate receptor channels in rat hippocampal CA3 and CA1 pyramidal. J Physiol 482(2):325–352 [DOI] [PMC free article] [PubMed]
- Tsuda I (1992) Dynamic link of memory– chaotic memory map in nonequilibrium neural networks. Neural Netw 5:313–326, 857
- Tsuda I (1996) A new type of self-organization associated with chaotic dynamics in neural networks. Int J Neural Syst 7:451–459 [DOI] [PubMed]
- Tsuda I (2001) Toward an interpretation of dynamic neural activity in terms of chaotic dynamical systems. Behav Brain Sci 24(5):793–847 [DOI] [PubMed]
- Tsuda I, Kuroda S (2001) Cantor coding in the hippocampus. Jpn J Indust Appl Math 18:249–258
- Tsuda I, Kuroda S (2004) A complex systems approach to an interpretation of dynamic brain activity II: does cantor coding provide a dynamic model for the formation of episodic memory. In: Erdi P et al (eds) Cortical dynamics, LNCS 3146. Springer-Verlag, pp 129–139
- Tsukada M, Pan X (2005) The spatiotemporal learning rule and its efficiency in separating spatiotemporal patterns. Biol Cybern 92:139–146 [DOI] [PubMed]
- Tsuda I, Yamaguchi A (1998) Singular-continuous nowhere differentiable attractors in neural systems. Neural Netw 11:927–937 [DOI] [PubMed]
- Tsuda I, Koerner E, Shimizu H (1987) Memory dynamics in asynchronous neural networks. Prog Theor Phys 78:51–71 [DOI]
- Tsukada M, Aihara T, Mizuno M, Kato H, Ito K (1994) Temporal pattern sensitivity of long-term potentiation in hippocampal CA1 neurons. Biol Cybern 70(6):495–503 [DOI] [PubMed]
- Tsukada M, Saito HA, Aihara T, Kato H (1996) Hippocampal LTP depends on spatial and temporal correlation of inputs. Neural Netw 9:1357–1365 [DOI] [PubMed]
- Tsukada M, Aihara T, Kobayashi Y, Shimazaki H (2005) Spatial analysis of spike-timing-dependent LTP and LTD in the CA1 area of hippocampal slices using optical imaging. Hippocampus 15(1):104–109 [DOI] [PubMed]
- Tsukada M, Yamazaki Y, Kojima H (2007) Interaction between the Spatio-Temporal Learning Rule (STLR) and Hebb type (HEBB) in single pyramidal cells in the hippocampal CA1 Area. Cognitive Neurodynamics 1(2):157–167 [DOI] [PMC free article] [PubMed]


