

Abstract
Objective
To describe the patterns (specifically comparing weekdays and weekends classified by intensities) of physical activity (PA) measured by accelerometry in adolescent girls.
Research Methods and Procedures
Healthy sixth grade girls (n = 1603), 11 to 12 years old, were randomly recruited from 36 schools participating in the Trial of Activity in Adolescent Girls. Age, ethnicity, socioeconomic status, weight, and height were taken. PA patterns were measured for 6 days using accelerometry.
Results
Adolescent girls spend most of their time in sedentary (52% to 57% of the day) and light activity (40% to 45% of the day) on weekdays and weekends. In all girls, total PA comprised 44.5% of the day (41.7% light, 2.2% moderate, and 0.7% vigorous) with sedentary activity comprising 55.4%. Moderate-to-vigorous PA (MVPA) was higher (p < 0.001) on weekdays than weekends in all girls, but MVPA was lower in at-risk of overweight + overweight girls (p < 0.001) on both weekdays and weekends compared with normal-weight girls.
Discussion
Adolescent girls are more active at moderate and vigorous intensities on weekdays than on weekends, and at-risk of overweight and those overweight spend less time engaging in MVPA than normal-weight girls.
Keywords: activity monitors, physical activity assessment, sedentary activity, accelerometry
Introduction
The prevalence of overweight in children and adolescents in the United States has increased (1), warranting evaluations of the causes and consequences of obesity and subsequent preventative interventions. One potential contributing factor to the rise in obesity is a decline in physical activity (PA).1 Research has documented low PA levels of adolescents (2), particularly in girls (3). Self-report studies of PA show that boys are more active than girls (4–6), girls are involved in less moderate-to-vigorous PA (MVPA) than boys (7,8), and girls participate in fewer sports than boys (2). To address the low activity levels of adolescent girls, a multisite intervention [Trial of Activity in Adolescent Girls (TAAG)] was developed. TAAG is testing the effects of a school- and community-based intervention designed to prevent the decline in PA in adolescent girls.
Patterns of PA in adolescents and, in particular, these patterns in relation to overweight, have not been explored adequately with activity measured using accelerometers, rather than self-report methods. Accelerometers can quantify activity for a single day, over several days, or over a combination of days (weekdays vs. weekends), more accurately than self-reports. The use of accelerometers or activity monitors has also become a promising method to differentiate among the various intensities of PA. One key advantage of accelerometry over self-reported activity is the removal of social desirability bias or the tendency to over-report PA. Another advantage is that accelerometers record activity without bias, recording light intensity activities of daily living just and moderate-to-vigorous activities performed in discrete bouts for the purpose of exercise.
The purpose of this paper is to describe the patterns of PA (specifically comparing weekdays and weekend days classified by intensities) of sixth grade girls enrolled in TAAG using the baseline accelerometer data before randomization and intervention. We also explored activity differences between normal-weight girls vs. at-risk of overweight and overweight girls.
Research Methods and Procedures
Participants
In the fall/winter of 2003, healthy sixth-grade girls, 11 to 12 years old, were recruited from 36 schools participating in the TAAG study at field centers (located in Baltimore, MD; Minneapolis/St. Paul, MN; Columbia, SC; Tucson, AZ; San Diego, CA; and New Orleans, LA) in collaboration with National Heart, Lung, and Blood Institute staff and coordinated by the University of North Carolina (Chapel Hill, NC). A random sample of 60 girls was targeted for recruitment from each of the six school centers. Any girl in the random sample who was unable to read and understand English, had been told by a physician to avoid PA, or had some other medical contraindications was considered ineligible and replaced with another eligible girl in the school. Each participating institution's Human Subjects Review Board approved the protocol. Consent to participate was obtained from one parent, and assent was obtained from each participant. Parental consent and student assent were obtained for 1721 of the 2160 eligible girls for an average recruitment rate of 80%.
Study Design
The main TAAG study design and analysis plan are presented elsewhere (9). Briefly, two cross-sectional samples of girls are studied, from the sixth grade and then, after the intervention, from the eighth grade. Schools from each of the six field centers were randomized to either intervention (n = 18 over six sites) or comparison schools (n = 18 over six sites) (9).
Measurements
Measurement coordinators from each field site were trained and certified at a centralized training held in November 2002. The local measurement staff at each field center were then trained and certified by the measurement coordinators. The TAAG Measurement Committee provided oversight for all measures. A previous substudy (10) evaluated the school level intraclass correlation, and it was recommended that to minimize the intraclass correlation between girls within a school, data should be collected over at least two different calendar weeks. In other words, if there were 60 girls to be measured in a given school, 30 of them were measured in one week with the other half measured in a different week.
Age, ethnicity, and socioeconomic status were obtained from the participant by self-report questionnaire. Following a standardized protocol, the participant's weight was measured twice to the nearest 0.1 kg on an electronic scale (model 770; Seca, Hamburg, Germany). Height was measured twice to the nearest 0.1 cm using a portable stadiometer (Shorr Height Measuring Board, Olney, MD). The height and weight values used in the analyses were the average of the two readings. Adolescents were classified as normal (<85th percentile of weight-for-height) or at-risk of overweight or overweight (≥85th percentile of weight-for-height) (11).
All Actigraph (model 7165; Manufacturing Technologies Inc. Health Systems, Shalimar, FL) accelerometers were checked at the Coordinating Center for similarity of basic functional condition using a standard laboratory shaker before being sent to each field site for subsequent use in this study. The monitors were initialized before placement on a standard belt provided by the study and worn on each girl's waist. The girls were instructed to wear the accelerometers for 7 complete days except when they were sleeping, bathing, or swimming. Staff returned to the school 1 week later to collect the accelerometers. Data were uploaded from the monitor to a portable computer after completion of the 7 days and then sent to the Coordinating Center. Activity counts were stored in 30-second time intervals. The 30-second epoch was chosen because children tend to do activities in short bursts and are more sporadic than adults.
Previously, we calibrated the Actigraph accelerometer against oxygen uptake by measuring activity counts and oxygen uptake simultaneously over a range of activity intensities in middle school girls (12). We documented intensity count thresholds for sedentary, light, moderate, and vigorous activity for adolescent girls using the accelerometer for both 0.5- and 1-minute intervals (12). Knowing these threshold counts allows us to differentiate the durations and intensities of PA. Actigraph counts were summarized into time per day spent in each of four activity intensities with thresholds for sedentary, light, moderate, and vigorous activity intensity ranges of <50, 51 to 1499, 1500 to 2599, and ≥2600 counts/30 seconds respectively, based on the findings provided by Treuth et al. (12). Occasional missing accelerometry data within a girl's 6-day period of monitoring were replaced by imputation based on the expectation maximization algorithm as described previously (13). Girls who failed to provide at least 1 day with a minimum of 6 hours of data were excluded from this analysis because the accuracy of imputation was deemed too imprecise. The lower sample size on weekdays reflects a monitoring protocol that included 4 rather than 5 weekdays on every girl. The day in which the monitor was put on the girl is missing in all cases. This occurred most often on Mondays and Tuesdays.
The parameters of greatest interest were functions of the average proportion of the day spent in each intensity level. This paper focuses particular attention on comparisons of proportions between weekdays and weekends and between girls who are normal weight, defined here as girls <85th percentile of weight-for-height, including underweight girls (2.92%) vs. at-risk of overweight + overweight girls, defined as ≥85th percentile of weight-for-height. Comparisons of the intensity and duration of PA according to site and race/ethnicity are presented elsewhere (14). A mixed model analysis was used to characterize the variation in the response yij (e.g., time spent in sedentary activity) for the ith individual on the jth day as a function of within-subject and between-subject fixed effects [e.g., type of day (weekday vs. weekend), weight status] and random effects that account for the homogeneity of activity patterns of girls in the same school and school patterns within the same site. Data were analyzed using the mixed procedure in the Statistical Analysis System (version 9.1) software package (SAS Institute, Inc., Cary, NC).
Results
Participant Characteristics
Of the 1721 girls who consented to participate in the study, 1603 girls provided the minimally acceptable amount of data necessary to represent weekend and weekday activity. Of the 1579 girls who eventually participated in the study, 699 were white, 351 were African-American, 344 Hispanics, 59 Asians, 12 Native American, and 114 were multiracial. The participant characteristics include mean (standard deviation) age of 11.9 ± 0.5 years, weight of 49.1 ± 14.1 kg, height of 152.4 ± 7.5 cm, and BMI of 20.9 ± 5.0 kg/m2 (range, 12.7 to 44.8 kg/m2). By definition, the normal-weight girls (n = 1043, 65%) had a lower BMI (mean ± standard error, 18.2 ± 0.11 kg/m2) than the at-risk of overweight + overweight girls (n = 534, 33%) (26.2 ± 0.14 kg/m2).
Comparisons of Activity Patterns by Weekday and Weekend and by Intensity (Sedentary, Light, Moderate, and Vigorous)
Table 1 includes minutes of activity and the percentage of the day spent at each of the various intensities by day of the week and for the combined weekdays and the weekends. Adolescent girls spent the majority of their time in sedentary (52% to 57% of the day) and light [40% to 45% of the day, activity <4.6 metabolic equivalents (METs)] activity on weekdays and weekends. In all girls, the proportion of time spent in total PA was 44.6% of the day (41.7% light, 2.2% moderate, and 0.7% vigorous), and the remainder was sedentary. MVPA was higher (p < 0.001) on weekdays than weekends in all girls.
Table 1.
Activity, expressed in minutes and percentage of the day, spent at each of the various intensities, by day of the week and for the weekdays and weekend, in adolescent girls
| N | Sedentary activity | Light activity | Moderate activity | Vigorous activity | Moderate + vigorous activity | ||
|---|---|---|---|---|---|---|---|
| Monday | 1401 | Minutes | 503 (78) | 343 (67) | 18 (10) | 5 (6) | 23 (15) |
| % | 58 (8) | 39 (7) | 2 (1) | 1 (1) | 3 (2) | ||
| Tuesday | 1024 | Minutes | 497 (78) | 345 (66) | 20 (11) | 6 (6) | 26 (16) |
| % | 57 (8) | 40 (7) | 2 (1) | 1 (1) | 3 (2) | ||
| Wednesday | 1151 | Minutes | 501 (80) | 348 (65) | 20 (11) | 6 (6) | 26 (16) |
| % | 57 (8) | 40 (7) | 2 (1) | 1 (1) | 3 (2) | ||
| Thursday | 1324 | Minutes | 495 (79) | 353 (69) | 20 (11) | 6 (6) | 27 (16) |
| % | 57 (8) | 40 (7) | 2 (1) | 1 (1) | 3 (2) | ||
| Friday | 1512 | Minutes | 506 (87) | 378 (77) | 21 (12) | 6 (7) | 28 (17) |
| % | 56 (8) | 41 (8) | 2 (1) | 1 (1) | 3 (2) | ||
| Saturday | 1603 | Minutes | 371 (116) | 321 (88) | 15 (12) | 5 (8) | 20 (18) |
| % | 52 (10) | 45 (9) | 2 (2) | 1 (1) | 3 (2) | ||
| Sunday | 1603 | Minutes | 346 (102) | 296 (78) | 13 (10) | 4 (6) | 17 (14) |
| % | 52 (9) | 45 (8) | 2 (1) | 1 (1) | 3 (2) | ||
| Weekday | 1603 | Minutes | 501 (70) | 354 (60) | 20 (9) | 6 (5) | 26 (13) |
| % | 57 (7) | 40 (6) | 2 (1) | 1 (1) | 3 (2) | ||
| Weekend | 1603 | Minutes | 359 (96) | 309 (73) | 14 (9) | 5 (6) | 18 (14) |
| % | 52 (8) | 45 (8) | 2 (1) | 1 (1) | 3 (2) |
Values reported as mean (standard deviation).
Table 2 provides the minutes of activity spent at each of the various intensities by girls at normal weight and at-risk of overweight combined with already overweight adolescent girls. Significant differences exist between the groups at all intensity levels (p < 0.05) but not in light activity (p = 0.058). Figure 1 illustrates the circadian rhythm to activity with bursts of activity in the morning and early afternoon on weekdays. These bursts of activity are not as evident on the weekends. MVPA was lower in at-risk of overweight + overweight girls (p < 0.001) on both weekdays and weekends compared with normal-weight girls, as shown in Figure 1. These differences are small but significant (26.9 ± 1.7 vs. 24.1 ± 1.8 minutes on weekdays and 19.2 ± 0.5 vs. 16.7 ± 0.7 minutes on the weekend in normal-weight and at-risk + overweight girls, respectively). The differences between these groups are distributed across the day. We explored the possibility of racial differences in the association between weight status and activity (i.e., race × weight status interaction), but no effects were found (data not shown).
Table 2.
Minutes of activity at each of the various intensities in normal-weight and at-risk-of-overweight and overweight adolescent girls
| Weekday | Weekend | |||||
|---|---|---|---|---|---|---|
| Intensity of activity | Normal-weight girls* (n = 1043) | At-risk and overweight girls† (n = 534) | p | Normal-weight girls* (n = 1043) | At-risk and overweight girls† (n = 534) | p |
| Sedentary | 495 (6.9) | 510 (7.2) | <0.001 | 356 (5.2) | 363 (6.0) | 0.156 |
| Light | 358 (5.6) | 349 (5.9) | 0.008 | 308 (4.1) | 309 (4.7) | 0.777 |
| Moderate | 20.4 (1.2) | 18.9 (1.3) | 0.002 | 14.2 (0.4) | 12.8 (0.5) | 0.005 |
| Vigorous | 6.4 (0.6) | 5.2 (0.6) | <0.001 | 5.0 (0.2) | 3.9 (0.3) | 0.001 |
| Moderate + vigorous | 26.9 (1.7) | 24.1 (1.8) | <0.001 | 19.2 (0.5) | 16.7 (0.7) | 0.001 |
| Hours monitored | 14.7 (0.4) | 14.7 (0.5) | 0.211 | 11.4 (0.1) | 11.5 (0.1) | 0.371 |
Values reported as mean (standard error) at each intensity level. Analysis controlled for site, school (site), and race.
Normal-weight defined as BMI < 85th percentile, including some (2.92%) underweight girls (<5th percentile).
At-risk and overweight defined as BMI ≥ 85th percentile.
Figure 1.
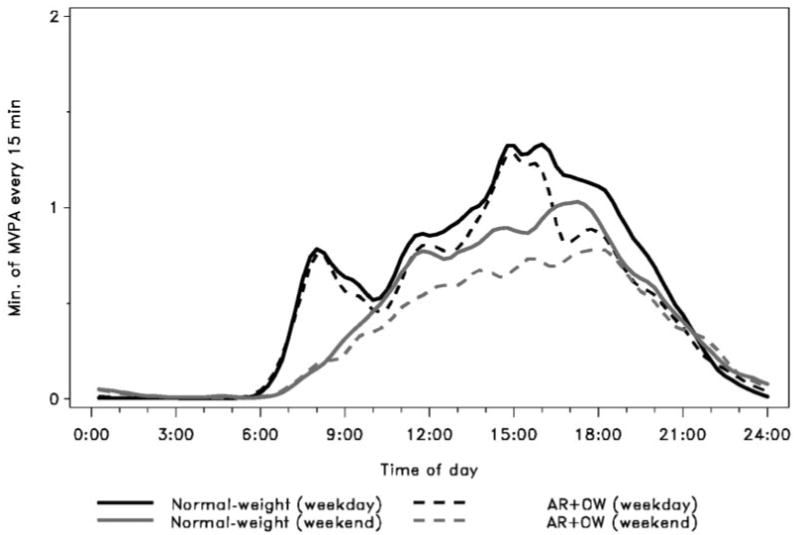
Weekday and weekend comparison of the minutes in MVPA in normal-weight and at-risk-of-overweight + overweight (AR + OW) adolescent girls. MVPA was defined as >3000 counts/min.
Discussion
The results of this study suggest that middle school girls, regardless of weight status, spend the majority of their days in sedentary and light PA. The amount of time spent in moderate-to-vigorous activity is slightly higher among normal-weight than overweight girls. There also appears to be a distinct circadian rhythm to activity that differs across weekdays vs. weekends. The bursts of activity on weekday mornings and in the early afternoons do not occur on weekends, and without these bursts, there is less MVPA on weekends than weekdays. The monitor was worn for less time on the weekend than on the weekdays, and to standardize this, the percentage of time spent at these various intensities was calculated. The observation remains that less MVPA occurs on weekends than on weekdays.
A few energy expenditure calculations reveal the significance of the 26 vs. 18 minutes for MVPA on weekday vs. weekend days, respectively. In a study of adolescent girls (15), the mean energy cost of a brisk walk was 19.1 kJ/min. The TAAG cutpoint for MVPA was based on the counts differentiating between a slow and brisk walk (12). The energy expenditure of activity performed just above this MVPA threshold for 26 min/d for 5 weekdays would translate to 2483 kJ (593 kcal). Likewise, for 18 min/d for 2 days, the energy expenditure for activity would be 688 kJ (164 kcal). On a per day comparison, this would be 28 (119 kcal/d) vs. 20 (82 kcal/d) kJ/d. Girls with no decrease in PA over the weekends would expend an extra 18 kJ/wk (74 kcal/wk), and this would be considered of a modest clinical significance.
The distribution of time spent in the four levels of activity intensity (sedentary, light, moderate, and vigorous) suggests multiple opportunities for intervention. There is little time spent in MVPA (18 to 28 minutes per day). Because energy expenditure per minute is higher in moderate-to-vigorous activity than lower intensity activities, even small increases in the percentage of time spent in these activities would be useful toward increasing total daily energy expenditure. By contrast, the time spent in sedentary vs. light PA presents another opportunity to increase total PA. Reducing time spent in sedentary activity should be a goal to increase total activity. Also, the majority of energy expended in total PA is from light intensity (which has a lower energy expenditure per minute) rather than moderate or vigorous activity, simply because of the greater amount of time spent in light activity (40% to 45% of the day). Therefore, increasing light activity and decreasing sedentary activity may be as useful as increasing higher intensity activity time when attempting to increase total daily energy expenditure.
Patterns of activity in children and adolescents have typically been characterized using self-report methods or direct observation. Self-report studies have quantified PA by intensity level and by participation in sport teams and exercise programs such as in the National Health and Nutrition Examination Study (16,17). The Youth Risk Behavior Survey used self-reports to quantify activity by intensity (moderate and vigorous activity) and included strength training, enrollment in physical education, and participation in sports programs (18). These methods offer the advantage of describing types of activities and, in some cases, the social and physical environments in which they occur.
Objective measures, such as heart rate monitoring and accelerometry, can provide more precise estimates of the duration and the intensity of activities. Certain accelerometers, however, are required to be removed during water activities and are limited in their ability to detect certain activities such as biking. In TAAG, both accelerometers and self-reports were used to capture intensity and duration of activity and the context of activity. The types of activities were reported by using a self-report measure, the 3-day PA recall. Briefly, the top 10 activities from most to least reported included travel by walking, doing household chores, walking for exercise, running/jogging, dance, basketball, and playing with younger children (19).
Several studies (20–22) have examined the time spent in different intensities using objective measures of activity. In the present study, the proportion of time spent in sedentary and light activity constituted the majority of the day in these adolescent girls. This makes sense because sleeping constitutes a large part of the day, and the girls were sitting in class much of the school days. The relatively lower amount of time spent in MVPA was also documented. In a review of 26 studies using heart rate monitoring, Epstein et al. (20) reported that youth of all ages attain ∼30 min/d at an intensity of 50% or more of heart rate reserve. This would be comparable to our adolescent girls, where the MVPA during the week averaged 26 min/d. However, during the weekend, MVPA averaged only 18 min/d, which is lower than values previously reported (20). A study (21) of 9- and 15-year-old children and adolescents reported the time spent in MVPA (including at least 1 weekend day) measured by accelerometry was 73 ± 32 min/d in 15-year-old girls, suggesting girls in the present study were less active. However, moderate intensity was defined using a very different threshold of activity (MVPA defined as >1500 counts/min for 15-year olds, ∼3 METs) and would account for most of this large difference between MVPA in adolescent girls in the United States vs. Europe. Also, this prior study did not provide separate weekday vs. weekend activity. Another investigation (22) of middle school-aged boys and girls reported measures of all of the intensities using the TriTrac accelerometer. In girls, sedentary activity accounted for the majority of the day (74%), with light (18%), moderate (6.9%), and vigorous (0.5%) activity as the remainder. Clearly, sedentary activity and light activity are the dominant intensities of the day for many adolescent girls. The different accelerometer instruments and corresponding thresholds and much smaller sample size (n = 17) could contribute to the different findings. Another study (23) using the Actiwatch accelerometer reported the time spent in the various intensities as a percentage of the awake period of the day in 81 middle school boys and girls combined. The levels are more comparable to the present study with 51% sedentary, 43% light, 5% moderate, and 0.4% vigorous (23). Thus, the U.S. studies give relatively comparable information on the amount of time spent in the various activities.
Comparisons across the studies for weekdays vs. weekends are somewhat difficult because the subject samples and measurement tools differ, as well as the expression of the activity data. Studies (24–26) have reported differences in activity on weekdays and weekends using self-report in children. Activity in one study (25) as measured by heart rate monitoring (expressed as percentage of the day active) reported slightly higher means on weekdays than on weekends at either moderate or vigorous intensity in young girls. In a longitudinal study (26) of these same girls 8 to 10 years old, no differences were observed in weekdays vs. weekends. In the present study, differences in MVPA between weekdays and weekends were observed in 11- to 12-year-old girls. This has implications in terms of the age to target individuals for various intervention strategies that might focus on altering weekend behavior. The adolescent girls in the present study may obtain the higher intensity activity before, during, or after school, with lower intensity activities on the weekend. The differences noted may be due, in part, to greater television viewing time on weekends than weekdays. In the Eating and Activity Questionnaire Trial (Project EAST) (24), middle school students self-reported 42 additional minutes of television viewing on weekend days compared with weekdays.
Comparing the activity by weight status revealed a lower MVPA on the weekdays and weekends in the at-risk and overweight girls than the normal-weight girls. These findings generally concur with self-report studies from the 1999 Youth Risk Behavior Survey, and from the National Health and Nutrition Examination Study in which adolescent girls and young adults who were overweight or at-risk of overweight were less likely to be physically active than normal-weight participants (16–18). One study (27) that measured activity by accelerometry reported that overweight adolescents were less active than non-overweight adolescents. The overweight adolescents spent 15.6 fewer minutes per day in MVPA, defined using a cut-off point of 3 METs (27). The source of the activity differences between normal vs. at-risk plus overweight adolescents are most apparent in Figure 1, which shows the differences distributed throughout the day. There is less MVPA among at-risk plus overweight girls compared with normal-weight girls in both cases. Early mornings, evenings, and school days are very similar between the two groups. Further, relative differences in the minutes spent in each intensity category were much smaller for sedentary activity (3% greater among at-risk plus overweight girls) and light-intensity activity (2% greater among normal weight) compared with 8% and 20% for moderate- and vigorous-intensity activities, respectively. This suggests that interventions designed to increase MVPA on weekday afternoons (after school) and/or weekends could make a modest impact on total PA among overweight girls.
In conclusion, adolescent girls are more active at moderate and vigorous intensity levels on weekdays than on the weekend, and girls who are at-risk of overweight and overweight have the lowest values of these levels of activity on weekdays and weekends. A general intervention approach for all girls could be to increase total daily activity in a healthful direction by reducing sedentary time, and this would have modest effects on improving energy balance.
Acknowledgments
We thank the girls who participated in the study; the project coordinators for participant recruitment; and the members of the TAAG Steering Committee, including: Deborah Rohm-Young (University of Maryland, College Park, MD), Leslie Lytle (University of Minnesota, St. Paul, MN), Timothy Lohman (University of Arizona, Tucson, AZ), June Stevens (University of North Carolina, Chapel Hill, NC), and Charlotte Pratt (National Heart, Lung, and Blood Institute, Bethesda, MD). M.S.T. conceptualized and proposed the manuscript and analyses for the paper, participated in the analysis plan, and led the writing and interpretation of the findings. D.J.C. supervised and completed the analyses and assisted with the interpretation of the results and the writing and editing drafts of the manuscript. K.H.S. assisted with the data collection, content, interpretation of the findings, and the writing of the manuscript. R.R.P. participated in conceptualization of the paper, oversight of data collection, and editing drafts of the manuscript. J.P.E. participated in conceptualization of the paper, the analysis plan, and editing drafts of the manuscript. R.G.M. assisted with quality control procedures, training of data collectors for the accelerometry protocol, and editing of the manuscript. R.M.B. assisted with the content and editing of the manuscript. S.Y. participated on the measurement committee and assisted with editing of the manuscript. L.S.W. participated in conceptualization of the paper, the analysis plan, and editing drafts of the manuscript. This research was funded by the National Heart, Lung, and Blood Institute (Grants U01HL66858, U01HL66857, U01HL66845, U01HL66856, U01HL66855, U01HL66853, and U01HL66852).
Footnotes
Nonstandard abbreviations: PA, physical activity; MVPA, moderate-to-vigorous PA; TAAG, Trial of Activity in Adolescent Girls; MET, metabolic equivalent.
References
- 1.Ogden CL, Flegal KM, Carroll MD, Johnson CL. Prevalence and trends in overweight among US children and adolescents, 1999–2000. JAMA. 2002;288:1728–32. doi: 10.1001/jama.288.14.1728. [DOI] [PubMed] [Google Scholar]
- 2.Centers for Disease Control and Prevention. Guidelines for school and community programs to promote lifelong physical activity among young people. MMWR Morb Mortal Wkly Rep. 1997;46:1–32. [PubMed] [Google Scholar]
- 3.Kimm SYS, Glynn NW, Kriska AA, et al. Decline in physical activity in black and white girls during adolescence. N Engl J Med. 2002;347:709–15. doi: 10.1056/NEJMoa003277. [DOI] [PubMed] [Google Scholar]
- 4.Trost SG, Pate RR, Sallis JF, et al. Age and gender differences in objectively measures physical activity in youth. Med Sci Sports Exerc. 2002;34:350–5. doi: 10.1097/00005768-200202000-00025. [DOI] [PubMed] [Google Scholar]
- 5.Caspersen CJ, Pereria MA, Curran KM. Changes in physical activity patterns in the United States, by sex and cross-sectional age. Med Sci Sports Exerc. 2000;32:1601–9. doi: 10.1097/00005768-200009000-00013. [DOI] [PubMed] [Google Scholar]
- 6.Heath GW, Pratt M, Warren CW, Kann L. Physical activity patterns in American high school students: results from the 1990 Youth Risk Behavior Survey. Arch Pediatr Adolesc Med. 1994;148:1131–6. doi: 10.1001/archpedi.1994.02170110017003. [DOI] [PubMed] [Google Scholar]
- 7.Sallis JF, Prochaska JJ, Taylor WC. A review of correlates of physical activity of children and adolescents. Med Sci Sports Exerc. 2000;32:963–75. doi: 10.1097/00005768-200005000-00014. [DOI] [PubMed] [Google Scholar]
- 8.United States Department of Health and Human Services. Physical Activity and Health: A Report of the Surgeon General. Atlanta, GA: Center for Disease Control and Prevention; 1996. [Google Scholar]
- 9.Stevens J, Murray DM, Catellier DJ, et al. Trial of Activity in Adolescent Girls (TAAG) Contemp Clin Trials. 2005;26:223–33. doi: 10.1016/j.cct.2004.12.011. [DOI] [PMC free article] [PubMed] [Google Scholar]
- 10.Murray D, Catellier D, Hannan P, et al. School-level intraclass correlation for physical activity in adolescent girls: Estimates and Applications. Med Sci Sports Exerc. 2004;36:876–82. doi: 10.1249/01.mss.0000126806.72453.1c. [DOI] [PMC free article] [PubMed] [Google Scholar]
- 11.Center for Disease Control and Prevention. Youth Risk Behavior Surveillance: United States, 2003. MMWR Morb Mortal Wkly Rep. 2004;53:1–96. [PubMed] [Google Scholar]
- 12.Treuth MS, Schmitz K, Catellier DJ, et al. Defining accelerometer thresholds for physical activity intensities in adolescent girls. Med Sci Sports Exerc. 2004;36:1259–66. [PMC free article] [PubMed] [Google Scholar]
- 13.Catellier D, Murray PM, Hanna PJ. Imputation of missing data when measuring physical activity by accelerometry. Med Sci Sports Exerc. 2005:555–62. doi: 10.1249/01.mss.0000185651.59486.4e. [DOI] [PMC free article] [PubMed] [Google Scholar]
- 14.Pate RR, Stevens J, Pratt C, et al. Objectively measured physical activity in 6th grade girls. Arch Pediatr Adolesc Med. 2006;160:1262–8. doi: 10.1001/archpedi.160.12.1262. [DOI] [PMC free article] [PubMed] [Google Scholar]
- 15.Schmitz K, Treuth MS, McMurray R, et al. Predicting energy expenditure from accelerometry counts in adolescent girls. Med Sci Sport Exerc. 2005;37:155–61. doi: 10.1249/01.MSS.0000150084.97823.F7. [DOI] [PMC free article] [PubMed] [Google Scholar]
- 16.Dowda M, Ainsworth BE, Addy CL, Saunders R, Riner W. Correlates of physical activity among U.S. young adults, 18 to 30 years of age, from NHANES III. Ann Behav Med. 2003;25:15–23. doi: 10.1207/S15324796ABM2601_03. [DOI] [PubMed] [Google Scholar]
- 17.Dowda M, Ainsworth BE, Addy CL, Saunders R, Riner W. Environmental influences, physical activity, and weight status in 8- to 16-year-olds. Arch Pediatr Adolesc Med. 2001;155:711–7. doi: 10.1001/archpedi.155.6.711. [DOI] [PubMed] [Google Scholar]
- 18.Levin S, Lowry R, Brown DR, Dietz WH. Physical activity and body mass index among US adolescents: Youth Risk Behavior Survey, 1999. Arch Pediatr Adolesc Med. 2003;157:816–20. doi: 10.1001/archpedi.157.8.816. [DOI] [PubMed] [Google Scholar]
- 19.Saksvig BI, Catellier DJ, Pfeiffer K, et al. Travel by walking before and after school increases physical activity among adolescent girls. Arch Pediatr Adolesc Med. 2007;161:153–8. doi: 10.1001/archpedi.161.2.153. [DOI] [PMC free article] [PubMed] [Google Scholar]
- 20.Epstein LH, Paluch RA, Kalakanis LE, Goldfield GS, Cerny FJ, Roemmich JN. How much activity do youth get? A quantitative review of heart-rate measured activity. Pediatrics. 2001;108:1–10. doi: 10.1542/peds.108.3.e44. [DOI] [PubMed] [Google Scholar]
- 21.Riddoch CJ, Andersen LB, Wedderkopp N, et al. Physical activity levels and patterns of 9- and 15-yr-old European children. Med Sci Sports Exerc. 2004;36:86–92. doi: 10.1249/01.MSS.0000106174.43932.92. [DOI] [PubMed] [Google Scholar]
- 22.Cradock AL, Wiecha LJ, Peterson KE, Sobol AM, Colditz GA, Gortmaker SL. Youth recall and TriTrac accelerometer estimates of physical activity levels. Med Sci Sports Exerc. 2004;36:525–32. doi: 10.1249/01.mss.0000117112.76067.d3. [DOI] [PubMed] [Google Scholar]
- 23.Treuth MS, Hou N, Young DR, Maynard LM. Accelerometry measured activity or sedentary time and overweight in rural boys and girls. Obes Res. 2005;13:1606–14. doi: 10.1038/oby.2005.197. [DOI] [PubMed] [Google Scholar]
- 24.Schmitz K, Harnack L, Fulton J, et al. Reliability and validity of a brief tool to assess television and computer use in middle school children. J School Health. 2004;74:370–7. doi: 10.1111/j.1746-1561.2004.tb06632.x. [DOI] [PubMed] [Google Scholar]
- 25.Treuth MS, Butte NF, Puyau M, Adolph A. Relations of parental obesity status to physical activity and fitness of prepubertal girls. Pediatrics. 2000;106:1–8. doi: 10.1542/peds.106.4.e49. [DOI] [PubMed] [Google Scholar]
- 26.Treuth MS, Butte NF, Adolph AL, Puyau MR. A longitudinal study of fitness and activity in girls predisposed to obesity. Med Sci Sports Exerc. 2004;36:198–204. doi: 10.1249/01.MSS.0000113666.98463.B0. [DOI] [PubMed] [Google Scholar]
- 27.Trost SG, Kerr LM, Ward DS, Pate RR. Physical activity and determinants of physical activity in obese and non-obese children. Int J Obes Relat Metab Disord. 2001;25:822–9. doi: 10.1038/sj.ijo.0801621. [DOI] [PubMed] [Google Scholar]