

Abstract
Electrical stimulation over human muscle can generate force directly by activation of motor axons and indirectly by ‘reflex’ recruitment of spinal motoneurones. These experiments were designed to define the properties of the centrally generated ‘reflex’ force, including the optimal stimulus conditions for producing it in tibialis anterior (TA) and triceps surae (TS), and its interaction with volition. Subjects (n = 21) were seated with their foot strapped to an isometric myograph. Surface EMG was recorded from TS and TA. High-frequency electrical stimulation (100 Hz) of TS and TA with wide pulse widths (1 ms) was most effective to evoke the sustained centrally generated forces. The maximal force evoked by this mechanism during stimulation of TA for 40 s was ∼42 % of that produced by a maximal voluntary contraction. For both muscle groups, ramp increases and decreases in stimulus frequency (from ∼4 to 100 Hz and back to 4 Hz over 6 s) resulted in marked hysteresis in the force-frequency plot. After a single ‘burst’ of 100 Hz stimulation during prolonged stimulation at 25 Hz, force remained elevated. Repeated bursts often generated progressively larger force increments. These behaviours were abolished by an anaesthetic nerve block proximal to the stimulation site, confirming the central origin for the ‘extra’ force. After a brief voluntary contraction was performed during 25 Hz stimulation, force remained elevated, and this showed some gradation with voluntary contraction amplitude. Sometimes voluntary contractions alone initiated the sustained central motor output. Involuntary contractions often persisted for many seconds after electrical stimulation ceased. These were not terminated by brief inhibitory inputs to the active motoneurones but could be stopped by the voluntary command to ‘relax completely’. Overall, these centrally generated contractions are consistent with activation of plateau potentials in motoneurones innervating the ankle dorsiflexors and plantarflexors. Large forces can be produced through this mechanism. The interaction with volitional drives suggests that plateau behaviour may contribute significantly to the normal output of human motoneurones.
Motoneurones comprise the ‘final common pathway’ (Sherrington, 1906) between the central nervous system and muscle and, as such, occupy a strategic place in motor control. For many years, it was thought that motoneurones followed ‘the algebraical sum of the opposed influences of excitation and inhibition convergent upon’ them (Creed et al. 1932). Accordingly, they exhibited linear input-output relationships in decerebrate or deeply anaesthetized preparations (Creed et al. 1932; Eccles, 1957; Granit et al. 1966; see also Binder et al. 1996) and were believed to be passive ‘integrators’ in determining motor output. However, it is now clear that specific neuromodulators (Hounsgaard et al. 1984, 1988; Conway et al. 1988; Lee & Heckman, 1996, 2000) and neurotransmitters (Russo & Hounsgaard, 1997; Svirskis & Hounsgaard, 1998) can dramatically alter the way motoneurones respond to a given input (for recent reviews see Delgado-Lezama & Hounsgaard, 1999; Heckman & Lee, 1999; Hornby et al. 2000). This behaviour depends on the development of persistent inward currents (Schwindt & Crill, 1980; Hounsgaard et al. 1988; Lee & Heckman, 1996, 2001) mediated predominantly by dendritic calcium channels (Hounsgaard & Kiehn, 1993; Lee & Heckman, 1996). These currents cause a sustained depolarization of the motoneuronal membrane (i.e. a plateau potential), and their threshold and strength determine the extent by which synaptic inputs are ‘amplified’ (Bennett et al. 1998a,b; Lee & Heckman, 2000; Prather et al. 2001). In the extreme case, ‘fully bistable’ motoneurones can remain active for many seconds following a transient input (Hounsgaard et al. 1984, 1988; Crone et al. 1988; Lee & Heckman, 1996; Heckman & Lee, 1999).
Whether plateau potentials comprise part of the normal neural control of movement has been difficult to demonstrate. Close inspection of motor unit discharge patterns recorded during voluntary contractions in rats (Eken & Kiehn, 1989; Gorassini et al. 1999) and humans (Gorassini et al. 2000) reveals behaviour that is consistent with a contribution from plateau activation. There is evidence that plateau potentials can be induced experimentally in human motoneurones. This has been suggested to explain the tonic vibration reflexes (TVR) evoked by periods of tendon vibration (Crone et al. 1988; Kiehn & Eken, 1997; Gorassini et al. 1998; see also Stuart et al. 1986). Recently, large reflex-like force increments were produced by electrical stimulation over human triceps surae and attributed to the triggering of plateau potentials in motoneurones (Collins et al. 2001b). These tonic, electrically evoked contractions were demonstrable in subjects who were asleep and in patients with spinal cord transection, and thus were not due to inadvertent volitional drive to the motoneurones (Collins et al. 2001b). The present experiments were undertaken in a large group of subjects to determine the optimal stimulus parameters for evoking these plateau-like phenomena, whether they could be triggered in tibialis anterior (TA) as well as triceps surae (TS) and whether peripheral afferent inputs and descending volitional drives can trigger the behaviour. It is concluded that the tendency to adopt a plateau-like discharge is not confined to specific extensor muscles and that this type of discharge may be a natural and fundamental pattern of behaviour during normal movement. Abstracts of these studies have been published previously (Collins et al. 2001a; Gandevia et al. 2001).
METHODS
Studies were performed on 21 able-bodied subjects (14 males, 7 females), aged 19–56 years. All were volunteers and participated with informed written consent. No subjects reported a history of neuromuscular disease. The experiments were in accordance with the Declaration of Helsinki and were approved by the University of New South Wales Human Research Ethics Committee. Each experimental session lasted 1–3 h.
Subjects sat with the right hip, knee and ankle comfortably flexed (90–110 deg) and with the right foot strapped to an isometric myograph to record force about the ankle joint (Fig. 1A). These knee positions are probably short of the optimal angle for force generation for the gastrocnemii; thus much of the force recorded may derive from contraction of soleus (Sol). The knee was supported to reduce movement during the muscle stimulation. For each subject, maximal ankle plantarflexion and dorsiflexion forces were measured during several maximal voluntary contractions (MVCs) lasting 2–4 s and the highest value was recorded. During an experiment, subjects were instructed to ignore the muscle stimulation as far as was possible and to remain relaxed, and were encouraged to read. Subjects were frequently reminded to remain relaxed and occasionally were asked to concentrate and ‘relax completely’. They received no feedback about their performance during the experiment. Most subjects were completely naive to the hypotheses being tested.
Figure 1. Experimental protocol.
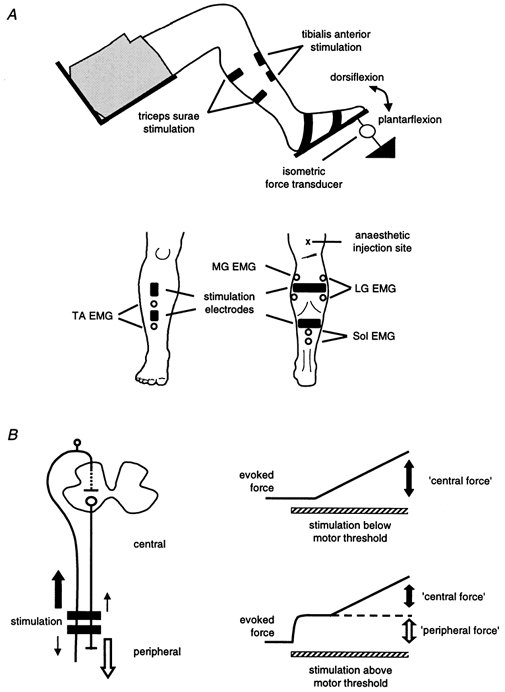
A, diagram of the experimental set-up showing the position of the leg and location of the stimulating and recording electrodes. Also shown is the site for anaesthetic injection over the posterior tibial nerve. B, schematic representation of the origin of the evoked forces. The left-hand panel shows the orthodromic activation of motor (large open arrow) and sensory (large filled arrow) axons under the stimulating electrodes. The right-hand panel shows the two corresponding components of the evoked force defined as the peripheral (large open arrow) and central (large filled arrows) force. The small arrows in the left-hand panel show that antidromic volleys will also be present.
Muscle stimulation
Surface stimulating electrodes were secured to the skin over TA and TS with the cathode proximal (Fig. 1A). For TA, flexible plate electrodes (3–6 cm × 3.5 cm) were placed 4–6 cm apart over the proximal and distal portions of the muscle. For TS, the cathode (10–18 cm × 3.5 cm) was positioned approximately midway across the medial (MG) and lateral (LG) heads of the gastrocnemius, ∼10–15 cm distal to the crease in the popliteal fossa. The anode (8–12 cm × 3.5 cm) was placed below MG and LG over Sol, ∼10–15 cm below the cathode. In some cases these positions were altered slightly to minimize cramp-like sensations or stimulation of cutaneous nerves.
The stimuli consisted of rectangular pulses (width, 1 ms unless otherwise specified) delivered at constant intensity using either a constant-current or a constant-voltage source. The stimulation frequencies were controlled by computer. Stimulus intensity was adjusted based on the peak force during the twitch-like contraction evoked by a brief ‘test’ train of five stimuli delivered at 100 Hz. Intensities ranged from below motor threshold, at which the test train produced no measurable force, to that at which the test train evoked a response of ∼8 % MVC. Typically, the stimulation was set so that the response to the test train was ∼5 % MVC. However, stimulus intensity was lowered if subjects reported that it was uncomfortable due to radiating cutaneous or local cramp-like sensations. This occurred rarely. Subjects did not find the stimulation painful and occasionally slept during the sessions, which lasted up to 3 h. Test trains were delivered regularly throughout an experiment to ensure stability of stimulation.
Definitions
The evoked force during these experiments had a peripheral and a central component (Collins et al. 2001b; see Fig. 1B). The peripheral component arises from the orthodromic motor volley evoked by direct activation of the motor axons beneath the stimulating electrodes (large open arrow in Fig. 1B on the left). The central component arises from the recruitment of spinal motoneurones due to the orthodromic volley resulting from the stimulation of sensory axons (large filled arrow in Fig. 1B). The small arrows in Fig. 1B indicate the direction of propagation of antidromic volleys in the motor and sensory axons.
EMG recording
Surface EMG was recorded using electrodes of 1 cm diameter. In early experiments, overall TS activity was recorded from an electrode positioned between MG and LG and with the other distally over Sol. Subsequently, EMG was recorded from pairs of electrodes placed over two to four of the following mucles: MG, LG, Sol and TA, at the approximate locations shown in Fig. 1A. The signals were amplified × 1000 and filtered (bandpass 16 Hz to 1 kHz).
Pulse width and stimulus frequency
The effects of pulse width and stimulus frequency on the amplitude of the evoked force were investigated in six subjects. Subjects received five trains of 100 Hz stimulation for 7 s at each of three pulse widths (0.05, 0.25 and 1.0 ms). For stimulus frequency, 1 ms pulses were delivered at 25, 100 and 200 Hz for 7 s. The order of each condition was randomized between subjects. Stimulus intensity was adjusted as needed between stimulus conditions such that the response to a test train, under those stimulus conditions (i.e. 0.05, 0.25 and 1 ms or 25, 100 and 200 Hz) was ∼5 % MVC. This was done to account for the strength-duration properties of motor axons and the force-frequency properties of muscle.
Stimulation protocols
Various patterns of stimulation were delivered at constant intensity. (1) Constant-frequency stimulation with continuous stimulation at 100 Hz for 7 s or more. (2) Variable-frequency stimulation: (a) triangular-shaped stimulus profiles with frequency ‘ramps’ linearly increasing from ∼4 to 100 Hz and then decreasing to ∼4 Hz in 6 s; or (b) ‘bursts’ of stimulation at 100 Hz. Single burst protocol: 25 Hz for 2 s, 100 Hz for 2 s followed by 3 s at 25 Hz. Multiple burst protocol: three to five successive periods of stimulation alternating between 25 Hz for 2 s and 100 Hz for 2 s ending with at least 3 s at 25 Hz. Control trials involved stimulation for the same duration at 25 Hz only. Stimulus intensity was usually set to produce 5 % maximal voluntary force during a test train but, if clear force increments were observed during the control stimulation at 25 Hz, the intensity was lowered until the force profile followed that expected for a purely peripheral mechanism. For each protocol there was at least 20 s between successive stimulus trains.
Voluntary contractions
The interaction between voluntary contractions and the extra forces was investigated in five subjects. Each subject received 20 trains of stimulation at 25 Hz for 14 s (5 control, 5 for each of three contraction intensities) with > 45 s between successive stimulus trains. For the control trials subjects remained relaxed. For the ‘contraction’ trials, subjects performed either a weak (∼5 % MVC), medium (∼10 % MVC) or strong (∼25 % MVC) contraction during the stimulation. On instruction from the experimenter, subjects began the voluntary contraction ∼2 s after stimulus onset, maintained it for ∼2 s and then relaxed. They were instructed to remain relaxed except during the requested voluntary contraction. Practice trials familiarized subjects with the task. If the force clearly increased throughout the control stimulation, the intensity was lowered for all the trials to a level at which the control force profile became flat. The order of the control (25 Hz only) and test trials (25 Hz with a voluntary contraction) was randomized.
Superficial peroneal nerve stimulation
In four subjects brief stimulus trains were delivered to the superficial peroneal (SP) nerve at the ankle during sustained involuntary activity that persisted after the muscle stimulation was turned off. The stimulation (trains of 5 pulses at 300 Hz, 1 ms pulse width) was delivered at four to six times perceptual threshold, and this evoked brief radiating parasthesiae perceived as strong to moderately painful. Subjects received eight to thirty stimulus trains to the SP nerve.
Nerve blocks
Four nerve blocks were performed in two subjects. The tibial nerve was blocked in the popliteal fossa (n = 2), and the common peroneal nerve was blocked at the fibular head (n = 1) and in the popliteal fossa (n = 1). The relevant nerves were localized by subcutaneous stimulation through a ‘monopolar’ electrode to find the site with the lowest threshold for a motor response. The nerve was then blocked with 10–15 ml of 2 % lignocaine with adrenaline delivered at this site. The blocks were monitored clinically and by electrical stimulation. All blocks were complete except one tibial block in which maximal plantar flexion force declined to < 10 % control and the soleus H reflex was abolished. During the incomplete block it is possible that a few large-diameter afferents conducted through the blocked region of the nerve. Some data from the tibial nerve blocks have been reported previously (Collins et al. 2001b).
Data acquisition and analysis
Data were digitized (force, 100 Hz; EMG, 1 kHz) using Spike2 software, and stored on a microcomputer for later analysis. Forces are expressed relative to each subject's MVC. To normalize forces across subjects, data are also expressed relative to the force 0.5 s after the onset of stimulus trains.
Statistics
Student's t test or repeated measures analysis of variance (ANOVA) was used to identify significant differences.
RESULTS
In these experiments ankle torque was measured under isometric conditions while electrical stimulation at non-painful intensities was applied through the skin over the muscles which plantarflex and dorsiflex the ankle. Subjects remained relaxed throughout the stimulation.
Examples of the forces recorded during constant intensity stimulation at 100 Hz (1 ms pulses) are shown in Fig. 2, for TA (Fig. 2A-C) and TS (Fig. 2D-F). When the stimulation was delivered below motor threshold (see Methods), force began to increase ∼1.5–5 s after stimulus onset and continued for 2–10 s until it reached ∼2–10 % MVC (Fig. 2A and D). Although these contractions could be produced by stimuli below motor threshold, they were more readily evoked by higher stimulus intensities. For most experiments the stimulus intensity was adjusted so that the test train of five stimuli at 100 Hz evoked a peak force of ∼5 % MVC. Mean forces recorded during 7 s of stimulation at this intensity are shown in Fig. 2B and E for individual subjects and across a group of 16 subjects in Fig. 2C and F. Across the group, over the final 6.5 s of the stimulation, the force increased 1.6-fold for TA stimulation (range, 1.1–3.4-fold) and 1.9-fold for TS (range, 1.2‐3.0-fold). The force increments during the 7 s stimulation varied between subjects but were relatively consistent in individual subjects both within and between experimental sessions.
Figure 2. Forces evoked by 100 Hz stimulation over tibialis anterior (A-C) and triceps surae (D-F).
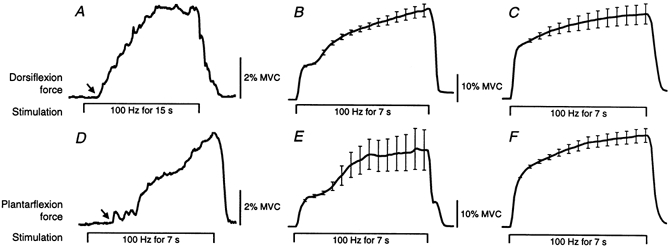
A and D show individual responses to stimulation below motor threshold. The arrows mark the abrupt onset of force ∼1.5 s after stimulus onset. B and E show the mean responses (n = 5) from single subjects to stimuli delivered at an intensity which evoked a peak force of ∼5 % MVC in response to ‘test’ trains (5 pulses at 100 Hz). C and F show the mean forces across a group of 16 subjects. Data were normalized to the force 0.5 s after stimulus onset for each subject. Error bars (± s.e.m.) are shown at 0.5 s intervals during the stimulation. Stimulus timing is given below force traces.
Optimal stimulation parameters
The effects of different pulse widths and stimulus frequencies on the evoked force were tested in six subjects to determine the best stimulus parameters to trigger these involuntary contractions. Stimulus intensity was adjusted so that the peak forces evoked by the test train were similar, regardless of the pulse width or stimulus frequency (see Methods). Mean plantarflexion forces recorded during stimulation over TS using three different pulse widths (0.05, 0.25 and 1 ms) are shown for a single subject in Fig. 3A and for a group of six subjects in Fig. 3B. For TS stimulation, the 1 ms pulses evoked significantly more force at the end of the 7 s train than when 50 μs pulses were used. However, there were no significant differences in force between the different pulse widths for stimulation over TA (not illustrated). Using a 1 ms pulse width, the forces at the end of 7 s trains at 100 and 200 Hz were significantly greater than when the stimulation was delivered at 25 Hz (Fig. 3C and D). The same result was obtained for TA stimulation (not illustrated). The lower forces recorded in some subjects during stimulation at 200 Hz than at 100 Hz may have been due to the development of neuromuscular block and greater activity-dependent hyperpolarization of the stimulated axons with the 200 Hz stimulation.
Figure 3. Plantarflexion forces evoked by stimulation over triceps surae using different pulse widths (A and B) and stimulus frequencies (C and D).
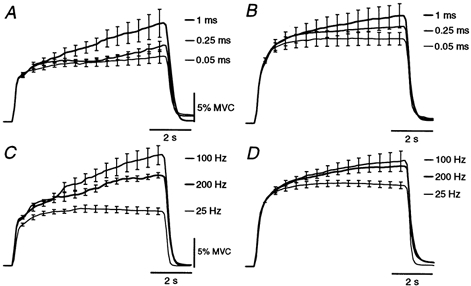
Mean responses (n = 5) to stimulation at three pulse widths for a single subject (A) and for the group of six (B). Mean responses (n = 5) to stimulation at three frequencies are shown for a single subject in C and for the group in D. Group data were normalized to the force 0.5 s after stimulus onset for each subject. Stimulus intensity was adjusted so that brief test trains produced the same forces (see Methods). Data are means ± s.e.m. (omitted from middle traces in the group data).
To assess the maximal involuntary force that could be developed, prolonged stimulation was delivered over TA in five subjects. Figure 4 shows the force recorded during 40 s stimulation in one subject. The arrow in the inset marks the ‘take-off’ in the force ∼1 s after stimulus onset. Over the next 29 s, the force rose from 8 to 50 % MVC, an increase of 42 % MVC. Across the group, the peak force was 3.0 ± 0.6 times that 1 s after stimulus onset and this peak occurred after 22.7 ± 3.9 s of stimulation.
Figure 4. Dorsiflexion force evoked by 100 Hz stimulation over tibialis anterior for 40 s.
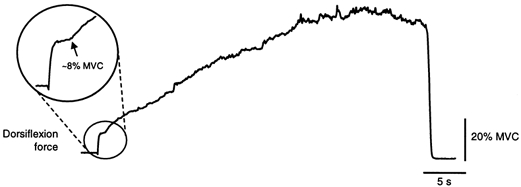
The arrow in the circled inset highlights the abrupt force increase ∼1 s after the stimulus onset.
Hysteresis in the force-frequency relationship
The relationship between stimulus frequency and evoked force was examined by modulating the stimulus frequency linearly from ∼4 to 100 Hz and back over 6 s. Figure 5A and D shows the forces during five successive stimulations over TA and TS, respectively, with corresponding force-frequency plots in Fig. 5B and E. There was often a prominent increase in force as the stimulus frequency increased between 30 and 100 Hz. The force level was maintained or even increased further during the second half of the triangular stimulation pattern, despite the declining stimulus frequency. This produced marked hysteresis in the force-frequency plots. The thick lines in Fig. 5C and F show the mean force-frequency plots across a group of subjects (n = 6 for TA; n = 7 for TS). For these data, forces were normalized to that evoked at 25 Hz during the increasing stimulation frequency for each subject. The thin lines in these panels show the mean force-frequency plots recorded during proximal anaesthetic nerve blocks (see Methods). During the blocks the force increased very little after the stimulus frequency reached ∼30 Hz and there was comparatively little hysteresis in the force-frequency plots (except at low frequencies). During these trials the test muscle was effectively disconnected from the central nervous system and the evoked forces depended only on peripheral neuromuscular factors.
Figure 5. Responses in tibialis anterior and triceps surae to triangular-shaped changes in stimulation frequency.
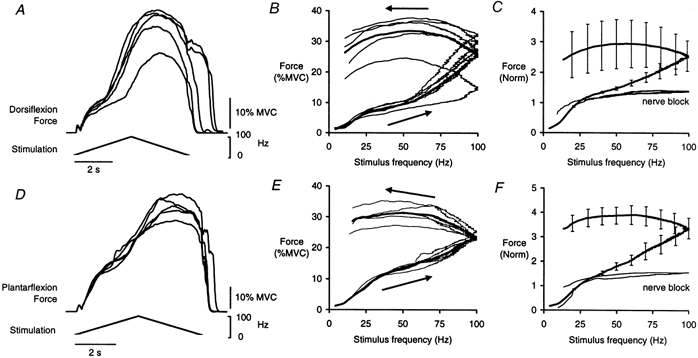
Data from stimulation over TA are shown in A-C and over TS in D-F. A and D show superimposed the forces recorded during five successive trains in single subjects. The force-frequency relationships for those data are shown by the thin lines in B and E; the thick line shows the mean. C shows the mean force-frequency response across subjects for TA (thick line; n = 6). Also shown is the mean force recorded from one subject when similar stimulation was applied during a complete block of the common peroneal nerve (thin line). Mean force-frequency response across subjects for TS is shown in F (thick line; n = 7). The thin line shows the mean force recorded from two subjects when stimulation was applied over TS during a block of the tibial nerve (see Methods). Data are means ± s.e.m.
Sustained forces and the ‘warm-up’ phenomenon
The effect of brief periods of stimulation at 100 Hz was explored by delivering 2 s bursts of 100 Hz stimulation during longer periods of stimulation at 25 Hz. Figure 6A shows ten superimposed recordings from a single subject to stimulation over TA. In the five trials shown as thick traces, the stimulus rate was abruptly increased to 100 Hz for the period shown by the dotted line (2 s at 25 Hz, 2 s at 100 Hz and 3 s at 25 Hz). The remaining five trials (thin lines) served as control trials with stimulation at 25 Hz for the full 7 s. For the group of six subjects (Fig. 6B), force at the end of the 7 s stimulation was 133 ± 12 % of that at the same time in the control trials (range, 100–183 %). Examples of the responses in TS to similar patterns of stimulation from one subject are shown in Fig. 10A.
Figure 6. Forces evoked by 100 Hz ‘bursts’ during stimulation at 25 Hz.
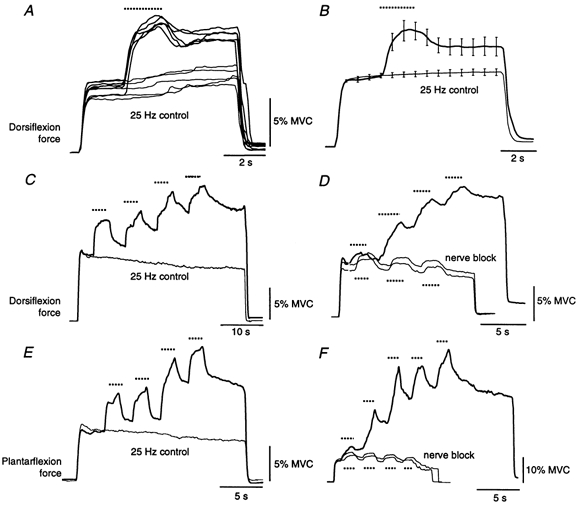
Forces evoked by a single 100 Hz burst over TA are shown in A for a single subject and across the group (n = 6) in B. The thick lines show the force responses recorded during the burst-like stimulus pattern (25 Hz for 2 s, then 100 Hz for 2 s and then 25 Hz for 3 s), which resulted in more force after the high-frequency burst than before it despite the similar stimulus frequency. Also shown are the control data (7 s at 25 Hz; thin lines). For B the data were normalized to the force 0.5 s after stimulus onset for the control trials for each subject. Error bars (± s.e.m.) are shown at 0.5 s intervals during the stimulation. C-F show forces evoked by multiple bursts of 100 Hz stimulation during prolonged stimulation at 25 Hz. Data from stimulation over TA are shown in C and D and over TS in E and F. C and E show the forces from single subjects when the stimulation alternated between 25 and 100 Hz with the final 3 s at 25 Hz (thick lines) and during control trials at 25 Hz (thin lines). D and F show the force in one subject to similar alternating stimulation before (thick lines) and during (thin lines) a complete proximal nerve block. In all panels the dotted lines show the approximate duration of the 100 Hz stimulation.
Figure 10. Superficial peroneal nerve stimulation during sustained involuntary force and EMG activity.
A shows the force and EMG responses to three consecutive stimulus trains (25 Hz for 2 s, then 100 Hz for 2 s and then 25 Hz for 3 s) delivered over the triceps surae for one subject. During each stimulus train the force remained elevated after the 100 Hz burst, despite the frequency returning to 25 Hz. Also, some residual force and EMG remained after the first stimulus train which was not present before the stimulation. This residual activity was greater after the second stimulation and remained after the third stimulation until the subject was asked to ‘relax completely’. During the sustained activity noxious stimulation (5 pulses at 300 Hz at 6 times perceptual threshold) was delivered to the SP nerve at the times indicated by the arrows. The force and triceps surae EMG responses to the three bursts of SP stimuli are shown superimposed on an expanded time scale in B.
The additional force present following a single 100 Hz burst often became more pronounced when multiple bursts were delivered. The thick lines in Fig. 6C-F show the forces recorded during repeated bursts (TA stimulation, Fig. 6C and D; TS stimulation, Fig. 6E and F). Stimulation frequency alternated between 25 and 100 Hz; the dotted lines show the periods of 100 Hz stimulation. For the control trials (Fig. 6C and E) the stimulation was delivered at 25 Hz for 14 s. The progressive increase in response to the 100 Hz bursts was absent in trials during a proximal nerve block (Fig. 6D and F). Responses of TA to various patterns of stimulation before and during a complete anaesthetic block of the common peroneal nerve are shown in Fig. 7 for one subject. The striking and sustained increases in force observed before the nerve block were absent during the block.
Figure 7. Force responses to different patterns of stimulation over tibialis anterior.
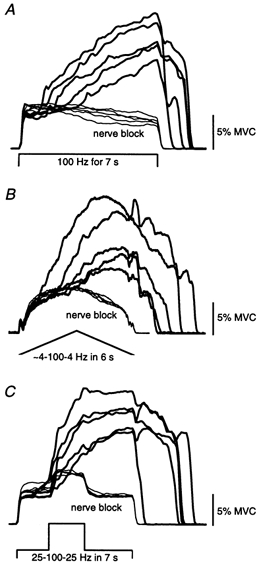
Data are shown for one subject when the same stimulation was delivered before (thick lines) and during (thin lines) a complete anaesthetic block of the common peroneal nerve. Stimulus pattern was 100 Hz for 7 s in A, ramped from 4 to 100 Hz and then back to 4 Hz over 6 s in B, and 25 Hz for 2 s, then 100 Hz for 2 s, then 25 Hz for 3 s in C.
Interaction with voluntary drives
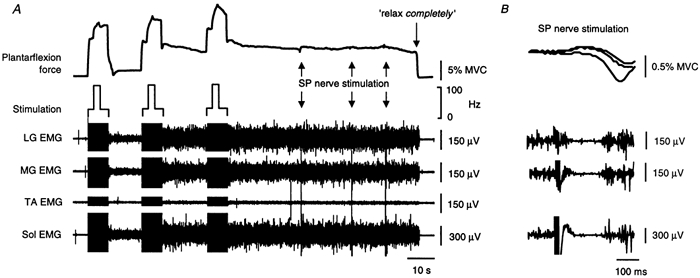
To explore the interaction between descending volitional drives and peripheral afferent volleys in triggering the sustained contractions, five subjects performed brief (∼2 s) voluntary plantarflexion contractions during prolonged stimulation over TS (25 Hz for 14 s). Force and EMG data during consecutive, identical stimulus trains ∼90 s apart are shown in Fig. 8A. The left-hand panel shows the force decreasing during the control 25 Hz stimulation when the subject remained relaxed. In contrast, the right-hand panel shows the force increasing after a brief voluntary contraction (∼5 % MVC) was performed ∼2 s after stimulus onset. In this example force and Sol EMG continued after the stimulation was turned off although the subject felt relaxed. When asked to ‘relax completely’ the force and EMG were reduced but not abolished (Fig. 8A). Mean force responses from a different subject for TS contractions at three different levels (versus control) are shown in Fig. 8B. The force increased markedly following the medium and strong contractions. For the group of five subjects (Fig. 8C), the force was significantly higher at the end of the 25 Hz stimulation when subjects had performed the strong contractions compared to weak contractions and for the medium and strong contractions compared with the control (ANOVA, P = 0.002).
Figure 8. Effect of a brief voluntary contraction on the force produced during low-frequency stimulation over the triceps surae.
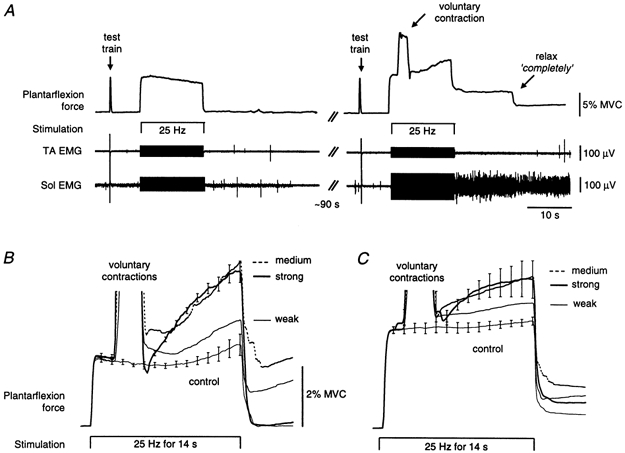
A shows force and EMG data from a single subject when the muscle was stimulated at 25 Hz for two consecutive 14 s periods. The responses to two ‘test’ trains (5 pulses at 100 Hz) delivered immediately before the longer trains are also shown. The data on the left show a control stimulation while the subject relaxed. The data on the right show the subsequent stimulation during which the subject performed a contraction for ∼2 s starting ∼2 s after stimulus onset. Note the increasing force following the contraction and residual force and EMG after the stimulation. This occurred even though the subject felt relaxed before and after the contraction. In this case when the subject was requested to ‘relax completely’ some but not all of this activity subsided. B shows mean forces (n = 5) recorded from one subject during control stimulation (25 Hz for 14 s) and during the same stimulation with brief (∼2 s) voluntary contractions at three intensities (weak, 5 % MVC; medium, 14 % MVC; and strong, 23 % MVC). Mean data from five subjects are shown in C (weak, 6 % MVC; medium, 14 % MVC; and strong, 30 % MVC). Contraction amplitudes represent the average force above that evoked by the electrical stimulation (see A). For clarity, error bars (± s.e.m.) in B and C are shown only on the control and high-contraction data.
Sustained involuntary activity
In all subjects, force and EMG sometimes persisted after the stimulus was turned off. This residual activity ended shortly after the stimulation (Figs 2A and E, 5A and D and 7) or continued for long periods of time (Figs 8-10). Figure 9 shows an example from one subject in whom sustained after-discharges were readily evoked. The left-hand panel shows force and EMG remaining after a voluntary contraction was performed during 25 Hz stimulation over TS. This residual activity was abolished when the subject was reminded to relax completely (at vertical arrow). The panel on the right shows that similar spontaneous involuntary activity could be triggered in the absence of stimulation when the subject performed five brief voluntary contractions ∼1 min later.
Figure 9. Involuntary force and EMG evoked by brief voluntary contractions with and without muscle stimulation.
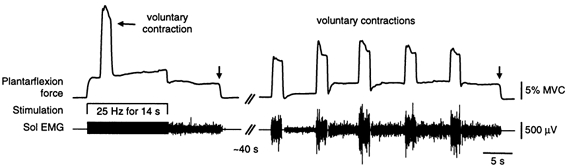
Data on the left show the force and Sol EMG recorded from one subject when a brief voluntary contraction was performed during 25 Hz stimulation over TS. The data on the right were recorded when the subject performed five brief voluntary contractions with no stimulation. Residual force and EMG were present after the voluntary contraction and stimulation were combined and after the contractions performed without the stimulation. The on-going activity was abolished when the subject was requested to relax completely (at vertical arrows).
The amount of residual activity often increased after repeated stimulations, as shown in Fig. 10A, an effect comparable to that of repeated 100 Hz bursts of stimulation in Fig. 6. When the residual activity was evoked by voluntary contractions a similar effect was also evident (right-hand panel of Fig. 9). Figure 9 and Figure 10 also show that a steady level of motor output was reached, which was then relatively unaffected by subsequent inputs. This was common and the forces typically ranged from ∼4 to 8 % MVC. In four subjects, strong stimulation delivered to the superficial peroneal (SP) nerve at the ankle (5 stimuli at 300 Hz at 4–6 times perceptual threshold) was insufficient to terminate the sustained activity, despite the brief inhibition of the on-going EMG. An example is shown for one subject in Fig. 10A, in whom noxious SP stimulation produced inhibition lasting ∼100 ms, as evident in the EMG responses in the three components of TS in Fig. 10B. When reminded to relax during bouts of such activity subjects were typically unaware of the residual muscle contraction and stated that they were relaxed. However, if the contraction did not end spontaneously, subjects were usually able to terminate it (Fig. 9 and Fig. 10) or greatly reduce it (Fig. 8A) when requested to relax completely. Interestingly, subjects had difficulty describing what they had done to stop the activity although it did not involve activation of the antagonist muscles (Fig. 8A and Fig. 10A).
DISCUSSION
In a previous study, electrical stimulation delivered over the surface of the muscles which plantarflex the ankle produced a gradually incrementing force, which depended on the recruitment of spinal motoneurones and which could be recorded in subjects who were asleep or had spinal cord lesions (Collins et al. 2001b). The present study demonstrates that this phenomenon is not confined to muscles with powerful spinal reflexes, such as the triceps surae, and documents the optimal stimulating conditions for triggering it. A major new finding is that volitional drives can interact with peripheral inputs to trigger this behaviour and that, sometimes, only volitional drives may be necessary. The ‘extra’ force produced by this involuntary spinal mechanism can be quite large, up to 42 % MVC. Residual force and EMG frequently continued long after the stimulation that triggered it. This sustained involuntary activity was not terminated by brief inhibitory inputs to the active motoneurones but could be abolished by the request to ‘relax completely’. The results share many similarities with earlier work on the tonic vibration reflex (TVR; e.g. Hagbarth & Eklund, 1966; Lang & Vallbo, 1967; Marsden et al. 1969; Homma et al. 1971; Burke & Schiller, 1976) and more recent data demonstrating activation of plateau potentials in motoneurones of experimental animals (Crone et al. 1988; Bennett et al. 1998a,b; Lee & Heckman, 1998) and possibly in humans (Kiehn & Eken, 1997; Gorassini et al. 1998; Collins et al. 2001b).
Mechanisms and adequate conditions for evoking the ‘extra’ force
The evoked contractions derived from two main sources (see Fig. 1B). A small component was of peripheral origin and arose from the orthodromic activation of large-diameter motor axons which innervate fast-twitch, fatigable muscle fibres (Burke, 1981). This component remained during an anaesthetic block of the nerve proximal to the stimulation site. The ‘extra’ force, superimposed on this peripheral force, originated within the central nervous system, as demonstrated by comparison of the forces recorded before and during the nerve block (Figs 5, 6 and 7). It could develop at stimulus intensities below motor threshold, when only large-diameter sensory axons would have been activated. The resulting synaptic activation of spinal motoneurones would presumably follow the size principle (Henneman, 1957). Therefore, in contrast to the peripheral force, it is likely that the central force largely resulted from recruitment of smaller motoneurones of low voluntary threshold (see Burke, 1981). Additionally, any central contribution from large motoneurones would have been reduced by collision with antidromic activity in large motor axons. Uncollided antidromic activity may have had an inhibitory influence on the central forces through Renshaw cell activation (Ryall et al. 1972; Jankowska & Smith, 1973).
The central forces have been recorded in subjects who were lightly asleep and patients with spinal cord injury (Collins et al. 2001b). Thus, they can be generated by mechanisms intrinsic to the spinal cord and are not dependent on inadvertent volitional input to motoneurones. The central forces were evoked more readily by long-duration stimulus pulses, a phenomenon which is consistent with preferential activation of sensory fibres (Mogyoros et al. 1996). Furthermore, the central forces were readily evoked by high-frequency (100 Hz) stimulation, although in some subjects these forces could be produced in both muscle groups during stimulation at 25 Hz. These forces were recordable with stimulation intensities from below motor threshold up to that which evoked a peak force of ∼8 % MVC during a test train of five pulses at 100 Hz. Stronger stimulus intensities were uncomfortable because of cutaneous paraesthesiae, tetanic contractions and/or cramp and they were not formally investigated. Importantly, all the major phenomena we describe were obtainable at stimulus intensities which were innocuous and not painful.
It has been proposed that the most likely mechanism underlying the central force for TS is the activation of plateau potentials in motoneurones and perhaps interneurones in spinal circuits (Collins et al. 2001b). The observations in the present study are consistent with this hypothesis. It is difficult to explain the observed force changes by changes in synaptic drive to the motoneurones from either peripheral or descending inputs.
Possible involvement of plateau potentials
The strength of the central contribution to the recorded forces varied between subjects but was relatively consistent within a subject. Between subjects, responses ranged from little evidence of this behaviour to those in whom large forces developed and sustained discharges were readily evoked and difficult to suppress. This variability may reflect individual differences in the threshold for plateau activation, perhaps due to differences in the neuromodulatory state of the spinal cord. The 25 Hz stimulation preceding the 100 Hz bursts may have brought some neurones close to plateau threshold, which was then exceeded during the 100 Hz burst. The subsequent 25 Hz stimulation usually maintained the elevated force levels and repeated ‘bursts’ resulted in progressively more force, behaviour analogous to the ‘warm-up’ phenomenon that is characteristic of plateau potentials (Russo & Hounsgaard, 1994; Svirskis & Hounsgaard, 1997; Bennett et al. 1998b; Morisset & Nagy, 2000).
Residual force and EMG activity were often present after the stimulation. There are many reports of similar sustained discharges from motoneurones throughout the literature (e.g. Sherrington, 1906; Alvord & Fourtes, 1953; Granit et al. 1957; Hagbarth & Eklund, 1966; Lang & Vallbo, 1967; Hultborn et al. 1975; Hultborn & Wigström, 1980; Wada et al. 1989; Kiehn & Eken, 1997; Gorassini et al. 1998; Collins et al. 2001b). Sustained discharges outlasting direct current injection or synaptic activation are now attributed to plateau potentials in motoneurones (Hounsgaard et al. 1984, 1988; Crone et al. 1988; Lee & Heckman, 1996; Kiehn & Eken, 1997; Bennett et al. 1998b; Gorassini et al. 1998). The presently observed sustained activity probably shares a similar mechanism, although plateau potentials in spinal interneurones (Russo & Hounsgaard, 1994, 1996; Morisset & Nagy, 2000) may also be involved. Interestingly, our subjects were usually unaware of the on-going activity, but could abolish it without concomitant antagonist activation when asked to relax completely. The present ineffectiveness of SP stimulation in terminating the sustained activity seems inconsistent with results in experimental animals (Hultborn et al. 1975; Hounsgaard et al. 1988; Eken & Kiehn, 1989; Bennett et al. 1998b; Lee & Heckman, 1998) but the duration of the SP stimulation was shorter and the intensity lower than has proven effective in animals.
The central forces presently reported are reminiscent of those during tonic vibration reflexes (TVR), which develop when vibration is applied to a muscle or its tendon (see De Gail et al. 1966; Hagbarth & Eklund, 1966; Lang & Vallbo, 1967; Marsden et al. 1969; Homma et al. 1971). Both are initiated by large-diameter afferents, are slow to develop, often outlast the initiating stimulus, and are involuntary but can be abolished by volition. Electrically evoked TVR-like contractions have been demonstrated previously in animals (Alvord & Fuortes, 1953; Hounsgaard et al. 1984; Wada et al. 1989; Bennett et al. 1998a,b) and humans (De Gail et al. 1966; Lang & Vallbo, 1967; Marsden et al. 1969; Burke & Schiller, 1976; Stuart et al. 1986; Collins et al. 2001b). It has been suggested that activation of plateau potentials in motoneurones is involved in genesis of the TVR (Stuart et al. 1986; Crone et al. 1988; Hounsgaard et al. 1988) and it is likely that a similar mechanism is responsible for its electrical analogue.
Functional implications
The central forces could be triggered by volitional drives to spinal circuitry. This occurred regularly when a voluntary contraction was performed during a steady, electrically evoked afferent bombardment. It was also seen when brief voluntary contractions were performed without additional electrical stimulation. The amplitude of the central forces after a voluntary contraction reflected the amplitude of the contraction. The volitional inputs to the motoneurone pool triggering this behaviour include not only the descending command itself but also the afferent inputs evoked during and at the end of the voluntary contraction.
The development of plateau potentials in motoneurones of experimental animals results in a marked hysteresis in the input-output properties of the cell during triangular-shaped patterns of stimulation (Hounsgaard et al. 1984; Bennett et al. 1998a,b; cf. Binder-Macleod & Clamann, 1989). Although these data cannot be compared directly with the current results, the hysteresis and large forces observed presently suggest that the capacity for human motoneurones to develop plateau potentials may be just as great as that shown for reduced preparations, at least for motoneurones innervating leg muscles. This potentially powerful mechanism could play a major role in shaping motor output in humans. Plateau potentials in interneurones may play a similar role at a premotoneuronal level. In animals, the extent of synaptic amplification can vary, but the summation of different inputs remains linear (Prather et al. 2001). Hence, a neurone in a plateau state still responds to synaptic drives and strong inhibitory inputs can terminate sustained discharges (Hultborn et al. 1975; Crone et al. 1988; Lee & Heckman, 1996; Bennett et al. 1998b). This is important functionally because it represents a mechanism whereby gain can be regulated over a wide range while still allowing a response to multiple inputs. Plateau potential activation in human motoneurones and interneurones may be an integral part of the normal control of human movement.
Acknowledgments
This work was funded by the NH&MRC (Australia #3206), NSERC (Canada) and AHFMR (Canada).
REFERENCES
- Alvord EC, Fuortes MGF. Reflex activity of extensor motor units following muscular afferent excitation. Journal of Physiology. 1953;122:302–321. doi: 10.1113/jphysiol.1953.sp005001. [DOI] [PMC free article] [PubMed] [Google Scholar]
- Bennett DJ, Hultborn H, Fedirchuk B, Gorassini M. Synaptic activation of plateaus in hindlimb motoneurons of decerebrate cats. Journal of Neurophysiology. 1998a;80:2023–2037. doi: 10.1152/jn.1998.80.4.2023. [DOI] [PubMed] [Google Scholar]
- Bennett DJ, Hultborn H, Fedirchuk B, Gorassini M. Short-term plasticity in hindlimb motoneurons of decerebrate cats. Journal of Neurophysiology. 1998b;80:2038–2045. doi: 10.1152/jn.1998.80.4.2038. [DOI] [PubMed] [Google Scholar]
- Binder MD, Heckman CJ, Powers RK. The physiological control of motoneuron activity. In: Rowell LB, Shepherd JT, editors. Handbook of Physiology, Exercise: Regulation and Integration of Multiple Systems section 12. New York: Oxford University Press; 1996. pp. 3–53. [Google Scholar]
- Binder-Macleod SA, Clamann HP. Force output of cat motor units stimulated with trains of linearly varying frequency. Journal of Neurophysiology. 1989;61:208–217. doi: 10.1152/jn.1989.61.1.208. [DOI] [PubMed] [Google Scholar]
- Burke D, Schiller HH. Discharge pattern of single motor units in the tonic vibration reflex of human triceps surae. Journal of Neurology, Neurosurgery and Psychiatry. 1976;39:729–741. doi: 10.1136/jnnp.39.8.729. [DOI] [PMC free article] [PubMed] [Google Scholar]
- Burke RE. Motor units: anatomy, physiology and functional organisation. In: Brooks VB, editor. Handbook of Physiology, section 1, The Nervous System. II. Bethesda: American Physiological Society; 1981. pp. 345–422. part I. [Google Scholar]
- Collins DF, Burke D, Gandevia SC. Large “reflex” increments in force produced by electrical stimulation over human muscle. Proceedings of the Australian Neuroscience Society. 2001a;12:228. [Google Scholar]
- Collins DF, Burke D, Gandevia SC. Large involuntary forces consistent with plateau-like behavior of human motoneurons. Journal of Neuroscience. 2001b;21:4059–4065. doi: 10.1523/JNEUROSCI.21-11-04059.2001. [DOI] [PMC free article] [PubMed] [Google Scholar]
- Conway BA, Hultborn H, Kiehn O, Mintz I. Plateau potentials in α-motoneurones induced by intravenous injection of l-DOPA and clonidine in the spinal cat. Journal of Physiology. 1988;405:369–384. doi: 10.1113/jphysiol.1988.sp017337. [DOI] [PMC free article] [PubMed] [Google Scholar]
- Creed RS, Denny-Brown D, Eccles JC, Liddell EGT, Sherrington CS. Reflex Activity of the Spinal Cord. London: Oxford University Press; 1932. [Google Scholar]
- Crone C, Hultborn H, Kiehn O, Mazieres L, Wigström H. Maintained changes in motoneuronal excitability by short-lasting synaptic inputs in the decerebrate cat. Journal of Physiology. 1988;405:321–343. doi: 10.1113/jphysiol.1988.sp017335. [DOI] [PMC free article] [PubMed] [Google Scholar]
- De Gail P, Lance JW, Neilson PD. Differential effects on tonic and phasic reflex mechanisms produced by vibration of muscles in man. Journal of Neurology, Neurosurgery and Psychiatry. 1966;29:1–11. doi: 10.1136/jnnp.29.1.1. [DOI] [PMC free article] [PubMed] [Google Scholar]
- Delgado-Lezama R, Hounsgaard J. Adapting motoneurones for motor behavior. In: Binder MD, editor. Peripheral and Spinal Mechanisms in the Neural Control of Movement, Progress in Brain Research. Vol. 123. Amsterdam: Elsevier Science; 1999. pp. 57–63. [DOI] [PubMed] [Google Scholar]
- Eccles JC. The Physiology of Nerve Cells. Baltimore: Johns Hopkins Press; 1957. [Google Scholar]
- Eken T, Kiehn O. Bistable firing properties of soleus motor units in unrestrained rats. Acta Physiologica Scandinavica. 1989;136:383–394. doi: 10.1111/j.1748-1716.1989.tb08679.x. [DOI] [PubMed] [Google Scholar]
- Gandevia SC, Burke D, Collins DF. Possible role of plateau potentials in force increments produced by electrical stimulation over human muscles. Proceedings of the Australian Neuroscience Society. 2001;12:228. [Google Scholar]
- Gorassini M, Bennett DJ, Kiehn O, Eken T, Hultborn H. Activation patterns of hindlimb motor units in the awake rat and their relation to motoneuron intrinsic properties. Journal of Neurophysiology. 1999;82:709–717. doi: 10.1152/jn.1999.82.2.709. [DOI] [PubMed] [Google Scholar]
- Gorassini M, Bennett DJ, Yang JF. Self-sustained firing of human motor units. Neuroscience Letters. 1998;247:13–16. doi: 10.1016/s0304-3940(98)00277-8. [DOI] [PubMed] [Google Scholar]
- Gorassini M, Bennett DJ, Yang JF, Harvey P. Evidence for activation of IPICS from firing behaviour of motor unit pairs in uninjured and spinal cord injured human subjects. Plateau Potentials and Rhythmic Firing in Motoneurons. 2000. Abstracts from an international conference organized by R. M. Enoka & C. J. Heckman, June 15–17 http://www.colorado.edu/kines/BoulderMeeting.html.
- Granit R, Kernell D, Lamarre Y. Algebraical summation in synaptic activation of motoneurones firing within the ‘primary range’ to injected currents. Journal of Physiology. 1966;187:379–399. doi: 10.1113/jphysiol.1966.sp008097. [DOI] [PMC free article] [PubMed] [Google Scholar]
- Granit R, Phillips CG, Skoglund S, Steg G. Differentiation of tonic from phasic alpha ventral horn cells by stretch, pinna and crossed extensor reflexes. Journal of Neurophysiology. 1957;20:470–481. doi: 10.1152/jn.1957.20.5.470. [DOI] [PubMed] [Google Scholar]
- Hagbarth K-E, Eklund G. Motor effects of vibratory muscle stimuli in man. In: Granit R, editor. Muscular Afferents and Motor Control, Proceedings of the First Noble Symposium. Stockholm: Almqvist and Wiksell; 1966. pp. 177–186. [Google Scholar]
- Heckman CJ, Lee RH. Synaptic integration in bistable motoneurons. In: Binder MD, editor. Peripheral and Spinal Mechanisms in the Neural Control of Movement, Progress in Brain Research. Vol. 123. Amsterdam: Elsevier Science; 1999. pp. 49–56. [DOI] [PubMed] [Google Scholar]
- Henneman E. Relation between size of neurons and their susceptibility to discharge. Science. 1957;126:1345–1347. doi: 10.1126/science.126.3287.1345. [DOI] [PubMed] [Google Scholar]
- Homma S, Kanda K, Watanabe S. Tonic vibration reflex in human and monkey subjects. Japanese Journal of Physiology. 1971;21:419–430. doi: 10.2170/jjphysiol.21.419. [DOI] [PubMed] [Google Scholar]
- Hornby TG, Stauffer EK, Stuart DG. Open issues on the functional role of the plateau potential in the repetitive discharge of motoneurons in experimental animals and humans. In: Dengler R, Kossev AR, editors. Sensorimotor Control. Amsterdam: IOS Press; 2000. pp. 65–74. [Google Scholar]
- Hounsgaard J, Hultborn H, Jespersen B, Kiehn O. Intrinsic membrane properties causing a bistable behaviour of alpha-motoneurones. Experimental Brain Research. 1984;55:391–394. doi: 10.1007/BF00237290. [DOI] [PubMed] [Google Scholar]
- Hounsgaard J, Hultborn H, Jespersen B, Kiehn O. Bistability of α-motoneurones in the decerebrate cat and in the acute spinal cat after intravenous 5-hydroxytryptophan. Journal of Physiology. 1988;405:345–367. doi: 10.1113/jphysiol.1988.sp017336. [DOI] [PMC free article] [PubMed] [Google Scholar]
- Hounsgaard J, Kiehn O. Calcium spikes and calcium plateaux evoked by differential polarization in dendrites of turtle motoneurones in vitro. Journal of Physiology. 1993;468:245–259. doi: 10.1113/jphysiol.1993.sp019769. [DOI] [PMC free article] [PubMed] [Google Scholar]
- Hultborn H, Wigström H. Motor response with long latency and maintained duration evoked by activity in Ia afferents. In: Desmedt JE, editor. Progress in Clinical Neurophysiology. Basel: Karger; 1980. pp. 99–116. [Google Scholar]
- Hultborn H, Wigström H, Wangberg B. Prolonged activation of soleus motoneurones following a conditioning train in soleus Ia afferents – a case for a reverberating loop? Neuroscience Letters. 1975;1:147–152. doi: 10.1016/0304-3940(75)90030-0. [DOI] [PubMed] [Google Scholar]
- Kiehn O, Eken T. Prolonged firing in motor units: evidence of plateau potentials in human motoneurons? Journal of Neurophysiology. 1997;78:3061–3068. doi: 10.1152/jn.1997.78.6.3061. [DOI] [PubMed] [Google Scholar]
- Lee RH, Heckman CJ. Influence of voltage-sensitive dendritic conductances on bistable firing and effective synaptic current in cat spinal motoneurons in vivo. Journal of Neurophysiology. 1996;76:2107–2110. doi: 10.1152/jn.1996.76.3.2107. [DOI] [PubMed] [Google Scholar]
- Lee RH, Heckman CJ. Bistability in spinal motoneurons in vivo: systematic variations in rhythmic firing patterns. Journal of Neurophysiology. 1998;80:572–582. doi: 10.1152/jn.1998.80.2.572. [DOI] [PubMed] [Google Scholar]
- Lee RH, Heckman CJ. Adjustable amplification of synaptic input in the dendrites of spinal motoneurons in vivo. Journal of Neuroscience. 2000;20:6734–6740. doi: 10.1523/JNEUROSCI.20-17-06734.2000. [DOI] [PMC free article] [PubMed] [Google Scholar]
- Lee RH, Heckman CJ. Essential role of a fast persistent inward current in action potential initiation and control of rhythmic firing. Journal of Neurophysiology. 2001;85:472–475. doi: 10.1152/jn.2001.85.1.472. [DOI] [PubMed] [Google Scholar]
- Marsden CD, Meadows JC, Hodgson HJF. Observations on the reflex response to muscle vibration and its voluntary control. Brain. 1969;92:829–846. doi: 10.1093/brain/92.4.829. [DOI] [PubMed] [Google Scholar]
- Mogyoros I, Kiernan MC, Burke D. Strength-duration properties of human peripheral nerve. Brain. 1996;119:439–447. doi: 10.1093/brain/119.2.439. [DOI] [PubMed] [Google Scholar]
- Morisset V, Nagy F. Plateau potential-dependent windup of the response to primary afferent stimuli in rat dorsal horn neurons. European Journal of Neuroscience. 2000;12:3087–3095. doi: 10.1046/j.1460-9568.2000.00188.x. [DOI] [PubMed] [Google Scholar]
- Prather JF, Powers RK, Cope TC. Amplification and linear summation of synaptic effects on motoneuron firing rate. Journal of Neurophysiology. 2001;85:43–53. doi: 10.1152/jn.2001.85.1.43. [DOI] [PubMed] [Google Scholar]
- Russo RE, Hounsgaard J. Short-term plasticity in turtle dorsal horn neurons mediated by L-type Ca2+ channels. Neuroscience. 1994;61:191–197. doi: 10.1016/0306-4522(94)90222-4. [DOI] [PubMed] [Google Scholar]
- Russo RE, Hounsgaard J. Plateau-generating neurones in the dorsal horn in an in vitro preparation of the turtle spinal cord. Journal of Physiology. 1996;493:39–54. doi: 10.1113/jphysiol.1996.sp021363. [DOI] [PMC free article] [PubMed] [Google Scholar]
- Russo RE, Hounsgaard J. Modulation of plateau properties in dorsal horn neurones in a slice preparation of the turtle spinal cord. Journal of Physiology. 1997;499:459–474. doi: 10.1113/jphysiol.1997.sp021941. [DOI] [PMC free article] [PubMed] [Google Scholar]
- Ryall RW, Piercey MF, Polosa C, Goldfarb J. Excitation of Renshaw cells in relation to orthodromic and antidromic excitation of motoneurons. Journal of Neurophysiology. 1972;35:137–148. doi: 10.1152/jn.1972.35.1.137. [DOI] [PubMed] [Google Scholar]
- Schwindt P, Crill W. Role of a persistent inward current in motoneuron bursting during spinal seizures. Journal of Neurophysiology. 1980;43:1296–1318. doi: 10.1152/jn.1980.43.5.1296. [DOI] [PubMed] [Google Scholar]
- Sherrington CS. The Integrative Action of the Nervous System. New Haven: Yale University Press; 1906. [Google Scholar]
- Stuart GJ, Rymer WZ, Schotland JL. Characteristics of reflex excitation in close synergist muscles evoked by muscle vibration. Experimental Brain Research. 1986;65:127–134. doi: 10.1007/BF00243835. [DOI] [PubMed] [Google Scholar]
- Svirskis G, Hounsgaard J. Depolarization-induced facilitation of a plateau-generating current in ventral horn neurons in the turtle spinal cord. Journal of Neurophysiology. 1997;78:1740–1742. doi: 10.1152/jn.1997.78.3.1740. [DOI] [PubMed] [Google Scholar]
- Svirskis G, Hounsgaard J. Transmitter regulation of plateau properties in turtle motoneurons. Journal of Neurophysiology. 1998;79:45–50. doi: 10.1152/jn.1998.79.1.45. [DOI] [PubMed] [Google Scholar]
- Wada N, Nakajima Y, Homma S. Long-lasting afterdischarge of alpha-motoneurons after muscle vibration or electrical stimulation of group I afferent fibers in the anemically decerebrated cat. Neuroscience Research. 1989;6:234–247. doi: 10.1016/0168-0102(89)90062-x. [DOI] [PubMed] [Google Scholar]