

Abstract
The influence of angiotensin II (ANGII) on the dynamic characteristics of renal blood flow (RBF) was studied in conscious dogs by testing the response to a step increase in renal artery pressure (RAP) after a 60 s period of pressure reduction (to 50 mmHg) and by calculating the transfer function between physiological fluctuations in RAP and RBF. During the RAP reduction, renal vascular resistance (RVR) decreased and upon rapid restoration of RAP, RVR returned to baseline with a characteristic time course: within the first 10 s, RVR rose rapidly by 40 % of the initial change (first response, myogenic response). A second rise began after 20–30 s and reached baseline after an overshoot at 40 s (second response, tubuloglomerular feedback (TGF)). Between both responses, RVR rose very slowly (plateau). The transfer function had a low gain below 0.01 Hz (high autoregulatory efficiency) and two corner frequencies at 0.026 Hz (TGF) and at 0.12 Hz (myogenic response). Inhibition of angiotensin converting enzyme (ACE) lowered baseline RVR, but not the minimum RVR at the end of the RAP reduction (autoregulation-independent RVR). Both the first and second response were reduced, but the normalised level of the plateau (balance between myogenic response, TGF and possible slower mechanisms) and the transfer gain below 0.01 Hz were not affected. Infusion of ANGII after ramipril raised baseline RVR above the control condition. The first and second response and the transfer gain at both corner frequencies were slightly augmented, but the normalised level of the plateau was not affected. It is concluded that alterations of plasma ANGII within a physiological range do not modulate the relative contribution of the myogenic response to the overall short-term autoregulation of RBF. Consequently, it appears that ANGII augments not only TGF, but also the myogenic response.
Although angiotensin II (ANGII) exerts an important influence on the mean level of renal blood flow (RBF) and contributes to the fine tuning of glomerular filtration rate, the contribution of ANGII to the autoregulation of RBF is believed currently to be negligible (Navar et al. 1996). This view has been derived from studies in which the autoregulation of RBF had been assessed by the classical method of stepwise artificial reductions in renal artery pressure (RAP) (Abe et al. 1976; Arendshorst & Finn, 1977; Hall et al. 1977; Persson et al. 1988).
However, under physiological conditions, fluctuations in RAP occur more dynamically and the process of RBF autoregulation itself exhibits a characteristic dynamic response pattern (Daniels et al. 1990; Holstein-Rathlou et al. 1991; Cupples et al. 1996; Just et al. 1998b). Therefore, several possibilities for a contribution from the renin-angiotensin system remain, which might have escaped detection when using the classical stepwise method. There are at least three possible ways in which ANGII could play a role in short-term autoregulation of RBF. First, ANGII might be involved (either directly or by modulating other mechanisms) in a frequency range that is faster than the 2–5 min duration of the artificial pressure steps, similar to the effects of nitric oxide (Just et al. 1999). Second, the total autoregulatory capacity is used only partially under physiological conditions (Just et al. 1998b), and this limited level of regulation might well be modified by ANGII. Finally, even if the ANGII does not actively participate in basal autoregulation, it might alter the relative contribution of those mechanisms that are involved.
At present, RBF autoregulation is thought to be brought about by the myogenic response and tubuloglomerular feedback (TGF) (Navar et al. 1996) and perhaps by an additional slower mechanism (Just et al. 2001), which all seem to contribute approximately equally to the overall regulatory effect (Moore et al. 1979; Baker et al. 1981; Takenaka et al. 1994; Just et al. 2001). There is abundant evidence that ANGII enhances TGF (Huang & Navar, 1988; Mitchell & Navar, 1988; Schnermann & Briggs, 1989b; Braam & Koomans, 1995), which appears to play a role during physiological adaptation, such as after volume expansion (Schnermann & Briggs, 1990). Accordingly, it is conceivable that ANGII may alter the relative contribution of the mechanisms underlying RBF autoregulation by enhancing the contribution of TGF. Therefore, the aim of the present study was to investigate the role of ANGII in the autoregulation of RBF in response to dynamic changes in RAP. For this purpose, the responses of RBF to rapid pressure steps, as well as to physiological fluctuations in RAP, were investigated in conscious dogs in the presence of normal, reduced and elevated plasma concentrations of ANGII.
METHODS
Experiments (n = 58) were conducted on 23 conscious foxhounds (27–37 kg) in accordance with the national guidelines for the care and use of research animals (Reg. Präs. Karlsruhe license No. 37–9185.81/156/96). The dogs were housed under in an artificial light–dark cycle (06.00–18.00 h light) and were fed a standard diet (SSNIFF Spezialdiäten GmbH, Soest, Germany) with free access to tap water. For more details on the following description of instrumentation, measurements and data handling, see Just et al. (1998b, 2001).
Chronic instrumentation
The dogs were prepared surgically under sterile conditions. After premedication with atropine (0.5 mg s.c., Braun, Melsungen, Germany) and propionylpromazine (0.5 mg kg−1 s.c., Combelen, Bayer, Leverkusen, Germany) anaesthesia was induced by pentobarbital sodium (20 mg kg−1, Nembutal, Sanofi, Libourne Cedex, France) and maintained by halothane (0.8–1.0 %, Fluothane, Zeneca, Planckstadt, Germany) and N2O (0.5 l min−1). Depth of anaesthesia was assessed by repeated testing of the eyelid reflex. At induction of anesthesia, masseter relaxation was also assessed. A left flank incision was made to insert a polyurethane catheter into the abdominal aorta, a silastic catheter into the renal vein and a flow probe (6SS, Transonic, Ithaca, NY, USA) into the left renal artery. Eighteen dogs also received an inflatable occluder in the same renal artery and a second polyurethane catheter with its tip in the vessel distal to the occluder. Catheters and cables exited the animal's neck. Prophylactic antibiotics were given (Tardomycel, Bayer; 3 ml s.c. on days 0, 3 and 6 post surgery) and at least 10 days were allowed for recovery after surgery before experimentation started. Catheters were flushed and refilled with heparinised saline (1700 i.u. ml−1) every second or third day.
Measurements
All experiments were carried out between 07.30 and 11.30 h on dogs that were trained to rest on their right flank. Arterial pressure in the aorta (AP) and RAP were measured from the arterial catheters (Statham P23XL with Gould Pressure Processor). RBF was obtained by an external flow meter (Transonic T106 or T108) with its low pass filter set to 10 Hz. No filter was applied for AP and RAP measurements. In 8 experiments, the air pressure used to control the vascular occluder was also measured by a pressure transducer (Model BTE 4005G0, Sensor-Technics). All data were recorded at 20 Hz on a computer.
Protocols
To investigate autoregulation of RBF both in the time and frequency domain, two methods were employed: (1) analysis of the time course of the adaptive changes in renal vascular resistance (RVR) in response to a rapid increase in perfusion pressure (step response) and (2) calculation of the transfer function between the spontaneous fluctuations in RAP and RBF. Both types of experiment were performed under different experimental conditions, as explained below. Each experiment was conducted on a different day in individual dogs. The order of the experiments was assigned randomly to each individual dog. After administration of an angiotensin converting enzyme (ACE) inhibitor (see ‘Experimental conditions’ below), at least one additional day of recovery was allowed. Not every protocol was performed in every individual, but a control experiment was carried out in every dog.
Step response
RAP was reduced to 50 mmHg for 60 s and was then restored rapidly to systemic AP. The reduction in RAP was achieved by graded inflation of the implanted occluder by hand. This procedure is referred to as ‘pressure reduction’ hereafter. Under each experimental condition, at least three successive pressure reductions were made at 10 min intervals. At the end of each experiment, the renal artery was completely occluded for 30 s to obtain the zero flow offset. For more details, see Just et al. (2001).
Experimental conditions
Control (n = 16)
After a resting period of 10 min, three pressure reductions were made at intervals of 10 min, i.e. 10, 20 and 30 min after the start of the experiment. In four dogs, three further pressure reductions were made at 70, 80 and 90 min after the start of the experiment to check the stability of the results over time. Fourteen of these experiments were identical to those used in the control group in a previous study (Just et al. 2001).
ACE inhibition (n = 8)
To inhibit endogenous ANGII production, dogs received an oral dose of ramipril (Hoechst Marion Roussel, Frankfurt, Germany; 2 mg kg−1 in 20 ml saline) 1 h before the start of control experiments. Experiments commenced with a resting period of 10 min, so that pressure reductions were made 70, 80 and 90 min after ramipril administration and at similar times of the day as in controls.
ACE inhibition + ANGII (n = 8)
To elevate the plasma levels of ANGII above the resting level in the absence of endogenous modulations, the dogs received a constant infusion of ANGII (5 ng kg−1 min−1 in 12 ml saline i.v.), which commenced 40 min after ramipril administration (2 mg kg−1). This dose of ANGII was used because it has been shown by others to elevate plasma ANGII in dogs to a range that is similar to that observed after moderate physiological stimulation by sodium restriction (Olsen et al. 1985). The experiment started 20 min after the start of the ANGII infusion with a resting period of 10 min, so that pressure reductions were made 70, 80 and 90 min after ramipril administration and 30, 40 and 50 min after the start of the ANGII infusion, and at similar times of the day as in the controls. In four dogs, three further pressure reductions were made 70, 80 and 90 min after the start of the experiment (i.e. 90, 100 and 110 min after starting ANGII treatment) to detect potential delayed effects of ANGII.
Transfer function
AP and RBF were recorded continuously for 225 min.
Experimental conditions
Control (n = 13)
The recording was made under the same control conditions as those described above. Eight of these experiments were identical to those used in previous studies (Just et al. 1998b, 1999).
ACE inhihibition (n = 6)
As in the step response experiments, ramipril (2 mg kg−1) was given orally 60 min before the start of recording. To ensure that ACE was inhibited sufficiently for the entire 4 h recording period, an additional dose of 1 mg kg−1 was given 10 min before the start of recording. This regimen has been shown previously to eliminate the pressor effect in response to prolonged reduction in RAP for at least 2 h (Just et al. 1998a).
ACE inhibition + ANGII (n = 7)
An oral dose of ramipril was given 60 min (2 mg kg−1) and 10 min (1 mg kg−1) before the start of recording. A continuous infusion of ANGII (5 ng kg−1 min−1 in 12 ml saline i.v.) was started 20 min before the start of recording.
Data analysis
Step response
The original 20 Hz RBF and RAP data from the step responses were smoothed with a sliding average over 40 values (2 s). RVR was calculated from these data by dividing [RAP − RAP0] by [RBF − RBF0], where RAP0 is the pressure at which RBF ceases and RBF0 is the zero flow offset. RAP0 was assumed to be 16 mmHg in all cases, based on the observed value at the end of the step response experiments in the present and a previous study (Just et al. 2001). The exact time points of the beginning and end of the RAP reductions were either determined by visual inspection of the original 20 Hz RBF data or were automatically determined from the air pressure in the occluder, if available. Based on these time points, mean curves were calculated for all responses in an experiment and then averaged over all dogs in a group. In addition, the following features of the time course of RVR were determined automatically. Baseline (BASE): mean obtained from the last 60 s prior to the pressure reduction. Minimum resistance (MIN): mean obtained from the initial 2.5 s after pressure release. First maximum: maximum value found between 2.5 and 10 s after pressure release after smoothing with a secondary sliding average over 40 of the primary smoothed values mentioned above. Plateau (PLAT): mean obtained between 10 and 25 s after release. Second maximum: maximum found between 25 and 80 s after release after further smoothing by a secondary sliding average over 40 of the primary smoothed values.
To estimate the relative contribution of the first and the second rise of RVR to the total autoregulatory response, the rise of RVR from MIN to PLAT was expressed as a percentage of the total response between MIN and BASE (PLAT% = [PLAT − MIN]/[BASE − MIN] × 100). The same normalisation to the total response was applied to all RVR values of the time courses of each individual pressure reduction (Fig. 1). HR was determined offline, beat by beat, from the 20 Hz AP signal.
Figure 1. Step response of renal vascular resistance (RVR) after sudden release from a reduction of renal artery pressure.
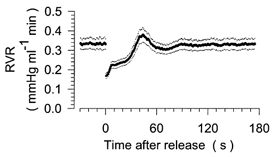
Averaged time course of RVR before and after reduction of renal artery pressure to 50 mmHg for 60 s. The period of pressure reduction is not shown. Time = 0 s corresponds to the time of release from the pressure reduction. Mean (continuous trace) ± s.e.m. (dotted traces) from pooled data of all 16 control experiments.
Transfer function
The 20 Hz data files from the 4 h recordings were digitally low pass filtered (3.5 Hz cut-off, finite-impulse-response, order 50) and then reduced 4-fold to a rate of 5 Hz. These 5 Hz data were split into eight blocks of 8192 data points (∼27 min) each. The transfer spectrum was calculated from [AP − RAP0] and [RBF − RBF0] (each normalized to the respective mean value) by the Blackman-Tukey algorithm. A zero offset of 0 ml min−1 was assumed in 4 dogs in which no vascular occluder had been implanted. After conversion of the gain values into decibels (20log[gain]), a mean spectrum was calculated from the consecutive spectra and averaged for all dogs in a group. Power density spectra of AP were calculated from the same data blocks. Integrated spectral density (iPSD) was derived by adding the spectral densities and multiplying by the size of the frequency range. For all spectra, the DC component and the lowest two frequencies were discarded so that the lowest frequency assessed was 0.0018 Hz.
Statistical analysis
Data from all groups were analysed in a one-way ANOVA for repeated measures, followed by Student-Newman-Keuls post hoc test, using Sigmastat 2.03 (SPSS Inc., Chicago, IL, USA). Normality was tested with the Kolmogorov-Smirnov test and equality of variances was assessed with the Levene-Median test. If data for groups were not normally distributed or had unequal variances, a Kruskal-Wallis one-way ANOVA on ranks was used, followed by Dunn's post hoc test. In all cases, a P value of < 0.05 was considered statistically significant. All values are expressed as mean ± s.e.m.
RESULTS
Step response
Control
The time course of RVR before and after a step reduction in RAP under control conditions is depicted in Fig. 1 for the pooled data of all 16 step response experiments. The 60 s period of RAP reduction is not shown. Accordingly, negative values on the x-axis refer to the time immediately before the RAP reduction, whereas positive values denote the time after release from the reduction step. RVR fell to ∼50 % of the baseline level during the period of RAP reduction. This reflects the maximum vasodilator capacity achieved by means of RBF autoregulation. From this value, RVR returned to baseline with a characteristic time course. Specifically, within the first 10 s after the end of RAP reduction, RVR rose rapidly to ∼70 % of baseline, a change equivalent to 40 % of the total RVR response to RAP reduction, i.e. from baseline RVR to the lowest value immediately after the pressure step. This will be referred to as the first response. Thereafter, RVR increased at a slower rate, which will be called the plateau. At 20–30 s after the pressure step, RVR started to rise rapidly again and, after overshooting to 119 ± 3 % of the baseline level at 39 ± 2 s, it returned to 100 % of the baseline level. This reaction will be referred to as the second response. In Fig. 2A, the time course of RVR is normalised to the total change between the baseline level (100 %) and the lowest level after release of the RAP reduction (0 %). We have shown previously that the second response is eliminated completely by furosemide (frusemide) (Just et al. 2001) and, therefore, provides information about the function of TGF. Since the first response probably reflects the myogenic response, and both responses impinge on the plateau, the level of the plateau provides an estimate of the relative contribution of TGF and the myogenic response to the overall autoregulation of RVR.
Figure 2. Normalized step response of RVR in response to normal, reduced and elevated levels of angiotensin II (ANGII).
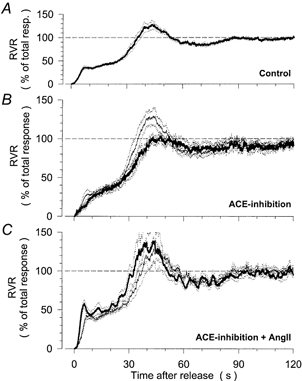
Averaged time course of RVR after release from a reduction of renal artery pressure to 50 mmHg for 60 s. Time = 0 s corresponds to the time of release from the pressure reduction. Values are normalized to the total RVR response between the baseline level before the pressure reduction (100 %) and the minimum level immediately after release (0 %). Mean (continuous traces) ± s.e.m. (dotted traces). A, pooled control response from all 16 control experiments. B, response during control conditions (thin line) and after inhibition of endogenous ANGII formation by ramipril (thick line) in 8 dogs. C, response during control conditions (thin line) and during elevation of plasma ANGII above the resting level by chronic ANGII infusion (5 ng kg−1 min−1) after ramipril treatment (thick line) in 8 dogs.
ACE inhibition
After inhibition by ramipril of endogenous ANGII production, mean RBF was elevated slightly (Table 1), mean RAP was reduced (Table 1) and baseline RVR was decreased (Table 2), although none of these changes was statistically significant. HR was not altered (Table 1). The minimum RVR immediately after release from the RAP reduction (that is, the level of RVR independent of autoregulation) was also unaltered (Table 2). The influence of ACE inhibition on the time course of RVR after release from the RAP reduction is depicted in Fig. 2B. While the general temporal pattern was not affected, the overshoot of the second response was entirely prevented (Table 2). However, the level of the plateau was not altered (Fig. 2B, Table 2).
Table 1.
Baseline haemodynamic data
| Step response experiments | Transfer function experiments | |||||||
|---|---|---|---|---|---|---|---|---|
| Experimental condition | n | RAP (mmHg) | HR (beats min−1) | RBF (ml min−1) | n | RAP (mmHg) | HR (beats min−1) | RBF (ml min−1) |
| Control | 8 | 97 ± 3 | 75 ± 3 | 244 ± 23 | 6 | 100 ± 5 | 74 ± 4 | 192 ± 24 |
| ACE inhibition | 8 | 92 ± 3 | 77 ± 5 | 309 ± 23 | 6 | 91 ± 5 | 80 ± 6 | 231 ± 21 |
| Control | 8 | 91 ± 4 | 74 ± 7 | 281 ± 28 | 7 | 97 ± 3 | 66 ± 2 | 255 ± 33 |
| ACE inhibition + ANGII | 8 | 109 ± 5*† | 75 ± 5 | 218 ± 29 | 7 | 113 ± 3*† | 70 ± 4 | 185 ± 20 |
RAP, mean renal artery pressure. HR, mean heart rate. RBF, mean renal blood flow. RAP and RBF for the step response were derived from the last 60 s before each pressure reduction, while all other values were averaged over the entire recording period. Data are mean ± s.e.m.n, number of animals.
P <0.05 vs. paired control.
P <0.05 vs. ACE inhibition alone.
Table 2.
Characteristics of the step response of renal vascular resistance
| Experimental condition | n | Baseline (mmHg ml−1 min) | Minimum (mmHg ml−1 min) | Plateau (% of response) | Maximum of 1st response (% of plateau) | Maximum of 2nd response (% of baseline) |
|---|---|---|---|---|---|---|
| Control | 8 | 0.38 ± 0.04 | 0.19 ± 0.02 | 35 ± 2 | 93 ± 3 | 119 ± 6 |
| ACE inhibition | 8 | 0.27 ± 0.02 | 0.17 ± 0.01 | 31 ± 4 | 91 ± 2 | 103 ± 2* |
| Control | 8 | 0.29 ± 0.03 | 0.15 ± 0.02 | 45 ± 2 | 98 ± 2 | 120 ± 5 |
| ACE inhibition + ANGII | 8 | 0.48 ± 0.04*† | 0.16 ± 0.02 | 51 ± 4† | 105 ± 3† | 139 ± 17 |
Baseline refers to renal vascular resistance (RVR) before the pressure reduction. Minimum refers to RVR immediately after pressure release. Plateau refers to RVR during the plateau expressed as a percentage of the total response between baseline and minimum. Maximum of the first response refers to the maximum RVR detected 2.5–10 s after release of the RAP reduction, expressed as a percentage of the level of the plateau. Maximum of the second response refers to the maximum RVR detected 25–80 s after pressure release, expressed as a percentage of baseline. Data are mean ± s.e.m.n, number of animals.
P < 0.05 vs. paired control.
P < 0.05 vs. ACE inhibition alone.
ACE inhibition + ANGII
After elevation of ANGII levels above the control by infusion of ANGII after ramipril, mean RAP was elevated while HR remained unchanged (Table 1). The same was true in comparison to data for ACE inhibition alone. The slight reduction in RBF did not reach statistical significance (Table 1), but due to the increase in RAP, baseline RVR was almost twice as high as during control or during ACE inhibition alone (Table 2). Nevertheless, the minimum RVR immediately after release from the RAP reduction was not different from the control nor from data for ACE inhibition alone. The time course of RVR after release from the RAP reduction also remained virtually unchanged after ACE inhibition + ANGII (Fig. 2C, Table 2). The relative level of the plateau was not altered from the control (Fig. 2C, Table 2). The same results were obtained in four dogs, in which the step responses were repeated at 90–110 min after the start of ANGII (data not shown). In these experiments, the plateau was at 54 ± 7 % of the total response, which was nearly identical to the value obtained in control experiments at a corresponding time after the start of the experiment (53 ± 4 %). Minimum RVR after release (0.14 ± 0.02 mmHg ml−1 min), and the degree of overshoot for the first (103 ± 3 % of plateau) and the second response (109 ± 4 % of baseline) during prolonged ANGII infusion were also not different from the respective control experiments (0.13 ± 0.01 mmHg ml−1 min, 104 ± 5 % and 120 ± 9 %).
Although the relative level of the plateau was significantly higher than in traces for ACE inhibition alone (Table 2), it should be noted that these experiments were not made in the same animals and a slight difference was already present between the controls of the two groups (Table 2).
Transfer function
Control
The transfer spectra between the spontaneous fluctuations of RBF and RAP (Fig. 3A) show the same pattern as previously described in several studies on rats and dogs (Daniels et al. 1990; Holstein-Rathlou et al. 1991; Cupples et al. 1996; Just et al. 1998b) In the frequency range below 0.01 Hz, i.e. for slow changes in RAP, the gain displayed low values, indicating the presence of active autoregulation. At frequencies above 0.2 Hz, high gain values were observed, indicative of weak or absent autoregulation. The intermediate frequency range was characterised by two corner frequencies located around 0.03 Hz and 0.1 Hz, respectively. The lower corner frequency has been shown in previous studies (Daniels et al. 1990; Ajikobi et al. 1996; Cupples & Loutzenhiser, 1998; Just et al. 1998b) to reflect the action of TGF, while the higher corner frequency is generally believed to be associated with the function of the myogenic response (Holstein-Rathlou et al. 1991; Cupples et al. 1996; Just et al. 1998b).
Figure 3. Transfer function between renal blood flow (RBF) and arterial pressure (RAP) in response to normal, reduced and elevated levels of ANGII.
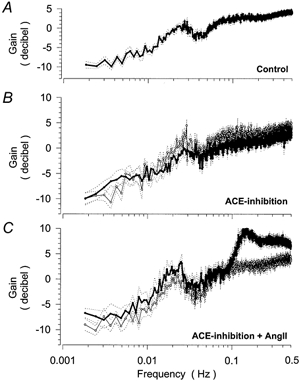
Averaged spectra of the gain of the transfer function between the spontaneous fluctuations of RBF and RAP in resting conscious dogs over 4 h. Gain values are expressed in decibels. Mean (continuous lines) ± s.e.m. (dotted lines). A, pooled baseline spectrum of all 13 control experiments. B, spectra during control conditions (thin line) and after inhibition of endogenous ANGII formation by ramipril (thick line) in 6 dogs. C, spectra during control conditions (thin line) and after elevation of plasma ANGII levels above the resting level by chronic ANGII infusion (5 ng kg−1 min−1) after ramipril treatment (thick line) in 7 dogs.
ACE inhibition
After ramipril, mean RAP was slightly reduced, and mean RBF elevated, while HR remained unchanged (Table 1). In the transfer spectrum, the gain below 0.01 Hz was not altered after ramipril (Fig. 3B, Table 3) indicating maintained autoregulatory efficiency. The lower corner frequency was detected at 0.025 ± 0.001 Hz under control conditions, which was not significantly different from the value after ramipril (0.026 ± 0.001 Hz). The average gain between 0.015 and 0.035 Hz showed a trend for a slight reduction (Fig. 3B, Table 3), which would indicate a diminished resonance of TGF. The higher corner frequency was detected at 0.12 ± 0.02 Hz under control conditions, which was not significantly different after ramipril (0.14 ± 0.01 Hz), and its gain was at most slightly reduced (Table 3). The spectral power of the fluctuations of AP, which represents the driving force for the transfer function, was not significantly different from the control in any of the three frequency ranges investigated.
Table 3.
Characteristics of the transfer function between renal blood flow and renal artery pressure
| Experimental condition | n | < 0.01 Hz (dB) | Lower corner frequency (dB) | Higher corner frequency (dB) |
|---|---|---|---|---|
| Control | 6 | −6.5 ± 1.0 | 0.3 ± 0.6 | 2.5 ± 0.5 |
| ACE inhibition | 6 | −5.7 ± 0.7 | −1.6 ± 0.7 | 0.8 ± 0.4 |
| Control | 7 | −7.5 ± 1.0 | −1.2 ± 0.5 | 2.3 ± 0.6 |
| ACE inhibition + ANGII | 7 | −5.7 ± 1.4 | 0.6 ± 0.6 | 6.2 ± 0.5*† |
Gain values of the transfer function were averaged over the following frequency ranges. < 0.01 Hz (overall autoregulatory efficiency): 0.0018–0.01 Hz. Lower corner frequency (TGF): 0.015–0.035 Hz. Higher corner frequency (myogenic response): 0.06–0.20 Hz. Data are mean ± s.e.m.n, number of animals.
P < 0.05 vs. paired control.
P < 0.05 vs. ACE inhibition alone.
ACE inhibition + ANGII
After elevation of the ANGII plasma levels during ACE inhibition the average gain below 0.01 Hz was not altered compared to the control condition. The lower corner frequency (0.019 ± 0.001 Hz) was also not different from the control (0.021 ± 0.001 Hz). The average gain in this frequency range was slightly but not significantly elevated as compared to the control (Fig. 2C, Table 3). The same was true in comparison to ACE inhibition alone (Table 3). The spectral power of the fluctuations of AP was not significantly altered in this frequency range (8.3 ± 0.8 mmHg) compared to the controls (6.1 ± 0.7 mmHg). The higher corner frequency was located at 0.14 ± 0.01 Hz, which did not differ from the control condition and or from ACE inhibition alone. However, the gain between 0.06 and 0.20 Hz was markedly enhanced compared to control as well as to ACE inhibition alone (Fig. 2C, Table 3), indicating augmented oscillations of the myogenic response. In contrast, the spectral power of the underlying fluctuations of AP in this frequency range was not elevated (21 ± 6 vs. 17 ± 6 mmHg). There was also an elevation of the gain at higher frequencies. This frequency range is currently believed to reflect pressure passive properties of the vasculature (Holstein-Rathlou & Marsh, 1994). Accordingly, the elevated gain may indicate a modulation of the compliance or of the level of pulse wave reflections in this vascular bed.
Discussion
The present results show that despite substantial changes in the mean level of RBF and RVR, the overall autoregulation of RBF is not affected by alterations in ANGII plasma concentrations within the physiological range. The elevation of resting RVR in the face of unchanged minimum RVR after a reduction in renal perfusion pressure indicates that ANGII enhances overall autoregulatory vasoconstriction. However, the susceptibility of the myogenic response and TGF to feedback oscillations (represented by the overshoot of the first and second responses and the gain at the higher and lower corner frequencies) varied slightly with the level of plasma ANGII in the direction expected from micropuncture studies, but this effect was surprisingly small in the case of TGF. Finally, the normalised level of RVR during the plateau phase of the step response was not altered appreciably by the experimental interventions, suggesting that the relative contribution of the myogenic response and TGF (or any other possible mechanisms) to this autoregulatory response is not modulated physiologically by circulating ANGII. In conjunction with the augmentation of the overall autoregulation, this implies that ANGII enhances not only TGF, but also the myogenic response.
Autoregulatory efficiency
During the pressure reductions, RAP was reduced to 50 mmHg (which is below the lower limit of RBF autoregulation (∼65 mmHg) under our experimental conditions; Kirchheim et al. 1987) to allow for complete autoregulatory vasodilatation. Previous studies have shown that the minimum RVR value after the pressure reduction was the same irrespective of whether the reduction period was prolonged for up to 5 min or replaced by a period of complete occlusion (Just et al. 2001). Therefore, the RVR values recorded in the present study probably give a reliable estimate of the smallest RVR that can be achieved by means of the autoregulatory response. Our results showed no significant change in the RVR in response to variations in plasma ANGII levels within a physiological range. Even if there is a slight trend for elevated RVR at higher levels of ANGII, this effect is very small in comparison to the influence on baseline RVR and to the large range of vasodilatation available for the autoregulatory response.
The efficiency of autoregulation was estimated from the gain of the transfer function between AP and RBF in the frequency range below 0.01 Hz. Kinetic studies of the response times of the myogenic response (Clausen et al. 1992) and tubuloglomerular feedback (Daniels & Arendshorst, 1990), as well as the location of corner frequencies in the transfer spectrum (Holstein-Rathlou & Marsh, 1994), indicate that autoregulation is fast enough to exert its full effect in this frequency range. A previous study demonstrated that only part of this regulatory capacity is used under physiological conditions (Just et al. 1998b). Therefore, the gain of the transfer function in the frequency range of 0.0018–0.01 Hz directly reflects the dynamic autoregulatory efficiency, which is active under these conditions in a time range of 2–10 min. This measure was not affected significantly by either experimental intervention. Therefore, neither at the mean level nor during endogenous fluctuations in plasma levels does ANGII appear to affect autoregulatory efficiency under normal conditions. Our data demonstrate that, as for the static response (Abe et al. 1976; Arendshorst & Finn, 1977; Hall et al. 1977; Persson et al. 1988) short-term dynamic autoregulation of RBF is not affected by circulating ANGII under physiological conditions. It should be noted that this finding does not contradict the important modulatory influence of ANGII on the regulation of RBF in the longer term, which becomes active over a time frame of several minutes (Cupples, 1993; Sorensen et al. 2000).
Magnitude of TGF
TGF was assessed from the second RVR response to RAP reduction and the lower corner frequency in the transfer function. The rationale for associating these two features with TGF is based on previous studies in which both the second response (Just et al. 2001) and the lower corner frequency were completely abolished after ureteral occlusion (Daniels et al. 1990), furosemide administration (Ajikobi et al. 1996; Just et al. 1998b) and in the hydronephrotic kidney (Cupples & Loutzenhiser, 1998). Furthermore, the fluctuations in RBF at the lower corner frequency have been found to be accompanied by parallel changes in the velocity of tubular flow and the concentration of chloride in the distal tubular fluid (Holstein-Rathlou & Marsh, 1989). The close correspondence between the response time of the second response (36 s) and the lower corner frequency (0.025 Hz) also suggest that both features are reflecting the same phenomenon.
The trends for enhancement of the overshoot of the second response and the gain of the lower corner frequency at elevated plasma levels of ANGII are compatible with an augmentation of TGF by ANGII. However, this effect was remarkably small (if present at all). When TGF is inhibited directly by furosemide (Ajikobi et al. 1996; Just et al. 1998b) or in the hydronephrotic kidney (Cupples & Loutzenhiser, 1998), the gain in the lower corner frequency range does fall markedly to levels as low as −5 dB.
The small effect of ANGII on the overshoot of the second response and the gain of the lower corner frequency might seem surprising in view of its strong influence on TGF, which is known from micropuncture studies. Such studies have demonstrated an attenuation of TGF after inhibition of ACE (Ploth et al. 1979; Stowe et al. 1979; Schnermann et al. 1984; Mitchell & Navar, 1988), ANGII receptor blockade (Stowe et al. 1979; Ploth & Roy, 1982; Mitchell & Navar, 1988; Welch & Wilcox, 1990; Braam & Koomans, 1995) and in AT1 receptor knockout mice (Traynor & Schnermann, 1999) Conversely, enhanced sensitivity has been found after ANGII infusion (Huang & Navar, 1988; Mitchell & Navar, 1988; Schnermann & Briggs, 1989b; Braam & Koomans, 1995). Similar ANGII-dependent modifications in TGF gain also seem to play a role during physiological adaptations, such as volume expansion (Schnermann & Briggs, 1990). However, the degree of overshoot of a control system (derived in the present study from the second response and the corner frequency) does not depend only on the magnitude of the contribution of the underlying mechanism, but also on the impact of damping factors. Accordingly, possible explanations for these observations would either be a generally small effect of ANGII on the strength of TGF, or a considerable augmentation by ANGII of the strength of TGF, which is balanced by a parallel enhancement of damping factors. In view of the strong evidence for a modulatory effect of ANGII on TGF, mentioned above, as well as on the overall augmentation of autoregulatory vasoconstriction, indicated by the elevation of resting RVR during unaltered minimum RVR, the latter explanation is more likely.
Magnitude of the myogenic response
The gain at the higher corner frequency after ANGII infusion was enhanced markedly, despite the fact that fluctuations in AP were largely unaltered. This finding indicates an enhanced susceptibility to resonance of the myogenic response induced by ANGII. However, as explained above for TGF, these data do not allow us to decide whether this effect is is due to an enhancement of the absolute strength of the myogenic response or a reduction of damping factors. Nevertheless, the marked gain at the higher corner frequency suggests that some augmentation of the absolute strength might be involved.
Balance between myogenic response, TGF and a further possible mechanism
The relative contribution of the myogenic response, TGF and (possibly) an additional slower mechanism (Just et al. 2001) to autoregulation of RBF and, thus, to basal vascular tone under resting conditions was estimated from the level of RVR during the plateau phase of the step response. This was based on the following consideration. During the period in which RAP is reduced below the lower limit of autoregulation, all mechanisms will change to produce their maximum vasodilator signal. After release of the occlusion, all mechanisms will return to baseline levels that are appropriate for the resting level of RAP, but the myogenic response will do so more quickly than the other two. Therefore, at the time of the plateau, the myogenic response will already have adapted to the increase in RAP, while both TGF and the slower mechanism will continue to provide the maximum vasodilator signal appropriate for a RAP of 50 mmHg. Accordingly, if the contribution of the myogenic response is enhanced relative to TGF and the slower mechanism, it will raise the plateau to a higher level. Conversely, if the contribution of TGF and the slower mechanism gained more influence, the RVR would remain at a reduced level during the plateau phase. Consistent with this hypothesis, in a previous study the level of the plateau was found to increase markedly after direct inhibition of TGF by furosemide (Just et al. 2001).
Therefore, to facilitate the estimation of the relative contribution of the myogenic response to autoregulation of RBF, the time courses of the RVR shown in Fig. 1 were normalised to the total response of RVR to RAP reduction, i.e. from baseline RVR to the minimum RVR after pressure reduction. The normalised level of RVR during the plateau was remarkably stable during the experimental modulations of plasma ANGII. Even prolonged exposure to elevated levels of ANGII for more than 1 h did not alter the relative position of the plateau. This indicates that the relative contribution of the myogenic response (and, therefore, the balance to the two other mechanisms) is maintained under these conditions, despite the variation in baseline RVR. It is more difficult to derive an estimate of the relative contribution of TGF to autoregulation of RBF, because the plateau is also affected by an additional mechanism, which is derived from either a slow component of the myogenic response, a different regulatory mechanism or capacitative effects (Just et al. 2001). Whatever the nature of the additional mechanism, under the assumption that this mechanism is either not altered by ANGII or changed to the same extent as the fast component of the myogenic response, it is safe to conclude that the balance of all three mechanisms is not substantially altered in response to different plasma levels of ANGII.
A crucial factor when considering the aforementioned hypothesis is that the myogenic response should be separated sufficiently in time from the other two mechanisms. This seems justified with regard to the constrictor response to a step reduction in perirenal pressure, which was found to have a half-time of 1.16 s and was complete after 2.5 s (Clausen et al. 1992). Similarly, in the juxtamedullary nephron preparation, after non-pharmacological elimination of TGF by papillectomy, the constrictor response of afferent arterioles to a pressure step in the renal artery was complete after 6.3 ± 0.9 s (Walker et al. 2000). In isolated afferent arterioles, the constrictor response to a pressure step reached its maximum after 10 s (Juncos et al. 1995). A slower response time was reported for isolated afferent arterioles by Yip & Marsh (1996), but these authors considered in their discussion that the responses were slower than would be expected from observations in vivo, possibly due to accumulation of nitric oxide. Slower response times of 20–60 s were observed in the juxtamedullary nephron preparation (Carmines et al. 1990; Casellas & Moore, 1993), but in these experiments, TGF was intact, so that the maximum response might have been due to TGF. By contrast, the TGF response to step changes in the tubular perfusion rate comprises an initial delay of 18 s and can take up to 60 s to complete in the rat (Daniels & Arendshorst, 1990; Holstein-Rathlou & Marsh, 1994). Because the TGF response time is largely governed by the length of Henle's loops, these responses are expected to be even slower in the dog. The additional regulatory mechanism that might exist may start immediately, but has a very slow, steady time course of at least 60 s for completion, so that during the time of the plateau it will have restored production of the vasoconstrictor signal by only a negligible degree (Just et al. 2001).
Another concern is that the mechanisms might not be purely additive. The myogenic response and TGF are known to comprise intricate interactions (Schnermann & Briggs, 1989a; Chon et al. 1994; Walker et al. 2000). However, if these interactions are positive (i.e. constriction in one signal induces constriction in the other) and occur at the same time as the direct effect of each mechanism independently, the above hypothesis regarding the level of the plateau will remain valid. To our knowledge, a positive interaction has never been questioned and the temporal congruence of direct response and interaction seems reasonable. By contrast, it is less probable that TGF sends a constrictor signal to the myogenic response at the same time as it produces a vasodilator signal on its own. This does not exclude the possibility that the observed stability of the balance between the mechanisms might be due to such interactions. In fact, this is an appealing explanation.
With the elevation of plasma ANGII in the present study, the mean level of resting RVR rose considerably, while the minimum level of RVR at the end of the pressure reduction step was not significantly affected, indicating that the overall effect of autoregulation-induced vasoconstriction was enhanced. Accordingly, the maintained relative contribution of the myogenic response discussed above implies that, as well as its well-known effect on TGF, ANGII also augmented the strength of the myogenic response, or at least its fast component. Such an augmentation of myogenic vasoconstriction has indeed been described previously for renal microvessels of the hydronephrotic kidney (Kirton & Loutzenhiser, 1998). Although we are not aware of other studies demonstrating such an effect in the renal circulation, enhancement of the myogenic response by ANGII (de Wit et al. 1998) or dietary sodium restriction (Nurkiewicz & Boegehold, 2000) and attenuation of the myogenic response by ACE inhibition (Savage et al. 1999) or AT1-receptor blockade (Nurkiewicz & Boegehold, 2000) have been observed in skeletal muscle microvessels and femoral arteries. We can only speculate about possible intracellular mechanisms that might mediate such an interaction. Possible mechanisms include an enhanced membrane depolarisation or transmembrane influx of Ca2+, altered local distribution of cytoplasmic Ca2+ and an effect on the cascade of calmodulin and myosin light chain phosphorylation or on rho-kinase and Ca2+ sensitivity (Somlyo, 1997; Schubert & Mulvany, 1999).
Limitations
There is a possibility that during the 60 s period of RAP reduction, intrarenal production of ANGII might have affected the RBF response to the subsequent pressure step. Direct comparison of the two experimental groups, which received the ACE inhibitor with or without concomitant ANGII infusion (although not in the same individuals) would be compatible with this view. However, the higher plateau level in the group infused with ANGII (Table 2) suggests that the myogenic response was even more enhanced than TGF and the additional regulatory mechanism(s).
It should be mentioned that ANGII infusion elevated RAP slightly, while the steps were always done from 50 mmHg to determine minimum RVR. In addition, ANGII is known to shift the lower limit of RBF autoregulation to lower pressures (Kirton & Loutzenhiser, 1998; Sorensen et al. 2000). Therefore, the pressure perturbation might not have been exactly comparable under all conditions. However, if such differences in the perturbation did indeed affect the results, the observed stability of the level of the plateau implies that their influence was exactly compensating for any underlying change.
Conclusions
Taken together, the results of the present study demonstrate that a physiological range of ANGII plasma levels does not affect the efficiency of autoregulation of renal perfusion during resting conditions and only very slightly alters the autoregulation-independent component of RVR. In addition to its well known effect on TGF, ANGII also enhances the sensitivity of the myogenic response, so that the relative contribution of the myogenic response to overall autoregulation remains unaltered. Accordingly, the relative contribution of the myogenic response, TGF and a possible further mechanism to autoregulation and resting vascular tone in the kidney is most probably also maintained during exposure to different levels of ANGII.
Acknowledgments
We thank I. Keller, L. Mahl, E. Röbel and A. Klein for their excellent technical help. We thank Hoechst-Marion-Roussel Inc., Frankfurt a.M. for donating ramipril. This study was supported by the German Research Foundation (Ki-151/5-3, 5-4, and Graduiertenkolleg für Experimentelle Nieren- und Kreislaufforschung der Universität Heidelberg).
REFERENCES
- Abe Y, Kishimoto T, Yamamoto K. Effect of angiotensin II antagonist infusion on autoregulation of renal blood flow. American Journal of Physiology. 1976;231:1267–1271. doi: 10.1152/ajplegacy.1976.231.4.1267. [DOI] [PubMed] [Google Scholar]
- Ajikobi DO, Novak P, Salevsky FC, Cupples WA. Pharmacological modulation of spontaneous renal blood flow dynamics. Canadian Journal of Physiology and Pharmacology. 1996;74:964–972. [PubMed] [Google Scholar]
- Arendshorst WJ, Finn WF. Renal hemodynamics in the rat before and during inhibition of angiotensin II. American Journal of Physiology. 1977;233:F290–297. doi: 10.1152/ajprenal.1977.233.4.F290. [DOI] [PubMed] [Google Scholar]
- Baker S, Cohen AJ, Fray JCS, Laurens NJ. Role of calcium and albumin in the autoregulation of renal perfusate flow. Journal of Physiology. 1981;311:1–9. doi: 10.1113/jphysiol.1981.sp013569. [DOI] [PMC free article] [PubMed] [Google Scholar]
- Braam B, Koomans HA. Nitric oxide antagonizes the actions of angiotensin II to enhance tubuloglomerular feedback responsiveness. Kidney International. 1995;48:1406–1411. doi: 10.1038/ki.1995.429. [DOI] [PubMed] [Google Scholar]
- Carmines PK, Inscho EW, Gensure RC. Arterial pressure effects on preglomerular microvasculature of juxtamedullary nephrons. American Journal of Physiology. 1990;258:F94–102. doi: 10.1152/ajprenal.1990.258.1.F94. [DOI] [PubMed] [Google Scholar]
- Casellas D, Moore LC. Autoregulation of intravascular pressure in preglomerular juxtamedullary vessels. American Journal of Physiology. 1993;264:F315–321. doi: 10.1152/ajprenal.1993.264.2.F315. [DOI] [PubMed] [Google Scholar]
- Chon KH, Chen YM, Marmarelis VZ, Marsh DJ, Holstein-Rathlou NH. Detection of interactions between myogenic and TGF mechanisms using nonlinear analysis. American Journal of Physiology. 1994;267:F160–173. doi: 10.1152/ajprenal.1994.267.1.F160. [DOI] [PubMed] [Google Scholar]
- Clausen G, Oien AH, Aukland K. Myogenic vasoconstriction in the rat kidney elicited by reducing perirenal pressure. Acta Physiologica Scandinavica. 1992;144:277–290. doi: 10.1111/j.1748-1716.1992.tb09297.x. [DOI] [PubMed] [Google Scholar]
- Cupples WA. Angiotensin II conditions the slow component of autoregulation of renal blood flow. American Journal of Physiology. 1993;264:F515–522. doi: 10.1152/ajprenal.1993.264.3.F515. [DOI] [PubMed] [Google Scholar]
- Cupples WA, Loutzenhiser RD. Dynamic autoregulation in the in vitro perfused hydronephrotic rat kidney. American Journal of Physiology. 1998;275:F126–130. doi: 10.1152/ajprenal.1998.275.1.F126. [DOI] [PubMed] [Google Scholar]
- Cupples WA, Novak P, Novac V, Salevsky FC. Spontaneous blood pressure fluctuations and renal blood flow dynamics. American Journal of Physiology. 1996;270:F82–89. doi: 10.1152/ajprenal.1996.270.1.F82. [DOI] [PubMed] [Google Scholar]
- Daniels FH, Arendshorst WJ. Tubuloglomerular feedback kinetics in spontaneously hypertensive and Wistar-Kyoto rats. American Journal of Physiology. 1990;259:F529–534. doi: 10.1152/ajprenal.1990.259.3.F529. [DOI] [PubMed] [Google Scholar]
- Daniels FH, Arendshorst WJ, Roberds RG. Tubuloglomerular feedback and autoregulation in spontaneously hypertensive rats. American Journal of Physiology. 1990;258:F1479–1489. doi: 10.1152/ajprenal.1990.258.6.F1479. [DOI] [PubMed] [Google Scholar]
- de Wit C, Jahrbeck B, Schafer C, Bolz SS, Pohl U. Nitric oxide opposes myogenic pressure responses predominantly in large arterioles in vivo. Hypertension. 1998;31:787–794. doi: 10.1161/01.hyp.31.3.787. [DOI] [PubMed] [Google Scholar]
- Hall JE, Guyton AC, Jackson TE, Coleman TE, Coleman TG, Lohmeier TE, Trippodo NC. Control of glomerular filtration rate by renin-angiotensin system. American Journal of Physiology. 1977;233:F366–372. doi: 10.1152/ajprenal.1977.233.5.F366. [DOI] [PubMed] [Google Scholar]
- Holstein-Rathlou NH, Marsh DJ. Oscillations of tubular pressure, flow, and distal chloride concentration in rats. American Journal of Physiology. 1989;256:F1007–1014. doi: 10.1152/ajprenal.1989.256.6.F1007. [DOI] [PubMed] [Google Scholar]
- Holstein-Rathlou NH, Marsh DJ. Renal blood flow regulation and arterial pressure fluctuations: A case study in nonlinear dynamics. Physiological Reviews. 1994;74:637–682. doi: 10.1152/physrev.1994.74.3.637. [DOI] [PubMed] [Google Scholar]
- Holstein-Rathlou NH, Wagner AJ, Marsh DJ. Tubuloglomerular feedback dynamics and renal blood flow autoregulation in rats. American Journal of Physiology. 1991;260:F53–68. doi: 10.1152/ajprenal.1991.260.1.F53. [DOI] [PubMed] [Google Scholar]
- Huang WC, Navar LG. Tubuloglomerular feedback-dependent influence of angiotensin II on the kidney in rats. Proceedings of the National Academy of Sciences Counc Repub China.B. 1988;12:180–185. [PubMed] [Google Scholar]
- Juncos LA, Garvin J, Carretero OA, Ito S. Flow modulates myogenic responses in isolated microperfused rabbit afferent arterioles via endothelium derived nitric oxide. Journal of Clinical Investigation. 1995;95:2741–2748. doi: 10.1172/JCI117977. [DOI] [PMC free article] [PubMed] [Google Scholar]
- Just A, Ehmke H, Toktomambetova L, Kirchheim HR. Dynamic characteristics and underlying mechanisms of renal blood flow autoregulation in the conscious dog. American Journal of Physiology – Renal Physiology. 2001;280:F1062–1071. doi: 10.1152/ajprenal.2001.280.6.F1062. [DOI] [PubMed] [Google Scholar]
- Just A, Ehmke H, Wittmann U, Kirchheim HR. Tonic and phasic influences of nitric oxide on renal blood flow autoregulation in conscious dogs. American Journal of Physiology. 1999;276:F442–449. doi: 10.1152/ajprenal.1999.276.3.F442. [DOI] [PubMed] [Google Scholar]
- Just A, Kirchheim HR, Ehmke H. Buffering of blood pressure variability by the renin-angiotensin system in the conscious dog. Journal of Physiology. 1998a;512:583–593. doi: 10.1111/j.1469-7793.1998.583be.x. [DOI] [PMC free article] [PubMed] [Google Scholar]
- Just A, Wittmann U, Ehmke H, Kirchheim HR. Autoregulation of renal blood flow in the conscious dog and the contribution of the tubuloglomerular feedback. Journal of Physiology. 1998b;506:275–290. doi: 10.1111/j.1469-7793.1998.275bx.x. [DOI] [PMC free article] [PubMed] [Google Scholar]
- Kirchheim HR, Ehmke H, Hackenthal E, Lowe W, Persson P. Autoregulation of renal blood flow, glomerular filtration rate and renin release in conscious dogs. Pflügers Archiv. 1987;410:441–449. doi: 10.1007/BF00586523. [DOI] [PubMed] [Google Scholar]
- Kirton CA, Loutzenhiser R. Alterations in basal protein kinase C activity modulate renal afferent arteriolar myogenic reactivity. American Journal of Physiology Heart and Circulation Physiology. 1998;275:H467–H475. doi: 10.1152/ajpheart.1998.275.2.H467. [DOI] [PubMed] [Google Scholar]
- Mitchell KD, Navar LG. Enhanced tubuloglomerular feedback during peritubular infusions of angiotensins I and II. American Journal of Physiology. 1988;255:F383–390. doi: 10.1152/ajprenal.1988.255.3.F383. [DOI] [PubMed] [Google Scholar]
- Moore LC, Schnermann J, Yarimizu S. Feedback mediation of SNGFR autoregulation in hydropenic and DOCA- and salt-loaded rats. American Journal of Physiology. 1979;237:F63–74. doi: 10.1152/ajprenal.1979.237.1.F63. [DOI] [PubMed] [Google Scholar]
- Navar LG, Inscho EW, Majid DSA, Imig JD, Harrison Bernard LM, Mitchell KD. Paracrine regulation of the renal microcirculation. Physiological Reviews. 1996;76:425–536. doi: 10.1152/physrev.1996.76.2.425. [DOI] [PubMed] [Google Scholar]
- Nurkiewicz TR, Boegehold MA. Reinforcement of arteriolar myogenic activity by endogenous ANG II: susceptibility to dietary salt. American Journal of Physiology – Heart and Circulation Physiology. 2000;279:H269–278. doi: 10.1152/ajpheart.2000.279.1.H269. [DOI] [PubMed] [Google Scholar]
- Olsen ME, Hall JE, Montani JP, Guyton AC, Langford HG, Cornell JE. Mechanisms of angiotensin II natriuresis and antinatriuresis. American Journal of Physiology. 1985;249:F299–307. doi: 10.1152/ajprenal.1985.249.2.F299. [DOI] [PubMed] [Google Scholar]
- Persson P, Ehmke H, Kirchheim H. Influence of the renin-angiotensin system on the autoregulation of renal blood flow and glomerular filtration rate in conscious dogs. Acta Physiologica Scandinavica. 1988;134:1–7. doi: 10.1111/j.1748-1716.1988.tb08452.x. [DOI] [PubMed] [Google Scholar]
- Ploth DW, Roy RN. Renal and tubuloglomerular feedback effects of angiotensin II in the rat. American Journal of Physiology. 1982;242:F149–157. doi: 10.1152/ajprenal.1982.242.2.F149. [DOI] [PubMed] [Google Scholar]
- Ploth DW, Rudulph J, Lagrange R, Navar LG. Tubuloglomerular feedback and single nephron function after converting enzyme inhibition in the rat. Journal of Clinical Investigation. 1979;64:1325–1335. doi: 10.1172/JCI109589. [DOI] [PMC free article] [PubMed] [Google Scholar]
- Savage T, McMahon AC, Mullen A, Tribe RM, Yaqoob MM. Ramipril prevents basal arterial constriction and enhanced myogenic tone in the femoral artery in mildly uraemic normotensive rats. Clinical Sciences (Colch.) 1999;97:233–237. [PubMed] [Google Scholar]
- Schnermann J, Briggs JP. Interaction between loop of Henle flow and arterial pressure as determinants of glomerular pressure. American Journal of Physiology. 1989a;256:F421–429. doi: 10.1152/ajprenal.1989.256.3.F421. [DOI] [PubMed] [Google Scholar]
- Schnermann J, Briggs JP. Single nephron comparison of the effect of loop of Henle flow on filtration rate and pressure in control and angiotensin II-infused rats. Mineral Electrolyte Metabolism. 1989b;15:103–107. [PubMed] [Google Scholar]
- Schnermann J, Briggs JP. Restoration of tubuloglomerular feedback in volume-expanded rats by angiotensin II. American Journal of Physiology. 1990;259:F565–572. doi: 10.1152/ajprenal.1990.259.4.F565. [DOI] [PubMed] [Google Scholar]
- Schnermann J, Briggs JP, Schubert G, Marin Grez M. Opposing effects of captopril and aprotinin on tubuloglomerular feedback responses. American Journal of Physiology. 1984;247:F912–918. doi: 10.1152/ajprenal.1984.247.6.F912. [DOI] [PubMed] [Google Scholar]
- Schubert R, Mulvany MJ. The myogenic response: established facts and attractive hypotheses. Clinical Sciences(Colch.) 1999;96:313–326. [PubMed] [Google Scholar]
- Somlyo AP. Signal transduction. Rhomantic interludes raise blood pressure. Nature. 1997;389:908–911. doi: 10.1038/40002. [DOI] [PubMed] [Google Scholar]
- Sorensen CM, Leyssac PP, Skott O, Holstein-Rathlou NH. Role of the renin-angiotensin system in regulation and autoregulation of renal blood flow. American Journal of Physiology Regulatory Comparative and Integrative Physiology. 2000;279:R1017–R1024. doi: 10.1152/ajpregu.2000.279.3.R1017. [DOI] [PubMed] [Google Scholar]
- Stowe N, Schnermann J, Hermle M. Feedback regulation of nephron filtration rate during pharmacologic interference with the renin-angiotensin and adrenergic systems in rats. Kidney International. 1979;15:473–486. doi: 10.1038/ki.1979.63. [DOI] [PubMed] [Google Scholar]
- Takenaka T, Harrison Bernard LM, Inscho EW, Carmines PK, Navar LG. Autoregulation of afferent arteriolar blood flow in juxtamedullary nephrons. American Journal of Physiology. 1994;267:F879–887. doi: 10.1152/ajprenal.1994.267.5.F879. [DOI] [PubMed] [Google Scholar]
- Traynor TR, Schnermann J. Renin-angiotensin system dependence of renal hemodynamics in mice. Journal of the American Society of Nephrology. 1999;10(suppl. 11):S184–S188. [PubMed] [Google Scholar]
- Walker M III, Harrison-Bernard LM, Cook AK, Navar LG. Dynamic interaction between myogenic and TGF mechanisms in afferent arteriolar blood flow autoregulation. American Journal of Physiology – Renal Physiology. 2000;279:F858–865. doi: 10.1152/ajprenal.2000.279.5.F858. [DOI] [PubMed] [Google Scholar]
- Welch WJ, Wilcox CS. Feedback responses during sequential inhibition of angiotensin and thromboxane. American Journal of Physiology. 1990;258:F457–466. doi: 10.1152/ajprenal.1990.258.3.F457. [DOI] [PubMed] [Google Scholar]
- Yip KP, Marsh DJ. [Ca2+]i in rat afferent arteriole during constriction measured with confocal fluorescence microscopy. American Journal of Physiology. 1996;271:F1004–1011. doi: 10.1152/ajprenal.1996.271.5.F1004. [DOI] [PubMed] [Google Scholar]