

Abstract
The synaptic properties of the immature mammalian cerebellum were studied with a focus on the nicotinic modulation of synaptic transmission. Synaptic currents in Purkinje neurones were recorded using whole-cell patch electrodes applied to cerebellar slices (200 μm thick) obtained from newborn rats at postnatal days 5–10 (P5–P10). When the membrane potential of a Purkinje cell was held at −40 mV, spontaneous synaptic currents occurring in the cell comprised both inward and outward components. The former was glutamatergic and the latter was GABAergic, as confirmed by measuring reversal potentials and by using the specific glutamate and GABA blockers, 6-cyano-7-nitroquinoziline-2,3-dione and bicuculline, respectively. Application of ACh (0.1–1000 μm) from a ‘Y tube’ enhanced the occurrence of both glutamatergic and GABAergic synaptic currents in Purkinje cells. These responses appeared within 1 s after the application of ACh, and they were mimicked by nicotinic agonists (10 μm nicotine, 10 μm cytisine, 10 μm 1,1-dimethyl-4-phenyl-piperazinium iodide, or 10 nm epibatidine), but were sensitive to a specific nicotinic antagonist (1 μm dihydro-β-erythroidine). When the generation of action potentials by cerebellar neurones in the slice preparation was blocked by the addition of TTX (1 μm) to the external saline, these ACh-induced responses almost disappeared. This indicates that the enhanced synaptic activities in Purkinje cells are induced via presynaptic nicotinic receptors on the excitatory and inhibitory interneurones, presumably on the proximal axons or somatodendritic domains of granule cells and basket cells in the cerebellar cortex. Interestingly, these nicotinic effects were remarkable in immature rats (P5–P10), but were barely detectable in older rats (more than 10 days of age), indicating that nicotinic ACh receptors are regulated developmentally and may play a novel role in the maturing cerebellum.
Acute synaptic modulation by the activation of ion-channel-coupled receptors, including the nicotinic ACh receptor (nAChR), is one of the recently discovered, but rather widely distributed, mechanisms underlying neuronal plasticity in the brain (McGehee et al. 1995; Glitsch & Marty, 1999; Vizi & Lendvai, 1999; Hugel & Schlichter, 2000; Kerchner et al. 2001). nAChRs have long attracted attention as the major site of the action of tobacco in the brain (Vizi & Lendvai, 1999). They belong to the superfamily of ligand-gated ion channels (Cordero-Erausquin et al. 2000) and are found throughout the nervous system, including the hippocampus, midbrain and cerebellum (Zhang et al. 1998; Sudweeks & Yakel, 2000; see review by Jones et al. 1999). However, their physiological roles at each brain locus as well as their molecular identities remain to be clarified (Wonnacott, 1997; Cordero-Erausquin et al. 2000). The therapeutic basis of nicotinic agonists for the treatment of certain types of degenerative brain disease is also obscure (Kása et al. 1997; Perry et al. 1999).
Synaptic plasticity or modulations within the well-established neural circuits in the cerebellum have attracted much interest (Daniel et al. 1998; Ito, 1998). Purkinje cells receive two main excitatory afferents, parallel fibres and climbing fibres (Voogd & Glickstein, 1998), and local inhibitory afferents (from basket cells and stellate cells). Synaptic transmission onto the Purkinje cells shows drastic changes under physiological conditions, notably during motor learning (Ito, 1998) or during developmental processes (Crepel, 1982; Kakizawa et al. 2000). Molecular characterization during these processes has recently revealed that precise timing and optimal degrees in the activities of the ion channels coupled with functional receptors are necessary for the development of motor learning (Daniel et al. 1998; Ito, 1998), while in proper cerebellar development, the precise sequence of molecular expression is critical (Goldowitz & Hamre, 1998; Hirai & Launey, 2000). Some of the latter processes may be mediated by ion channel-coupled receptors such as NMDA receptors, kainate receptors, purinergic receptors and nicotinic receptors (Komuro & Rakic, 1993; Role & Berg, 1996; Vitolo et al. 1998; Smith et al. 1999; Harper, 2000).
Recent studies have revealed that in various areas of the nervous system, nAChRs are located primarily on presynaptic sites, including nerve terminals, proximal axons, or somatodendritic domains of the neurone, and regulate neurotransmitter release (Gray et al. 1996; Coggan et al. 1997; Kristufek et al. 1999; Sudweeks & Yakel, 2000). In a specific area of the cerebellum, cholinergic innervation may be present during a certain period of development (Clos et al. 1989) to exert a pivotal influence on the establishment of synaptic connections (Fewell & Smith, 1998; Harper, 2000). In the present study, in which the slice-patch technique (Edwards et al. 1989) and the ‘Y tube’ method for rapid drug application (Murase et al. 1989) were used, the functional properties and distribution of ACh receptors were characterized in the immature cerebellar cortex of the rat.
A preliminary report has appeared elsewhere (Kawa & Kamada, 2000).
METHODS
Slice preparation
All experiments were carried out in accordance with the Guiding Principles of the Physiological Society of Japan. The procedures for preparing and maintaining thin slices from a mammalian brain and for cleaning cells in the slices for patch-clamp recordings have been described in detail elsewhere (Edwards et al. 1989). Briefly, newborn rats at postnatal days 2–16 (P2–P16; Wistar strain, both males and females) were killed by decapitation after ether anaesthesia, and then the cerebellum was quickly dissected out and immersed for a few minutes in ice-cold bicarbonate-buffered saline. The tissue was cut sagittally into thin, 200-μm-thick slices with a vibrating slicer (DSK-1000, Dosaka, Kyoto, Japan).
Each slice was transferred to a storage chamber containing oxygenated (95 % O2, 5 % CO2) normal saline at 30 °C. Cerebellar slices were then transferred to a recording chamber placed on the stage of a Zeiss Axioskop upright microscope. This chamber (volume, ∼1 ml) was continuously perfused with oxygenated saline solution kept at room temperature (23–25 °C). The somata of Purkinje cells, basket cells and granule cells could be identified clearly when viewed with Nomarski optics (Zeiss, Germany) using a long-working-distance, × 40, water-immersion objective lens. In slices from 8- to 16-day-old (P8–P16) animals, the cells chosen for recording were cleaned of debris by gently spraying them with a stream of saline through the tip (10–15 μm diameter) of a nearby ‘cleaning’ pipette and then sucking the resulting debris into the pipette (Edwards et al. 1989). During experiments, the microscopic field was monitored continuously with a video camera (KP-140, Hitachi, Japan) and a picture display (QVM-230, Chuomusen, Japan).
Electrical recordings
Whole-cell current recordings were made from neurones in the cerebellar cortex using patch pipettes with an open resistance of 1.5–2 MΩ and an EPC-7 patch-clamp amplifier with a 3 kHz internal filter (List Electronics, Darmstadt, Germany). Currents and membrane potentials were monitored with an oscilloscope and were recorded on videotape using a PCM/VCR recording device (Sony PCM-501/ES, Japan). Data were digitized at 10 kHz using a Digidata 1200A interface (Axon Instruments, CA, USA) and were also displayed on a pen recorder (Recticorder, Nihon-Koden, Tokyo, Japan).
Patch pipettes were pulled from 1.5 mm capillary glass in two stages using a vertical pipette puller (PC-10, Narishige, Tokyo, Japan), and filled with intracellular solution. Following establishment of the whole-cell recording configuration, stable, long-lasting (> 1 h), tight-seal recordings were possible in most cases. During whole-cell recordings, the access resistance of the electrode was occasionally monitored by applying rectangular voltage pulses (10 mV, 60 ms) and by measuring the capacitative current amplitude. The access resistance usually remained in the range of 2–5 MΩ; the error caused by this in the holding membrane potential was less than 3 mV. If recording conditions such as cell input resistance or access resistance changed or became unstable, the experiment was discontinued. The ground electrode was Ag–AgCl wire, which was connected to the external solution with an agar bridge containing 3 m KCl. Correction of the liquid junction potentials (9.6 mV; inside negative) was determined by introducing 3 m KCl saline into the perfusion chamber.
Solutions and drugs
The saline solution used for slicing and incubation contained (mm): 125 NaCl, 5 KCl, 2 CaCl2, 1 MgCl2, 1.25 NaH2PO4, 25 NaHCO3 and 25 glucose (pH 7.4 when bubbled with 95 % O2 and 5 % CO2). The ‘internal’ (pipette) solution was composed of (mm): 134 CH3O3SCs, 6 CsCl, 10 EGTA, 2 MgCl2, 10 Hepes and 2 Na2-ATP (adjusted to pH 7.3 with CsOH). The estimated equilibrium potential for Cl− under the present experimental conditions is −67 mV. Synaptic currents in Purkinje cells were usually recorded at a holding potential of −40 mV, because excitatory and inhibitory synaptic currents at this potential appeared distinctly as inward and outward currents, respectively (see Figs 2 and 3). To block GABAergic postsynaptic currents, bicuculline methiodide (BCC, 10 μm; Sigma, USA) was added to the external solution, while to block glutamatergic postsynaptic currents, 6-cyano-7-nitroquinoziline-2,3-dione (CNQX, 5 μm; RBI, Germany) was added to the external solution. In some experiments, to block the generation of sodium-action potentials, TTX (1 μm; Sigma, USA) was applied to the external solutions. Occasionally, atropine sulphate (1 μm; Merck, Germany) was added to reduce muscarinic involvement.
Figure 2. ACh-induced excitatory and inhibitory synaptic currents in Purkinje cells.

Aa, a specimen record in a Purkinje cell showing an abrupt increase in the frequency of postsynaptic currents for both inward and outward directions after the application of ACh (100 μm) to the cell. The horizontal bar at the top shows the electrical pulse operating the ‘Y tube’ for the application (upward ‘on’). In b, the early part of the current response is expanded. The Purkinje cell was obtained at P6, and the holding potential was −40 mV. B, isolation of inward and outward synaptic currents by specific antagonists. Purkinje cells were at P8. a, in the presence of the selective AMPA receptor antagonist 6-cyano-7-nitroquinoziline-2,3-dione (CNQX, 5 μm), spontaneous inward currents as well as ACh-enhanced inward currents were blocked, while the outward components remained almost intact. b, the GABAA receptor antagonist bicuculline (BCC; 10 μm), completely blocked ACh-enhanced outward currents, while leaving the inward components almost intact. C, analysis of the latency of current responses in a Purkinje cell when chemicals were applied using the ‘Y tube’. The latency of the GABA-induced outward currents (b) and that of the ACh-induced synaptic currents (c) in the Purkinje cell with the same settings for the ‘Y tube’ (Ca) are shown. The former was 125 ms (indicated by an arrow on the trace), indicating that this duration is necessary for the medium to reach the cell (‘travelling time’). Similarly for the ACh-induced synaptic currents, most of the latency observed accounts for the ‘travelling time’ (marked with an arrow).
Figure 3. ACh-induced synaptic currents and membrane currents in developing Purkinje cells.
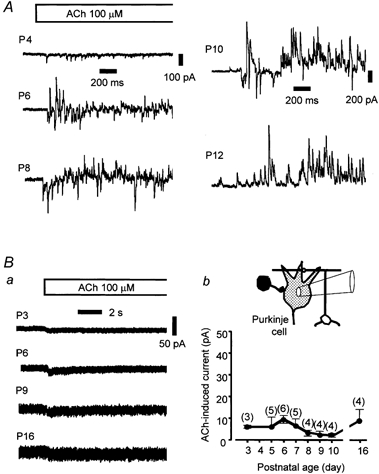
A, specimen records of ACh-induced synaptic currents in Purkinje cells at various ages. The age of the cells is indicated on each record (P4, P6, P8, P10 and P12). During the time indicated by the bar at the top, ACh (100 μm) was applied from the ‘Y tube’ in control saline. The holding potential was −40 mV. Ba, ACh-induced inward membrane currents in the presence of the glutamatergic and GABAergic blockers CNQX (5 μm) and BCC (10 μm), respectively. During the time indicated by the bar at the top, ACh (100 μm) was applied from the ‘Y tube’. Four specimen records from P3, P6, P9 and P16 cells are shown with age on each trace. The holding potential was −40 mV. b shows a summary of ACh-induced inward currents in immature Purkinje cells. Averages for the peak amplitudes of the inward currents and their s.e.m. from three to six cells are plotted against the age of the animals. The holding potential was −40 mV. ACh (100 μm) was applied from the ‘Y tube’. The number of cells tested is shown in parentheses. There were no significant differences among the average values (P > 0.05).
Drugs were applied using a rapid-application technique known as the ‘Y tube’ method (Murase et al. 1989). Throughout an experiment, the delivery tube outlet was positioned about 150 μm from the cell being recorded. The diameter and length of the delivery tube were 300–500 μm and 1.4 mm, respectively. The other conditions for the ‘Y tube’, namely, the negative pressure required to suck the perfusate through the tube (350–700 mmH2O), the inlet tube diameter and length (1 mm and 20 cm, respectively) and those of the outlet tube (1.4 mm and 60 cm, respectively), were determined by trial and error to attain stable conditions for the experiments. The magnetic valve of the ‘Y tube’ system was controlled by a programmable pulse generator (SEN-3201, Nihon-Koden, Tokyo, Japan).
The following agents were also added to the external perfusion solution in specific experiments: acetylcholine chloride (0.01–1000 μm), (−)-nicotine (10 μm), cytisine (10 μm), 1,1-dimethyl-4-phenyl-piperazinium iodide (DMPP, 10 μm), epibatidine (0.01 μm), α-bungarotoxin (α-BgTX, 100 nm), methyllycaconitine citrate (10 nm), dihydro-β-erythroidine hydrobromide (DHβE, 1 μm), and (±)-muscarine chloride (20 μm). These drugs were obtained from RBI (USA) or Sigma (USA). The drugs were made up as solutions and kept frozen in aliquots, and were thawed just before each experiment. CNQX was dissolved in DMSO (Wako, Japan) at a concentration of 5 mm and added to the perfusing saline at a final concentration of 5 μm. Care was taken to shield the solution from light.
Intracellular staining with Lucifer Yellow
Lucifer Yellow CH dilithium salt (Sigma, USA) was added to the intracellular saline (final concentration of 2 mg ml−1) and allowed to diffuse into the neurone from the patch electrode in the whole-cell mode. After measuring postsynaptic currents or the ACh sensitivity of the cell, the slice preparation was transferred to a glass plate and covered with a thin coverglass slip for observation with the aid of an epifluorescence microscope (objective, × 20 or × 40; Diaphot-TMD, Nikon, Japan). To avoid increases in background fluorescence, no fixatives were used. Instead, the field of view of the stained neurone was immediately photographed.
Data are presented as the mean ± s.e.m. unless indicated otherwise.
RESULTS
Postnatal development of Purkinje cells
Purkinje cells in the cerebellum are among the most well-described neurones in terms of their characteristic morphology, functions and developmental changes (Daniel et al. 1998; Goldowitz & Hamre, 1998). In order to evaluate the functional states of synaptic activity in immature Purkinje cells (P2–P12), in the present study spontaneous synaptic currents in Purkinje cells were recorded in the control external solution (Fig. 1). As specimen records show, occurrences of EPSCs and IPSCs at the postnatal age of 2–4 days (P2–P4) were low, less than 1 s−1 (Fig. 1A), and gradually increased to 6.6 ± 1.2 Hz (n = 4) for EPSC and 17.6 ± 2.4 Hz (n = 4) for IPSC at P12. A summary of recordings during postnatal development is shown in Fig. 1B. As can be seen in that figure, increases of about 15-fold and more than 100-fold in EPSC and IPSC frequencies, respectively, occurred over a period of 10 days, from P2 to P12. These spontaneous synaptic events include both action potential-dependent postsynaptic currents and action potential-independent miniature postsynaptic currents. To assess the contribution of miniature EPSCs and IPSCs, the frequencies of the events were measured in the presence of TTX (1 μm), a blocker of action potential generation. The average frequencies of miniature EPSCs and IPSCs at P2 were 0.06 ± 0.06 and 0.1 ± 0.1 Hz (n = 4), respectively; they increased to 1.4 ± 0.3 and 1.5 ± 0.6 Hz (n = 4) at P8, and further to 3.3 ± 1.0 and 3.2 ± 1.0 Hz (n = 4) at P12. Generally, the frequency of occurrence of miniature synaptic currents during early development is low (3 Hz or less at P2–P12), and the abrupt increase in frequency observed during this period presumably reflects the rapid formation or maturation of presynaptic terminals of both excitatory (including climbing fibres and mossy fibres) and inhibitory axons on Purkinje cells.
Figure 1. Postnatal development of Purkinje cells.
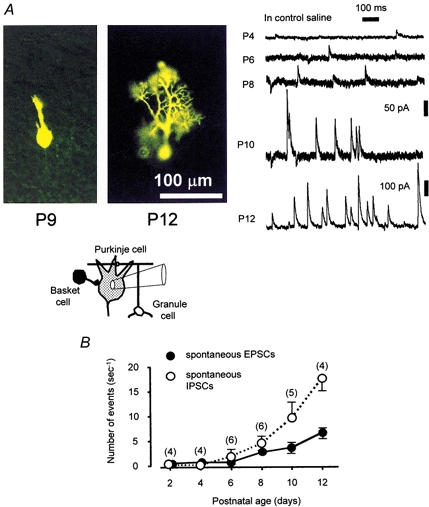
A, left, epifluorescence micrographs of immature Purkinje cells obtained after intracellular injection of the fluorescent dye Lucifer Yellow into the cells via a whole-cell pipette. Cells are in sagittal cerebellar slices (200 μm) obtained from newborn rats on postnatal day 9 (P9; left) and day 12 (P12; right). The scale bar (100 μm) refers to both micrographs. The inset shows a diagram of the experimental setup. Right, specimen records of spontaneous synaptic currents in immature Purkinje cells. The ages of the animals (postnatal days) are shown on the left of the traces. The current calibration of 50 pA applies to the four upper traces of P4, P6, P8 and P10. The holding potential was −40 mV. B, summary of changes in the frequencies of spontaneous EPSCs and IPSCs for Purkinje cells. Each circle represents the mean frequency of events in 4–6 cells in control saline (recording time, 50 s). Error bars represent s.e.m.; the number of cells tested is given in parentheses.
During this period of development, Purkinje cells extend their dendrites rigorously into the molecular layers to receive inhibitory and excitatory synaptic inputs from the surrounding neurones (Altman & Bayer, 1978). At P6–P7, Purkinje cells stained with Lucifer Yellow had short sparse dendrites (10–15 μm in length) on the apical side of the soma. At P8–P9, the cells extend their major dendrites up to 50–60 μm into the molecular layer, and arborization develops further (as shown in P9 and P12 of the micrographs in Fig. 1).
Characterization of ACh-induced synaptic currents
In Purkinje cells in the cerebellar slice preparation, when extracellular saline containing 100 μm ACh was perfused locally from the ‘Y tube’, the membrane currents at the holding potential of −40 mV showed abrupt inward and outward deflections. The traces in Fig. 2A are representative of the cells at P6. These deflections are the concurrent excitatory and inhibitory synaptic currents generated in the Purkinje cell, as judged from the fast rise time and characteristic decay of the responses. When CNQX (5 μm), a specific glutamatergic blocker of the AMPA-type receptor, was added to the extracellular saline, only outward current deflections were evoked by ACh (Fig. 2Ba, at P8). The inward currents were thus sensitive to CNQX, which suggests that these components were generated by glutamatergic excitatory synaptic inputs, namely, from parallel fibres or climbing fibres to the Purkinje cells (Llano et al. 1991). When BCC (10 μm), a specific blocker of the GABAA-type receptor, was added to the extracellular saline, ACh induced only inward current deflections (Fig. 2Bb, at P8), suggesting that these components were generated by GABAergic inhibitory synaptic inputs from adjacent interneurones such as basket cells or stellate cells. The synaptic currents usually appeared after an apparent delay of 100–150 ms from the turning-on of the magnetic valve (Fig. 2Ca). The delay varied from cell to cell within the range of 50 ms, depending on the altered adjustment of the ‘Y tube’. It is likely that most of the delay can be explained by the ‘travelling time’ of the applied saline through the ‘Y tube’, since another application of GABA (Fig. 2Cb) or high-potassium saline (containing 20 mm K+; data not shown) with the same system revealed a similar delay in the current response (with a time resolution of about 10 ms). Thus, in the subsequent study the latency of the response in the cell was not quantified further. Instead, the magnitude of the response of the cell, including the number of synaptic events induced or the peak amplitude of the membrane current evoked in the cell, was investigated.
Figure 3A shows specimen records of ACh-induced synaptic currents in Purkinje cells at various ages (P4–P12) recorded in normal extracellular saline. For observing the effects of ACh on the facilitation of synaptic currents, Purkinje cells at P6–P10 were most obvious and stable, and thus were used frequently in the analyses described herein. In the presence of CNQX (5 μm) and BCC (10 μm), no measurable synaptic currents were apparent in the Purkinje cells during an application of 10 μm ACh. In some Purkinje cells, however, ACh induced other types of inward current that had a small amplitude and slow decay time. The currents were more apparent at a higher dose of ACh (100 μm; Fig. 3Ba). These findings suggest that the currents are induced by a direct effect of ACh on Purkinje cells, presumably through the activation of nAChRs on the cell bodies. To assess the magnitudes of and developmental changes in the currents, recordings from several Purkinje cells at various postnatal ages (P3–P16) were made, and the results are shown in Fig. 3Bb. As can be seen in the graph, the amplitudes of the currents were small, usually less than 10 pA, and there were no significant changes in the amplitude from the ages of P3 to P16 (P < 0.05). Further study is needed to characterize the currents.
In the following experiments, if a Purkinje cell showed such directly evoked currents with a peak amplitude of more than 10 pA, these synaptic currents were not analysed, to avoid complicating the results. In cerebellar slices from animals older than 10 days (i.e. P12 and P14), the responses of ACh-induced synaptic currents from Purkinje cells were smaller than those observed in slices from younger animals. In slices from 16-day-old animals, ACh up to a concentration of 100 μm failed to induce observable responses in either excitatory or inhibitory synaptic currents (three cells in three slices). In subsequent experiments, rats at P5–P10 were used, with major analyses at P8–P9, and the responses induced by ACh at 10 or 100 μm were investigated. Under these conditions, repeatable and stable responses to ACh were obtained for more than 1 h. In a few cases, recordings were made from P2–P4 preparations (Figs 1 and 3).
The reversal potentials of excitatory or inhibitory synaptic currents were studied at various holding potentials after isolation by adding either 10 μm BCC or 5 μm CNQX. The mean reversal potential of the EPSCs was estimated, by plotting and interpolating the average amplitude of the currents in the presence of BCC to be −7 ± 2 mV (n = 3). This value is within the range estimated for rat Purkinje cells (Llano et al. 1991). The mean reversal potential of the inhibitory synaptic currents was similarly estimated in the presence of CNQX to be −65 ± 2 mV (n = 3). The value almost coincides with the estimated equilibrium potential for Cl− (−67 mV), suggesting that the major ion involved in the currents was Cl− and that cable properties disturbing the measurements were negligible in the present conditions.
Next, TTX was added to the external saline to eliminate the generation of action potentials in the preparation. In the presence of TTX (1 μm) and BCC (10 μm), spontaneous inward synaptic currents with larger amplitudes (> 230 pA) disappeared, and minimal currents with an average of 88 ± 87 pA (mean ± s.d., n = 24) remained (i.e. miniature synaptic currents; data at P8). Under this condition, the application of ACh (100 μm) from the ‘Y tube’ to the Purkinje cell evoked only small inward synaptic currents with reduced frequency (Fig. 4). Similar results were obtained from two other animals at P8. These results suggest strongly that the facilitatory effect of ACh on EPSCs depends upon the generation of action potentials in the cerebellar neurones, and thus that the sites of action of ACh are the soma, proximal axons and/or dendrites of granule cells. The presence of functional ACh receptors on the nerve terminals, if any, is negligible in the present preparation.
Figure 4. Sensitivity of ACh-induced EPSCs to TTX.

A, ACh-induced EPSCs in control saline (a) and those in the presence of 1 μm TTX (b) were recorded from a P8 cell. TTX suppressed the occurrence of ACh-enhanced EPSCs almost completely. This suggests that the effects of ACh depend upon the generation of action potentials in presynaptic neurones. The upper horizontal bar shows the electrical pulse operating the ‘Y tube’. B, EPSC interval distribution of the cell in a cumulative probability histogram. The inset shows corresponding curves on an expanded time scale. Continuous- and dashed-line curves represent the values in the presence and absence of TTX, respectively. The difference between the curves was significant (P < 0.001, Kolmogorov-Smirnov test). BCC (10 μm) and atropine (1 μm) were added to the external saline to remove GABAergic and muscarinic effects from the preparation. C, amplitude histogram of the EPSCs induced by ACh (100 μm) in control saline (a) and in the presence of TTX (1 μm; b). The holding potential was −40 mV.
For the inhibitory synaptic currents, a similar dependence of ACh-induced synaptic activities on the action potentials was observed (Fig. 5). In the presence of TTX (1 μm) and CNQX (5 μm), spontaneous outward synaptic currents with larger amplitudes (> 80 pA) disappeared and minimal currents with an average of 36 ± 16 pA remained (mean ± s.d., n = 14, at P8). Under this condition, the application of ACh (100 μm) from the ‘Y tube’ to the Purkinje cell evoked only small outward synaptic currents with reduced frequency (Fig. 5). Similar results were obtained from one other animal at P8. These results suggest that ACh also acts on the soma, proximal axons and/or dendrites of the presynaptic GABAergic neurones (i.e. basket cells or stellate cells).
Figure 5. Sensitivity of ACh-induced IPSCs to TTX.

A, ACh-induced IPSCs in control saline (a) and in the presence of 1 μm TTX (b). Recordings are from a P8 cell. TTX clearly suppressed the occurrence of ACh-enhanced IPSCs. The effects of ACh thus depend upon the generation of action potentials in presynaptic neurones. The upper horizontal bar shows the electrical pulse operating the ‘Y tube’. B, the IPSC interval distribution in a cumulative probability histogram. The continuous line shows the response to ACh (100 μm), while the dashed line represents the effects of ACh in the presence of TTX (1 μm). The difference between the two curves in B is statistically significant (P < 0.01, Kolmogorov-Smirnov test). CNQX (5 μm) and atropine (1 μm) were added externally. C, amplitude histogram of the IPSCs induced by ACh (100 μm) in control saline (a) and in the presence of TTX (1 μm; b). The holding potential was −40 mV.
The decay time course of the synaptic currents is apparently faster for EPSCs than for IPSCs when compared in slices from rats of the same age (P8, Fig. 2B). This is consistent with previous reports that glutamatergic currents of the AMPA type decay faster than GABAergic currents in the central nervous system (Edwards et al. 1989). The time course and peak amplitude of the excitatory synaptic currents, however, seem to be more liable to distortion by differences in the cable properties of the recording site and the synaptic site (Major et al. 1994), since the excitatory synapses are located on the dendritic domain, while the inhibitory synapses are located on the basal portion of the soma (Oberdick et al. 1998). During development, neurones may change considerably their geometry (Fig. 1A) and the composition of their receptor subunits. In the present study, individual synaptic currents occasionally showed irregular variation in their time course or peak amplitude (Figs 2 and 3), presumably due to these factors combined. In subsequent analyses of both EPSCs and IPSCs, synaptic activities were evaluated primarily by the frequency of events above noise level (> 2 pA), and evaluation of the synaptic current time courses was left for another study.
Pharmacological characterization of the ACh-induced responses
A dose–response relationship for ACh-induced synaptic currents was obtained by applying various doses of ACh to the identified Purkinje neurones at intervals of more than 300 s. Figure 6Aa shows specimen records at P8. Figure 6Ab shows a summary of the dose-response relationship of the effects of ACh on the glutamatergic activity of four cells at P7–P8. The extracellular saline contained 10 μm BCC to block GABAergic synaptic events. At 0.1 μm ACh, EPSC frequency increased remarkably by about six-fold from the control resting value. At higher concentrations, the increase in frequency became larger. The overall relationship illustrated in the graph of Fig. 6Ab deviated from the sigmoid curve expected for a simple stoichiometric interaction between the agonist and the receptor. Although this is not conclusive evidence, it is consistent with the idea that the site of action of ACh may not be at nerve terminals, and that the non-linear conversion of excitatory signals via the generation of action potentials is involved (see Fig. 4). Other possible factors causing a non-sigmoidal relationship include multiple components in the agonist concentration–response relationships observed for nicotinic receptors (Covernton & Connolly, 2000).
Figure 6. Concentration–response relationships of ACh-induced synaptic currents.

Aa, specimen records of ACh-induced EPSCs in a P8 Purkinje cell at various doses of ACh. To eliminate GABAergic synaptic currents, all records were obtained in the presence of 10 μm BCC. During the time indicated at the top, ACh (0.1–1000 μm) was applied from the ‘Y tube’. ACh at 0.1 μm produced a remarkable increase in EPSC frequency, and the increase became larger at higher concentrations. In the presence of 10 μm BCC and 5 μm CNQX, ACh, even at 1000 μm, induced no observable synaptic currents in the cell (lowermost trace), confirming that these inward synaptic currents are CNQX-sensitive glutamatergic currents. The holding potential was −40 mV. Ab, summary of the dose-response relationship in ACh-induced EPSCs. EPSCs were observed in four cells at P7–P8 in the presence of 10 μm BCC. At each dose of ACh, the number of EPSCs evoked in a Purkinje cell was counted during the first 5 s of ACh application, and the value was normalized to that obtained with 10 μm ACh (double circles). The filled circles are the means of these normalized values, which are plotted against the doses of ACh. Horizontal bars indicate the s.e.m.Ba, specimen records of ACh-induced synaptic currents at various doses of ACh in a P8 Purkinje cell. To reduce glutamatergic synaptic currents, all records were obtained in the presence of 5 μm CNQX. ACh at 0.1 μm or higher remarkably increased IPSC frequency. In the presence of 10 μm BCC and 5 μm CNQX, ACh, even at 1000 μm, induced no obvious synaptic currents in the cell (bottom trace), confirming that these inward synaptic currents are BCC-sensitive GABAergic currents. The holding potential was −40 mV. Bb, summary of the dose-response relationship (mean ± s.e.m.) in ACh-induced IPSCs. IPSCs were obtained from four Purkinje cells at P7–P8 in the presence of 5 μm CNQX. Other procedures used to produce these plots are similar to those described in A.
Figure 6Ba shows specimen records at P8 and a summary of the the effects of ACh on GABAergic synaptic activity from four cells at P7–P8. To block glutamatergic synaptic events, 5 μm CNQX was added to the extracellular saline. At 0.01 μm ACh, EPSC frequency increased by about three-fold from the control resting value. At higher concentrations, the increase in frequency became larger. The overall relationship again deviated remarkably from a simple sigmoid relationship, suggesting that multiple components and/or non-linear conversion of excitatory signals are involved. The difference in the dose–response relationship between EPSCs and IPSCs may have resulted from distinct AChR subunits involved or varied excitabilities of the presynaptic neurones, or both. Further studies are needed to determine the reason for this difference. It should be noted that a remarkable diversity in the subunit compositions of nAChRs has been shown to exist among functionally similar neurones in the rat midbrain nuclei (Klink et al. 2001), and further that multiple components in the dose-response relationships may appear in the combination of nAChRs (Buisson et al. 2000; Covernton & Connolly, 2000).
To characterize pharmacologically the ACh receptors mediating these responses, the effects of specific agonists of nicotinic ACh receptors in the presence of either 10 μm BCC or 5 μm CNQX were examined (Fig. 7). As shown in Fig. 7Aa, DMPP (10 μm) elicited similar excitatory synaptic currents in Purkinje cells to those elicited by ACh. The effects of other nicotinic agonists, including nicotine (10 μm), cytisine (10 μm) and epibatidine (0.01 μm), are shown in Fig. 7Ab. As for IPSCs, DMPP (10 μm) also elicited similar synaptic currents to those elicited by ACh. The effects of other nicotinic agonists, including nicotine (10 μm), cytisine (10 μm) and epibatidine (0.01 μm), are shown in Fig. 7Bb. A comparison of the potencies of the actions of nicotinic agonists (each used at 10 μm except for epibatidine, which was used at 0.01 μm) on EPSCs and those on IPSCs showed that there is a significant difference in the potency profiles. For EPSC generation, nicotine and cytisine are significantly less potent than other agonists (P < 0.05), while for IPSC generation, epibatidine was significantly less potent (P < 0.05). This may result from variations in molecular subtypes of nAChRs or in the chemical excitabilities between the neurones involved (i.e. variation in nicotinic receptor subtypes or densities present on granule cells and inhibitory interneurones).
Figure 7. Effects of nicotinic agonists on ACh-induced responses.

Aa, representative trace of 1,1-dimethyl-4-phenyl-piperazinium iodide (DMPP)-induced EPSCs in a P8 Purkinje cell. To isolate EPSCs, BCC (10 μm) was added to the external perfusing saline. The holding potential was −40 mV. Ab, the effects of various nicotinic agonists on EPSCs from cells at P7–P9 (n = 3–5) are shown. The number of agonist-induced EPSCs was counted during the first 10 s of agonist application, and the values from each Purkinje cell were normalized to that for ACh (10 μm). The potencies of nicotine and cytisine were significantly lower than that of ACh (P < 0.01, Student's t test). Bars indicate the s.e.m.Ba, DMPP-induced IPSCs in a P8 Purkinje cell. To isolate IPSCs, CNQX (5 μm) was added to the external saline. The holding potential was −40 mV. Bb shows the summary of the potency with which the nicotinic agonists induce IPSCs at P7–P9. The effect of epibatidine was significantly lower than that of ACh (P < 0.01, Student's t test). Bars indicate the s.e.m. In some experiments, atropine (1 μm) was also added, but no resulting difference in the response was observed. The electrical pulse operating the ‘Y tube’ is depicted above the traces in A and B.
In some experiments, atropine (1 μm) was added to the external saline to remove the muscarinic effects of ACh, if any. The responses to ACh showed no significant differences from those shown in Fig. 7A and B. In other experiments, muscarine (20 μm) was applied from the ‘Y tube’ to the slice to assess the muscarinic effects on the cerebellar neurones. However, no major effects were observed in Purkinje cells at P6–8 (for application period 15 s; n = 4). These results suggest that ACh receptors are nicotinic and that the contribution of muscarinic components is negligible.
Next, the effects of specific nicotinic antagonists on the ACh-induced responses of EPSCs and IPSCs were investigated (Fig. 8). Each slice was perfused with the antagonist via the ‘Y tube’ for more than 6 min before each experiment. Representative traces in Fig. 8Aa show that in the presence of DHβE (a non-specific nicotinic antagonist, 1 μm), the frequency of occurrence of EPSCs in response to ACh was reduced to about 24 % of the control value (n = 3). In contrast, in the presence of α-BgTX (100 nm), a specific blocker of the α7 subunit type, responses to ACh showed no significant change (P > 0.05). Methyllycaconitine (10 nm), another specific blocker of the α7 subunit type, also showed no significant effects on the ACh response (n = 2). The preincubation time of the blocking agents was 6 min. Representative traces in Fig. 8Ba show that in the presence of DHβE, the frequency of ACh-induced IPSCs was about 16 % of those induced without DHβE (n = 3). In contrast, responses to ACh showed no significant changes in the presence of α-BgTX (100 nm; n = 3) or methyllycaconitine (10 nm; n = 2). These results suggest that the ACh receptors involved in the activation of EPSCs and IPSCs are both nicotinic and that the receptors consist of α-BgTX-resistant subunits, possibly non-α7 subunits. It must be considered, however, that the blocking effects of α-BgTX or methyllycaconitine on nAChR were fast in some preparations (rat intracardiac ganglion, within 2 min; Cuevas & Berg, 1998) but seemed to be slow in others (rat hippocampal neurones, about 25 % blockage in 5 min; Frazier et al. 1998). These observations must be checked further in the developing cerebellum in conjunction with histological methods using fluorescein-labelled α-BgTX.
Figure 8. Effects of nicotinic antagonists on ACh-induced responses.

The slice was perfused with an antagonist via the ‘Y tube’ for more than 6 min before each experiment. Aa, representative traces of ACh-induced EPSCs before (upper trace) and after (lower trace) an application of the nicotinic antagonist, dihydro-β-erythroidine hydrobromide (DHβE, 1 μm). Data are from a P8 Purkinje cell clamped at −40 mV. To isolate EPSCs, BCC (10 μm) was added to the external saline. The electrical pulse operating the ‘Y tube’ is depicted above the traces in A and B. Ab shows a summary from three Purkinje cells at P8, illustrating the mean and s.e.m. (error bar) of the normalized numbers of ACh-induced EPSCs (counted for 10 s). Note that DHβE (1 μm) reduced the response significantly (P < 0.05, Student's t test), but α-bungarotoxin (α-BgTX, 100 nM), a specific blocker of the α7-subunit nicotinic ACh receptor (nAChR), caused no significant changes. B, effects of DHβE (1 μm) and α-BgTX (100 nM) on ACh-induced IPSCs. Ba, representative traces from a P8 Purkinje cell before (upper trace) and after (lower trace) an application of DHβE (1 μm). To isolate IPSCs, CNQX (5 μm) was added to the external saline. The holding potential was −40 mV. Bb shows a summary from three P8 Purkinje cells. DHβE (1 μm) reduced the response significantly (P < 0.05, Student's t test), but α-BgTX (100 nM) caused no significant changes.
Nicotinic receptors on granule and basket cells
In order to determine the presence and properties of nicotinic ACh receptors on granule cells and basket cells, the ACh-induced membrane currents were recorded from the soma of these neurones, which were visualized with the aid of Nomarski optics. In some cases, these neurones were stained by adding Lucifer Yellow (0.2 %) to the intracellular pipette solution. A typical result from a basket cell presented in Fig. 9A shows the definite location of its soma on the border between the molecular layer and Purkinje cell layer, and specific axonal arborization that surrounds Purkinje cells, as described previously (Southan & Robertson, 1998). Figure 9B shows a representative trace of extracellular recordings from a basket cell. The remarkable generation of spike-like action potentials in the cell in response to ACh (100 μm) applied using a ‘Y tube’, can be seen. In whole-cell recordings in other basket cells, ACh (100 μm) induced distinct inward currents with peak amplitudes of 3–25 pA. At a higher concentration of ACh (1000 μm), the amplitude of the evoked currents increased and the decay time course became faster (as shown in the middle trace in Fig. 9C). The time course and the ‘travelling time’ of the perfusing solution through the ‘Y tube’ were compared with those of the GABA-induced response in the same cell (10 μm GABA, lower trace). In 6 of the 15 basket neurones studied at P7–P9 (Fig. 9D), the mean amplitudes of the ACh-induced currents were 9.7 ± 3.5 pA for 100 μm ACh and 22.0 ± 7.0 pA for 1000 μm ACh. Stellate cells in the molecular layer represent another type of inhibitory neurone that sends axons to Purkinje cells, and they are thought to have similar neuronal properties and functions to basket cells (Pouzat & Hestrin, 1997). The identification of stellate cells in the immature cerebellum with an undeveloped molecular layer, however, was difficult, and remains to be studied.
Figure 9. nAChR-activated inward currents in basket cells.

A, representative micrograph showing a basket cell in a slice (P13). The cell was stained with Lucifer Yellow via a patch pipette (Purk, Purkinje cell). The inset shows a diagram of the experimental setup. B, specimen record of extracellular monitoring of ACh-evoked action potentials in a basket cell (at P8) using a patch electrode. The intra-pipette potential was −10 mV. During an application of ACh (100 μm) using the ‘Y tube’, a train of action potentials was generated in the basket cell. C, representative ACh-evoked whole-cell currents recorded in a P9 basket cell. The holding potential was −40 mV. The application of ACh (100 and 1000 μm) resulted in a definite inward current above noise level (> 2 pA) in 6 of the 15 neurones studied. For comparison, the GABA-induced current from the same cell is shown in the bottom trace. D, summary of mean current amplitudes (excluding failures) induced by ACh: 9.7 ± 3.5 pA in the case of 100 μm ACh and 22.0 ± 7.0 pA in the case of 1000 μm ACh (mean ± s.e.m.; six cells at P7–P9).
The ACh-induced responses of granule cells at P5–P9 are shown in Fig. 10. The granule cells recorded (n = 29) were identified all at the internal granule cell layer, not at the external granule cell layer, which consists of premigratory immature type of cells (Goldowitz & Harme, 1998). A representative response of a granule cell is shown in Fig. 10A. A definite inward current with a rapid rise time and slow decay time can be seen. In 12 out of the 29 cells studied (Fig. 10B), recognizable currents above noise level (> 2 pA) were observed in the case of 100 μm ACh, with a peak amplitude of 16.5 ± 5.5 pA (range, 3–67 pA). In 6 of these 12 cells, a higher concentration of ACh (1000 μm) was applied. The evoked current increased rapidly to a peak (range, 15–240 pA) and had decayed almost to the basal level within 15 s. The average peak amplitude was 77.1 ± 37.2 pA. The inward currents evoked by ACh in granule cells were sensitive to the nicotinic antagonist, DHβE (10 μm, Fig. 10C), consistent with the results shown in Fig. 8.
Figure 10. nAChR-activated inward currents in granule cells.

A, representative traces of ACh-evoked responses recorded in a P7 granule cell. ACh elicited an obvious inward current. Detectable currents above noise level (> 2 pA) were observed in 12 of the 29 neurones studied. ACh (100 or 1000 μm) was applied from the ‘Y tube’. The holding potential was −40 mV. The inset shows a diagram of the experimental setup. B, mean current amplitudes from responding neurones at P5–P9 were 16.5 ± 5.5 pA (mean ± s.e.m. from 12 cells) in the case of 100 μm ACh, and 77.1 ± 37.2 pA (mean ± s.e.m. in further measurements from 6 of the cells) in the case of 1000 μm ACh. C, sensitivity of the ACh-evoked currents to DHβE (1 μm; lower trace). Data are from a P7 granule cell clamped at −40 mV. ACh (100 μm) was applied using the ‘Y tube’. To reduce synaptic currents, BCC (10 μm) and CNQX (5 μm) were added to the external saline.
DISCUSSION
The synaptic properties and nicotinic modulation of Purkinje cells were studied in cerebellar slices from immature rats. Under the condition of whole-cell clamping at −40 mV, spontaneous synaptic currents with excitatory and inhibitory characteristics were observed. The currents were identified as glutamatergic and GABAergic, respectively. Upon application of ACh to each slice, the frequency of occurrence of these synaptic currents increased rapidly and reversibly. The responses induced by ACh were mimicked by nicotinic agonists and were dependent upon the generation of action potentials in the preparation. These results suggest strongly that the ACh-induced responses in Purkinje cells are generated through the activation of nicotinic receptors on the presynaptic neurones, presumably on the proximal axons or somatodendritic domains of these neurones.
In the present preparations, distinct IPSCs as well as EPSCs could be detected in Purkinje cells at P4 and thereafter (Fig. 1). In addition, the TTX-sensitive component of EPSCs, which is dependent upon action potential generation in granule cells, was detected in most slices after P6 (Fig. 3A). These phenomena seem to occur earlier than has been reported previously. The results of previous studies on the development of the rat cerebellum suggest that excitatory synapses from climbing fibres start to function after P2, followed by the formation of inhibitory synapses with basket or stellate cells around P8. Most granule cells, and most of their excitatory synaptic activities directed towards Purkinje cells, develop after P10 (Crepel, 1982; Zhao et al. 1998). Some nicotinic, GABAergic or glutamatergic receptors may be functional before they are positioned at their final postsynaptic sites. Species differences or regional or intercellular variations may be another factor (Oberdick et al. 1998; Voogd & Glickstein, 1998). In addition, the techniques used for detecting synaptic currents (with low current noise, Figs 1 and 2) and for rapid and effective delivery of fast-acting substances to the preparation (Fig. 2) may have contributed to the earlier detection of these synaptic activities. It is noteworthy that the responses evoked by ACh were always intense in young rats (P5–P10), but became less apparent in older rats.
Distribution of nAChRs and variations in the ACh-induced response
Inhibitory inputs to the Purkinje cells arise from basket cells and stellate cells, which are the two major inhibitory interneurones in the molecular layer of the cerebellum (Kondo & Marty, 1998). In the present study, these inhibitory interneurones were not distinguishable in most cases, and so they were considered as a whole (Figs 1–8) because definite identification of inhibitory neurones in an underdeveloped cerebellum with a thin molecular layer is difficult. Figure 9 shows direct evidence of ACh-induced excitatory currents obtained from basket cells that exhibited a typical morphology and somatic location in the slice (in the internal third of the molecular layer). Stellate cells in the molecular layer at P5–P10 were difficult to identify. Since stellate cells have the same chemical properties and functions as basket cells, and since stellate and basket cells show a close developmental relationship (Altman & Bayer, 1978; Pouzat & Hestrin, 1997; Goldowitz & Harmre, 1998), the responsiveness of stellate cells to ACh may be similar to that of basket cells. With regard to the excitatory synaptic currents induced by ACh in Purkinje cells, the responses are thought to originate solely from granule cells, neglected climbing fibres and other excitatory inputs (Llano et al. 1991). This is because the ACh-induced excitatory synaptic currents depend upon action potential generation (Fig. 4). Since the proximal portion and somatic domain of the climbing fibres were removed in the slice preparation used in the present study, the idea that ACh induces the generation of action potentials in climbing fibres seems unlikely. However, since prominent functional development and re-organization also occur at synapses formed with climbing fibres at this stage of cerebellar development (Crepel, 1982; Kakizawa et al. 2000), it is possible that climbing fibres are also affected by the activities of nAChRs in granule and basket cells. Interactions among distinct synapses in the brain during development have been reported (Cordero-Erausquin et al. 2000).
Even in slices obtained from rats of the same developmental age, the synaptic currents obtained in control saline and during nicotinic agonist application showed considerable inter-cell variation in their frequency of occurrence or their response to nicotinic agents (s.e.m. bars in Figs 1, 6, 7 and 8). The factors causing these variations may include differences in the excitabilities of presynaptic neurones in control saline and in nicotinic agent-containing saline (s.e.m. bars in Figs 9 and 10), different degrees of innervation, and the efficacy of transmitter release at target neurones (Forti et al. 2000; Iwasaki et al. 2000). The variations may also be caused by differences in the postsynaptic properties of glutamatergic and GABAergic receptors and of uptake systems of released transmitters on and around Purkinje cells (Overstreet et al. 1999). During the period of cerebellar development when rapid and drastic changes in neural connections can occur in a short time (Wall & Usowicz, 1998; Iwasaki et al. 2000; Kakizawa et al. 2000), these factors may all contribute in complex manners. Most of the inter-event variations in EPSC and IPSC amplitudes in the Purkinje cells (Figs 4C and 5C) may also be explained by the above factors in addition to the difference in cable properties mentioned before (Major et al. 1994).
Molecular nature of nAChRs
A variety of different neuronal nicotinic receptor subunits have been cloned and named α2–α9 and β2–β4 (Cordero-Erausquin et al. 2000). Subunits α7 and α8 in the central nervous system form a family of α-BgTX-sensitive channels, whereas subunits α2–α6 combine with subunits β2–β4 to produce α-BgTX-insensitive channels. In the mammalian cerebellum, the presence of nAChR subunits has been reported, but their roles and detailed localization are have yet to be determined (Nakayama et al. 1998; Zhang et al. 1998). Our results using specific blockers suggest the involvement of α-BgTX-insensitive (i.e. non-α7-containing) nAChRs in cerebellar cortex neurones (Fig. 8). A comparison of the potencies of the actions of nicotinic agonists on EPSCs and those on IPSCs showed a significant difference between them (Fig. 7). In a recent study on reconstituted nAChRs of α3β2and α4β2 subtypes an interesting observation regarding the potency order in nicotinic agonists and decay rates of ACh-induced currents for these non-α7-containing receptors has been reported (Chavez-Noriega et al. 2000). Judging from that report, nAChRs involved in the generation of EPSCs seem more likely to be the α3β2 subtype, while those involved in IPSCs generation seem more likely to be the α4β2 subtype. The contribution of other factors such as the chemical excitabilities or geometrical properties of these neurones, or the possible involvement of other subtypes of nAChRs must be considered (Wonnacott, 1997; Covernton & Connolly, 2000) before formulating a definite conclusion. Nicotinic receptors of the α7 subtype show high Ca2+ permeability and are known to enhance transmitter release if they are expressed on axonal terminals (McGehee et al. 1995; Gray et al. 1996; Role & Berg, 1996; Vizi & Lendvai, 1999). In contrast, non-α7 nicotinic receptors, which are expressed widely in the central nervous system, seem to be more diverse in their function or in their expressed domains of the cell (Porter et al. 1999; Sudweeks & Yakel, 2000). Of course, some of the non-α7 receptors are described to regulate transmitter release in the brain (Wonnacott, 1997; Sharples et al. 2000). The present study provides a novel example of non-α7 nicotinic receptors operating on presynaptic neurones in the developing cerebellum. In embryonic chickens or more mature rats, cerebellar Purkinje cells have been reported to have α7-containing nAChRs (Dominguez del Toro et al. 1997; Kaneko et al. 1998). However, the function of these receptors and their relationship to the small ACh-induced inward currents in Purkinje cells observed in the present study (Fig. 3) remains to be elucidated.
Functional roles of the receptor
The observation of functional nAChRs expressed on particular neurones in the developing cerebellum may explain why such an intense response to a nicotinic agonist in the cerebellum has so far remained unnoticed. This is in contrast to the well-known operation of nAChRs in other areas of the brain, including the cerebral cortex and the brainstem (Sudweeks & Yakel, 1999; Alkondon et al. 2000; Cordero-Erausquin et al. 2000). In primary cultures of cerebellar granule cells, however, the presence of cholinergic receptors for nicotinic (Didier et al. 1995) and muscarinic subtypes (Boyd et al. 2000) have been reported, and these receptors seem to regulate the membrane excitability and subsequent survival of the cell. ACh may act not only as a classical synaptic transmitter, but also as a volume-transmission signal in some areas of the brain (Zoli et al. 1998), implying broader roles of ACh at multiple sites in the brain than previously thought (Cordero-Erausquin et al. 2000).
Two major functions of nAChR in the immature cerebellum can be inferred. Firstly, they may actually function on these cerebellar neurones under physiological conditions and transform cholinergic excitation to enhanced presynaptic activities on Purkinje cells. Recent studies in the immature cerebellum have revealed that cholinergic innervation may be more dominant and more effective than previously thought (Clos et al. 1989; Didier et al. 1995; Zhang et al. 1998). The finding that some Golgi cells and mossy fibres are cholinergic supports this view (Illing, 1990; Jaarsma et al. 1996). Cholinergic fibres may remain functional into adulthood in some species (Jaarsma et al. 1997). Secondly, the nicotinic receptor may serve as a specific molecular marker of the cell that plays critical roles during ontogenesis (Komuro & Rakic, 1993; Aramakis et al. 2000). Some nicotinic receptors may also work as ion channel-coupled receptors and modulate the intracellular Ca2+ concentration in order to regulate cellular differentiation (Zheng et al. 1994). ACh in the brain may also serve as a trophic substance affecting neural differentiation or maturation (Role & Berg, 1996; Frank et al. 2001). It is relevant to note that nicotine administration in embryonic or newborn animals can cause disruptive changes in neural function in sensory areas as well as other sites of the nervous system, including the cerebellum (Role & Berg, 1996; Jones et al. 1999; Aramakis et al. 2000; Harper, 2000). During pre- and postnatal development, adequate activities of the nAChRs seem to be necessary for the functional maturation of the brain (Frank et al. 2001). Thus, the preparation used in the present study provides a useful model for further clarifying synaptic maturation and plasticity under physiological and pathological conditions.
Acknowledgments
Thanks are due to Mr T. Sai and Ms M. Kamada for their technical support, Dr H. Yawo for his discussion, and Mr S. Chisholm for reading the manuscript. This work was supported by a CREST grant from the Japan Science and Technology Corporation (JST).
REFERENCES
- Alkondon M, Pereira EF, Eisenberg HM, Albuquerque EX. Nicotinic receptor activation in human cerebral cortical interneurons: a mechanism for inhibition and disinhibition of neuronal networks. Journal of Neuroscience. 2000;20:66–75. doi: 10.1523/JNEUROSCI.20-01-00066.2000. [DOI] [PMC free article] [PubMed] [Google Scholar]
- Altman J, Bayer SA. Prenatal development of the cerebellar system in the rat. I. Cytogenesis and histogenesis of the deep nuclei and the cortex of the cerebellum. Journal of Comparative Neurology. 1978;179:23–48. doi: 10.1002/cne.901790104. [DOI] [PubMed] [Google Scholar]
- Aramakis VB, Hsieh CY, Leslie FM, Metherate R. A critical period for nicotine-induced disruption of synaptic development in rat auditory cortex. Journal of Neuroscience. 2000;20:6106–6116. doi: 10.1523/JNEUROSCI.20-16-06106.2000. [DOI] [PMC free article] [PubMed] [Google Scholar]
- Boyd DF, Millar JA, Watkins CS, Mathie A. The role of Ca2+ stores in the muscarinic inhibition of the K+ current IK(SO) in neonatal rat cerebellar granule cells. Journal of Physiology. 2000;529:321–331. doi: 10.1111/j.1469-7793.2000.00321.x. [DOI] [PMC free article] [PubMed] [Google Scholar]
- Buisson B, Vallejo YF, Green WN, Bertrand D. The unusual nature of epibatidine responses at the α4β2 nicotinic acetylcholine receptor. Neuropharmacology. 2000;39:2561–2569. doi: 10.1016/s0028-3908(00)00158-1. [DOI] [PubMed] [Google Scholar]
- Chavez-Noriega LE, Gillespie A, Stauderman KA, Crona JH, Claeps BO, Elliott KJ, Reid RT, Rao TS, Velicelebi G, Harpold MM, Johnson EC, Corey-Naeve J. Characterization of the recombinant human neuronal nicotinic acetylcholine receptors α3β2and α4β2 stably expressed in HEK293 cells. Neuropharmacology. 2000;39:2543–2560. doi: 10.1016/s0028-3908(00)00134-9. [DOI] [PubMed] [Google Scholar]
- Clos J, Ghandour S, Eberhart R, Vincendon G, Gombos G. The cholinergic system in developing cerebellum: comparative study of normal, hypothyroid and underfed rats. Developmental Neuroscience. 1989;11:188–204. doi: 10.1159/000111898. [DOI] [PubMed] [Google Scholar]
- Coggan JS, Paysan J, Conroy WG, Berg DK. Direct recording of nicotinic responses in presynaptic nerve terminals. Journal of Neuroscience. 1997;17:5798–5806. doi: 10.1523/JNEUROSCI.17-15-05798.1997. [DOI] [PMC free article] [PubMed] [Google Scholar]
- Cordero-Erausquin M, Marubio LM, Klink R, Changeux JP. Nicotinic receptor function: new perspectives from knockout mice. Trends in Pharmacological Sciences. 2000;21:211–217. doi: 10.1016/s0165-6147(00)01489-9. [DOI] [PubMed] [Google Scholar]
- Covernton P J O, Connolly JG. Multiple components in the agonist concentration-response relationships of neuronal nicotinic acetylcholine receptors. Journal of Neuroscience Methods. 2000;96:63–70. doi: 10.1016/s0165-0270(99)00185-5. [DOI] [PubMed] [Google Scholar]
- Crepel F. Regression of functional synapses in the immature mammalian cerebellum. Trends in Neurosciences. 1982;5:266–269. [Google Scholar]
- Cuevas J, Berg DK. Mammalian nicotinic receptors with α7 subunits that slowly desensitize and rapidly recover from α-Bungarotoxin blockade. Journal of Neuroscience. 1998;18:10335–10344. doi: 10.1523/JNEUROSCI.18-24-10335.1998. [DOI] [PMC free article] [PubMed] [Google Scholar]
- Daniel H, Levenes C, Crepel F. Cellular mechanisms of cerebellar LTD. Trends in Neurosciences. 1998;21:401–407. doi: 10.1016/s0166-2236(98)01304-6. [DOI] [PubMed] [Google Scholar]
- Didier M, Berman SA, Lindstrom J, Bursztajn S. Characterization of nicotinic acetylcholine receptors expressed in primary cultures of cerebellar granule cells. Molecular Brain Research. 1995;30:17–28. doi: 10.1016/0169-328x(94)00266-h. [DOI] [PubMed] [Google Scholar]
- Dominguez del Toro E, Juiz JM, Smillie FI, Lindstrom J, Criado M. Expression of alpha 7 neuronal nicotinic receptors during postnatal development of the rat cerebellum. Brain Research Developmental Brain Research. 1997;98:125–133. doi: 10.1016/s0165-3806(96)00185-x. [DOI] [PubMed] [Google Scholar]
- Edwards FA, Konnerth A, Sakmann B, Takahashi T. A thin slice preparation for patch clamp recordings from neurones of the mammalian central nervous system. Pflügers Archiv. 1989;414:600–612. doi: 10.1007/BF00580998. [DOI] [PubMed] [Google Scholar]
- Fewell JE, Smith FG. Perinatal nicotine exposure impairs ability of newborn rats to autoresuscitate from apnea during hypoxia. Journal of Applied Physiology. 1998;85:2066–2074. doi: 10.1152/jappl.1998.85.6.2066. [DOI] [PubMed] [Google Scholar]
- Forti L, Pouzat C, Llano I. Action potential-evoked Ca2+ signals and calcium channels in axons of developing rat cerebellar interneurones. Journal of Physiology. 2000;527:33–48. doi: 10.1111/j.1469-7793.2000.00033.x. [DOI] [PMC free article] [PubMed] [Google Scholar]
- Frank MG, Srere H, Ledezma C, O'Hara B, Heller HC. Prenatal nicotine alters vigilance states and AchR gene expression in the neonatal rat: implications for SIDS. American Journal of Physiology. 2001;280:R1134–1140. doi: 10.1152/ajpregu.2001.280.4.R1134. [DOI] [PubMed] [Google Scholar]
- Frazier CJ, Rollins YD, Breese CR, Leonard S, Freedman R, Dunwiddie TV. Acetylcholine activates an α-Bungarotoxin-sensitive nicotinic current in rat hippocampal interneurons, but not pyramidal cells. Journal of Neuroscience. 1998;18:1187–1195. doi: 10.1523/JNEUROSCI.18-04-01187.1998. [DOI] [PMC free article] [PubMed] [Google Scholar]
- Glitsch M, Marty A. Presynaptic effects of NMDA in cerebellar Purkinje cells and interneurons. Journal of Neuroscience. 1999;19:511–519. doi: 10.1523/JNEUROSCI.19-02-00511.1999. [DOI] [PMC free article] [PubMed] [Google Scholar]
- Goldowitz D, Hamre K. The cells and molecules that make a cerebellum. Trends in Neurosciences. 1998;21:375–382. doi: 10.1016/s0166-2236(98)01313-7. [DOI] [PubMed] [Google Scholar]
- Gray R, Rajan AS, Radcliffe KA, Yakehiro M, Dani JA. Hippocampal synaptic transmission enhanced by low concentrations of nicotine. Nature. 1996;383:713–716. doi: 10.1038/383713a0. [DOI] [PubMed] [Google Scholar]
- Harper RM. Sudden infant death syndrome: a failure of compensatory cerebellar mechanisms? Pediatric Research. 2000;48:140–142. doi: 10.1203/00006450-200008000-00004. [DOI] [PubMed] [Google Scholar]
- Hugel S, Schlichter R. Presynaptic P2X receptors facilitate inhibitory GABAergic transmission between cultured rat spinal cord dorsal horn neurons. Journal of Neuroscience. 2000;20:2121–2130. doi: 10.1523/JNEUROSCI.20-06-02121.2000. [DOI] [PMC free article] [PubMed] [Google Scholar]
- Illing RB. A subtype of cerebellar Golgi cells may be cholinergic. Brain Research. 1990;522:267–274. doi: 10.1016/0006-8993(90)91471-r. [DOI] [PubMed] [Google Scholar]
- Ito M. Cerebellar learning in the vestibulo-ocular reflex. Trends in Cognitive Sciences. 1998;2:313–321. doi: 10.1016/s1364-6613(98)01222-4. [DOI] [PubMed] [Google Scholar]
- Iwasaki S, Momiyama A, Uchitel OD, Takahashi T. Developmental changes in calcium channel types mediating central synaptic transmission. Journal of Neuroscience. 2000;20:59–65. doi: 10.1523/JNEUROSCI.20-01-00059.2000. [DOI] [PMC free article] [PubMed] [Google Scholar]
- Jaarsma D, Dino MR, Cozzari C, Mugnaini E. Cerebellar choline acetyltransferase positive mossy fibres and their granule and unipolar brush cell targets: a model for central cholinergic nicotinic neurotransmission. Journal of Neurocytology. 1996;25:829–842. doi: 10.1007/BF02284845. [DOI] [PubMed] [Google Scholar]
- Jaarsma D, Ruigrok TJ, Caffe R, Cozzari C, Levey AI, Mugnaini E, Voogd J. Cholinergic innervation and receptors in the cerebellum. Progress in Brain Research. 1997;114:67–96. doi: 10.1016/s0079-6123(08)63359-2. [DOI] [PubMed] [Google Scholar]
- Jones S, Sudweeks S, Yakel JL. Nicotinic receptors in the brain: correlating physiology with function. Trends in Neurosciences. 1999;22:555–561. doi: 10.1016/s0166-2236(99)01471-x. [DOI] [PubMed] [Google Scholar]
- Kakizawa S, Yamasaki M, Watanabe M, Kano M. Critical period for activity-dependent synapse elimination in developing cerebellum. Journal of Neuroscience. 2000;20:4954–4961. doi: 10.1523/JNEUROSCI.20-13-04954.2000. [DOI] [PMC free article] [PubMed] [Google Scholar]
- Kaneko WM, Britto LR, Lindstrom JM, Karten HJ. Distribution of the alpha7 nicotinic acetylcholine receptor subunit in the developing chick cerebellum. Brain Research Developmental Brain Research. 1998;105:141–145. [PubMed] [Google Scholar]
- Kása P, Rakonczay Z, Gulya K. The cholinergic system in Alzheimer's disease. Progress in Neurobiology. 1997;52:511–535. doi: 10.1016/s0301-0082(97)00028-2. [DOI] [PubMed] [Google Scholar]
- Kawa K, Kamada M. Acute synaptic modulation in Purkinje cells of the young rat induced by nicotinic agonists. Japanese Journal of Physiology. 2000;50(suppl.):117. [Google Scholar]
- Kerchner GA, Wilding TJ, Li P, Huettner JE. Presynaptic kainate receptors regulate spinal sensory transmission. Journal of Neuroscience. 2001;21:59–66. doi: 10.1523/JNEUROSCI.21-01-00059.2001. [DOI] [PMC free article] [PubMed] [Google Scholar]
- Klink R, d'Exaerde AK, Zoli M, Changeux J-P. Molecular and physiological diversity of nicotinic acetylcholine receptors in the midbrain dopaminergic nuclei. Journal of Neuroscience. 2001;21:1452–1463. doi: 10.1523/JNEUROSCI.21-05-01452.2001. [DOI] [PMC free article] [PubMed] [Google Scholar]
- Komuro H, Rakic P. Modulation of neuronal migration by NMDA receptors. Science. 1993;260:95–97. doi: 10.1126/science.8096653. [DOI] [PubMed] [Google Scholar]
- Kondo S, Marty A. Synaptic currents at individual connections among stellate cells in rat cerebellar slices. Journal of Physiology. 1998;509:221–232. doi: 10.1111/j.1469-7793.1998.221bo.x. [DOI] [PMC free article] [PubMed] [Google Scholar]
- Kristufek D, Stocker E, Boehm S, Huck S. Somatic and prejunctional nicotinic receptors in cultured rat sympathetic neurones show different agonist profiles. Journal of Physiology. 1999;516:739–756. doi: 10.1111/j.1469-7793.1999.0739u.x. [DOI] [PMC free article] [PubMed] [Google Scholar]
- Llano I, Marty A, Armstrong CM, Konnerth A. Synaptic- and agonist-induced excitatory currents of Purkinje cells in rat cerebellar slices. Journal of Physiology. 1991;434:183–213. doi: 10.1113/jphysiol.1991.sp018465. [DOI] [PMC free article] [PubMed] [Google Scholar]
- McGehee DS, Heath MJ, Gelber S, Devay P, Role LW. Nicotine enhancement of fast excitatory synaptic transmission in CNS by presynaptic receptors. Science. 1995;269:1692–1696. doi: 10.1126/science.7569895. [DOI] [PubMed] [Google Scholar]
- Major G, Larkman AU, Jonas P, Sakmann B, Jack JJ. Detailed passive cable models of whole-cell recorded CA3 pyramidal neurons in rat hippocampal slices. Journal of Neuroscience. 1994;14:4613–4638. doi: 10.1523/JNEUROSCI.14-08-04613.1994. [DOI] [PMC free article] [PubMed] [Google Scholar]
- Murase K, Ryu PD, Randic M. Excitatory and inhibitory amino acids and peptide-induced responses in acutely isolated rat spinal dorsal horn neurons. Neuroscience Letters. 1989;103:56–63. doi: 10.1016/0304-3940(89)90485-0. [DOI] [PubMed] [Google Scholar]
- Nakayama H, Shioda S, Nakajo S, Ueno S, Nakai Y. Expression of the nicotinic acetylcholine receptor α4 subunit mRNA in the rat cerebellar cortex. Neuroscience Letters. 1998;256:177–179. doi: 10.1016/s0304-3940(98)00784-8. [DOI] [PubMed] [Google Scholar]
- Oberdick J, Baader SL, Schilling K. From zebra stripes to postal zones: deciphering patterns of gene expression in the cerebellum. Trends in Neurosciences. 1998;21:383–390. doi: 10.1016/s0166-2236(98)01325-3. [DOI] [PubMed] [Google Scholar]
- Overstreet LS, Kinney GA, Liu YB, Billups D, Slater NT. Glutamate transporters contribute to the time course of synaptic transmission in cerebellar granule cells. Journal of Neuroscience. 1999;19:9663–9673. doi: 10.1523/JNEUROSCI.19-21-09663.1999. [DOI] [PMC free article] [PubMed] [Google Scholar]
- Perry E, Walker M, Grace J, Perry R. Acetylcholine in mind: a neurotransmitter correlate of consciousness? Trends in Neurosciences. 1999;22:273–280. doi: 10.1016/s0166-2236(98)01361-7. [DOI] [PubMed] [Google Scholar]
- Pouzat C, Hestrin S. Developmental regulation of basket/stellate cell −> Purkinje cell synapses in the cerebellum. Journal of Neuroscience. 1997;17:9104–9112. doi: 10.1523/JNEUROSCI.17-23-09104.1997. [DOI] [PMC free article] [PubMed] [Google Scholar]
- Role LW, Berg DK. Nicotinic receptors in the development and modulation of CNS synapses. Neuron. 1996;16:1077–1085. doi: 10.1016/s0896-6273(00)80134-8. [DOI] [PubMed] [Google Scholar]
- Sharples C G V, Kaiser S, Soliakov L, Marks MJ, Collins AC, Washburn M, Wright E, Spencer JA, Gallagher T, Whiteaker P, Wonnacott S. UB-165: a novel nicotinic agonist with subtype selectivity implicates the α4β2* subtype in the modulation of dopamine release from rat striatal synaptosomes. Journal of Neuroscience. 2000;20:2783–2791. doi: 10.1523/JNEUROSCI.20-08-02783.2000. [DOI] [PMC free article] [PubMed] [Google Scholar]
- Smith TC, Wang LY, Howe JR. Distinct kainate receptor phenotypes in immature and mature mouse cerebellar granule cells. Journal of Physiology. 1999;517:51–58. doi: 10.1111/j.1469-7793.1999.0051z.x. [DOI] [PMC free article] [PubMed] [Google Scholar]
- Southan AP, Robertson B. Patch-clamp recordings from cerebellar basket cell bodies and their presynaptic terminals reveal an asymmetric distribution of voltage-gated potassium channels. Journal of Neuroscience. 1998;18:948–955. doi: 10.1523/JNEUROSCI.18-03-00948.1998. [DOI] [PMC free article] [PubMed] [Google Scholar]
- Sudweeks SN, Yakel JL. Functional and molecular characterization of neuronal nicotinic ACh receptor in rat CA1 hippocampal neurons. Journal of Physiology. 2000;527:515–528. doi: 10.1111/j.1469-7793.2000.00515.x. [DOI] [PMC free article] [PubMed] [Google Scholar]
- Vitolo OV, Ciotti MT, Galli C, Borsello T, Calissano P. Adenosine and ADP prevent apoptosis in cultured rat cerebellar granule cells. Brain Research. 1998;809:297–301. doi: 10.1016/s0006-8993(98)00713-6. [DOI] [PubMed] [Google Scholar]
- Vizi ES, Lendvai B. Modulatory role of presynaptic nicotinic receptors in synaptic and non-synaptic chemical communication in the central nervous system. Brain Research Reviews. 1999;30:219–235. doi: 10.1016/s0165-0173(99)00016-8. [DOI] [PubMed] [Google Scholar]
- Voogd J, Glickstein M. The anatomy of the cerebellum. Trends in Neurosciences. 1998;21:370–375. doi: 10.1016/s0166-2236(98)01318-6. [DOI] [PubMed] [Google Scholar]
- Wall MJ, Usowicz MM. Development of the quantal properties of evoked and spontaneous synaptic currents at a brain synapse. Nature Neuroscience. 1998;1:675–682. doi: 10.1038/3677. [DOI] [PubMed] [Google Scholar]
- Wonnacott S. Presynaptic nicotinic ACh receptors. Trends in Neurosciences. 1997;20:92–98. doi: 10.1016/s0166-2236(96)10073-4. [DOI] [PubMed] [Google Scholar]
- Zhang X, Liu C, Miao H, Gong ZH, Nordberg A. Postnatal changes of nicotinic acetylcholine receptor alpha 2, alpha 3, alpha 4, alpha 7 and beta 2 subunits genes expression in rat brain. International Journal of Developmental Neuroscience. 1998;16:507–518. doi: 10.1016/s0736-5748(98)00044-6. [DOI] [PubMed] [Google Scholar]
- Zhao H-M, Wenthold RJ, Petralia RS. Glutamate receptor targeting to synaptic populations on Purkinje cells is developmentally regulated. Journal of Neuroscience. 1998;18:5517–5528. doi: 10.1523/JNEUROSCI.18-14-05517.1998. [DOI] [PMC free article] [PubMed] [Google Scholar]
- Zheng JO, Felder M, Connor JA, Poo MM. Turning of nerve growth cones induced by neurotransmitters. Nature. 1994;368:140–144. doi: 10.1038/368140a0. [DOI] [PubMed] [Google Scholar]
- Zoli M, Torri C, Ferrari R, Jansson A, Zini I, Fuxe K, Agnati LF. The emergence of the volume transmission concept. Brain Research Brain Research Review. 1998;26:136–147. doi: 10.1016/s0165-0173(97)00048-9. [DOI] [PubMed] [Google Scholar]