

Abstract
The frequency of quantal transmitter release increases upon application of hypertonic solutions. This effect bypasses the Ca2+ triggering step, but requires the presence of key molecules involved in vesicle fusion, and hence could be a useful tool for dissecting the molecular process of vesicle fusion. We have examined the hypertonicity response at neuromuscular junctions of Drosophila embryos in Ca2+-free saline. Relative to wild-type, the response induced by puff application of hypertonic solution was enhanced in a mutant, dunce, in which the cAMP level is elevated, or in wild-type embryos treated with forskolin, an activator of adenylyl cyclase, while protein kinase A (PKA) inhibitors decreased it. The response was also smaller in a mutant, DC0, which lacks the major subunit of PKA. Thus the cAMP/PKA cascade is involved in the hypertonicity response. Peptides containing the sequence Arg-Gly-Asp (RGD), which inhibit binding of integrins to natural ligands, reduced the response, whereas a peptide containing the non-binding sequence Arg-Gly-Glu (RGE) did not. A reduced response persisted in a mutant, myospheroid, which expresses no integrins, and the response in DC0 was unaffected by RGD peptides. These data indicate that there are at lease two components in the hypertonicity response: one that is integrin mediated and involves the cAMP/PKA cascade, and another that is not integrin mediated and does not involve the cAMP/PKA cascade.
Fatt & Katz (1952) reported a dramatic increase in the frequency of miniature synaptic potentials when mechanical stretch or a hypertonic solution was applied to frog neuromuscular junctions. The stretch modulation of synaptic transmission is a purely mechanical phenomenon, independent of Ca2+ influx or Ca2+ release from internal stores. Since the stretch effect operates well within the physiological range, this mechanism is thought to modulate synaptic transmission in vivo (Chen & Grinnell, 1994, 1995, 1997). The stretch modulation of synaptic transmission and the hypertonicity response have many properties in common and may share a common molecular mechanism for enhancing vesicle fusion (Chen & Grinnell, 1997; Kashani et al. 2001). However, the hypertonicity response has been noted much more widely than that to mechanical stretch. Indeed, hypertonicity has been used as a tool to study neurotransmitter release in cultured neuronal cells (Stevens & Tsujimoto, 1995; Rosenmund & Stevens, 1996; Mochida et al. 1998) as well as in Drosophila embryos (Aravamudan et al. 1999). Particularly in the latter preparation, the hypertonicity response potentially provides an excellent tool with which to dissect the molecular events involved in transmitter release.
Another agent that facilitates synaptic transmission in a variety of preparations is cAMP (Kandel & Schwartz, 1982). At larval Drosophila neuromuscular junctions, cAMP increases the frequency of miniature synaptic currents in the absence of external Ca2+ (Zhang et al. 1999; Yoshihara et al. 2000), but like hypertonicity (Aravamudan et al. 1999), has no effect in mutants lacking neuronal synaptobrevin (Deitcher et al. 1998). Thus the facilitation of synaptic transmitter release by cAMP and by hypertonicity shows similarities, suggesting that they may share some molecular steps in a common pathway. We have tested this possibility in Drosophila mutants that have defects in the cAMP/PKA cascade or in wild-type embryos treated with drugs that affect the cascade.
The underlying molecular mechanism for the hypertonicity response has long eluded our understanding. Recently, however, it has been shown that both the stretch and hypertonicity responses at frog neuromuscular junctions are strongly suppressed by peptides containing the amino acid sequence arginine-glycine-aspartic acid (RGD) (Chen & Grinnell, 1995, 1997; Kashani et al. 2001). Since RGD peptides bind to integrins and inhibit their interaction with native ligands in the extracellular matrix (Pierschbacher & Ruoslahti, 1987), this finding suggests that integrins are involved in the hypertonicity response (Kashani et al. 2001).
At Xenopus neuromuscular junctions α3β1 integrins are closely localized to active sites in the presynaptic terminal (Cohen et al. 2000). Position-specific (PS) integrins in Drosophila are homologues of vertebrate integrins. Three subtypes, βPS, αPS1 and αPS2, are localized in the peri-active zone surrounding a release site at the neuromuscular junction (Prokop et al. 1998; Beumer et al. 1999; Sone et al. 2000). These observations suggest a close relation of integrins with synaptic function.
Integrins are known to transmit cell surface mechanical deformation to the internal cytoskeleton and signal transduction systems (Wang et al. 1993; see review by Clark & Brugge, 1995). Thus the mechanical stress induced by hypertonicity might be transmitted via integrins and the cytoskeleton directly to the vesicle fusion machinery, as has been postulated for stretch modulation (Chen & Grinnell, 1997). Alternatively, mechanical stimulation of integrins by hypertonicity might lead to activation of the cAMP/PKA cascade in the presynaptic terminal, which could then influence release probability (Zhang et al. 1999; Yoshihara et al. 2000). Evidence for such coupling between integrins and the cAMP/PKA cascade has been reported in mouse lymphoma cells where mechanical forces on the cell surface stimulate the activity of adenylyl cyclase and elevate the intracellular level of cAMP (Watson, 1990). Similarly, in endothelial cells magnetically twisting ferromagnetic beads that have been coated with integrin ligands and attached to the surface membrane, caused an elevation of the intracellular cAMP (Meyer et al. 2000). In the presynaptic terminal a local increase of cAMP in this manner may enhance transmitter release during the hypertonicity response.
In this study we have examined quantal transmitter release induced by hypertonicity at neuromuscular junctions in Drosophila embryos. Using mutants that express high or low levels of cAMP or no PKA, and specific pharmacological agents that modify this cascade, we have demonstrated that the response to hypertonicity does indeed involve the cAMP/PKA cascade, at least in part. Furthermore, stimulated by knowledge of the role of integrins in the hypertonicity response in frogs, we have demonstrated that the hypertonicity response has two components: RGD-blockable (integrin-dependent) and RGD-unblockable (integrin-independent). The RGD-unblockable component was not influenced by cAMP. Conversely, the PKA-independent response was not sensitive to RGD. Thus the integrin-mediated component seems to act via, or be modulated by, the cAMP/PKA cascade. Taken together, we suggest that PS integrins, which are situated close to synaptic transmitter release sites, are coupled to adenylyl cyclase. Partly through this pathway, the stress signal induced by hypertonicity facilitates quantal transmitter release.
A preliminary account of this study has been published in abstract form (Suzuki et al. 2000).
METHODS
Fly stocks
Wild-type flies of the Canton-S (CS) stock and the following mutants were used in this study: dunce1 (dnc), rutabaga1 (rut), DC0B3(DC0), myospheroidXG43(mys). DC0B3 was a gift from Dr Daniel Kalderon at Columbia University and myospheroidXG43 was a gift from Dr John H. Fessler at UCLA.
Preparations
Embryos (17–19 h after fertilization) of CS, dnc, rut and DC0 were used in this study as described previously (Kidokoro & Nishikawa, 1994). In the case of mys, at 20–25 h after fertilization, eggs were collected and the egg case was removed by treating with 30 % hypochlorous acid for 3 min. After washing in saline, homozygous mutant embryos were selected under a stereo-microscope based upon their characteristic deformity. Homozygous mutant embryos were difficult to dissect because of loose adherence among cells. Many spherical muscle cells did not manifest spontaneous synaptic currents, which could be due to denervation during contractions in the embryo or to damage during dissection. Those cells that showed no synaptic currents during the first 5 min of recording were discarded.
Dissecting procedures were the same as described previously (Kidokoro & Nishikawa, 1994; Nishikawa & Kidokoro, 1995). Dissection was carried out in Ca2+-free saline (see below for ionic composition). After treating the dissected preparation with collagenase (1 mg ml−1) for 30 s to 1 min, electrical recordings of synaptic currents were carried out with patch-clamp techniques in the whole-cell configuration. The membrane potential was always held at −60 mV. The internal solution contained Cs+ (see below for ionic composition), and the junction potential of the electrode filled with the Cs+ internal solution was −5 mV. Thus the true holding potential was −65 mV.
Hypertonic solutions were prepared by adding sucrose to the Ca2+-free solution, and were applied by the puff method. (For brevity, Ca2+-free saline with 340 mm sucrose added will be designated 340 mm sucrose solution.) The pipette had a tip diameter of 2–5 μm and the tip was placed close to the junctional area. The gas pressure used to puff hypertonic solutions was 0.5 kg cm−2. The quantal synaptic events were counted individually within every 0.5 s, and the frequency was expressed as the number of events s−1. To construct a dose–response curve, the total number of events during each hypertonicity response was counted during a period of 30 s starting at the onset of the puff pulse that lasted 11 s. The frequency of spontaneous miniature synaptic currents was measured for 5 min in each cell separately from the above recordings.
For nerve stimulation, the tip of a microelectrode, having a resistance of 10–20 MΩ after being filled with 4 m potassium acetate, was placed in the ventral ganglion, and positive pulses of 2 ms duration and about 2 μA intensity were delivered.
To test the effect of forskolin (200 μm) on the hypertonicity response, the preparation was kept for at least 20 min in Ca2+-free saline containing forskolin and the physiological experiment was done in the same medium. The effect of PKA inhibition was tested after incubation with 10 μm KT5720 for 30 min in Ca2+-free saline or with 100 μm Rp-cAMPS (RP-cyclic 3′, 5′-hydrogen phosphorothioate adenosine triethylammonium) for 15 min in Ca2+-free saline.
For application of peptides, the preparation was kept for 20 min in a low Ca2+ (50 μm), low Mg2+ (50 μm) solution containing the peptide at 0.2 mm in all experiments. The experiment was carried out in Ca2+-free saline containing the same concentration of the peptide. The hypertonic solution in the puff pipette also contained the same concentration of the peptide.
All experiments were carried out at room temperature (18–27 °C).
Solutions
All experiments were carried out in Ca2+-free solution except for those in which synaptic currents were evoked by nerve stimulation. The ionic composition of the Ca2+-free saline was (mm): NaCl 140, KCl 2, MgCl2 6 and Hepes-NaOH 5 (pH 7.1). For nerve stimulation to evoke synaptic currents, 0.5 mm Ca2+ (experiments with mysnull) or 0.15 mm Ca2+ (experiments with dnc or wild-type) was added to Ca2+-free saline, replacing the same amount of Mg2+. The internal solution for the patch pipette had the ionic composition (mm): CsCl 158, EGTA 5, Hepes-NaOH 10 and ATP 2 (pH 7.1).
Chemicals
Peptides, Gly-Arg-Gly-Asp-Ser-Pro (GRGDSP) and Gly-Arg-Gly-Glu-Ser-Pro (GRGESP) were obtained from Peninsula Laboratories (Belmont, CA, USA). Other RGD peptides, Gly-Arg-Gly-Asp-Ser (GRGDS), Gly-Arg-Gly-Asp-Ser-Pro-Lys (GRGDSPK) and Arg-Gly-Asp-Ser (RGDS), were purchased from Peptide Institute, Inc. (Osaka, Japan). Forskolin, tetrodotoxin and collagenase were purchased from Sigma (USA). KT5720 was obtained from BIOMOL Research Laboratories, Inc. (Plymouth Meeting, PA, USA). Rp-cAMPS was purchased from Research Biochemicals International (Natick, MA, USA). For stock solutions, forskolin was dissolved in ethanol at 10 mm, KT5720 in DMSO at 2 mm, and Rp-cAMPS in water at 10 mm.
Statistical analyses
For comparison among multiple groups, ANOVA was used with Scheffé's test. For comparison of two groups, Student's t test was used.
RESULTS
The hypertonicity response at the neuromuscular junction of wild-type (Canton-S) fly embryos
Spontaneous synaptic currents occurred infrequently in Ca2+-free saline in wild-type embryos (2.7 ± 1.1 events min−1, mean ± s.d., n = 13, number of cells examined). The mean amplitude was 175 ± 31 pA (n = 7; more than 10 events (20 events on average) were measured in each cell). These are probably the result of spontaneous fusion of synaptic vesicles with the terminal membrane (miniature synaptic currents), since 3 μm tetrodotoxin did not affect their frequency. When the 340 mm sucrose solution was puffed onto neuromuscular junctions, the frequency of synaptic events increased to a peak of 18–32 events s−1 and declined gradually during continuous application of the hypertonic solution. (Here and throughout, hypertonic solutions are described by the concentration of sucrose added to Ca2+-free saline.) The mean amplitude during the hypertonicity response was somewhat smaller: 134 ± 20 pA (n = 5). After cessation of the puff pulse, the frequency gradually returned to the level before puff application. Figure 1 shows a typical record of the response at a neuromuscular junction in a wild-type embryo. Quantal synaptic events were counted individually in this type of record.
Figure 1. A hypertonicity response at an embryonic Drosophila neuromuscular junction.

Current records during a response to Ca2+-free saline containing 340 mm of sucrose are shown. Four traces (1–4) show a continuous current record from longitudinal muscle #6 in an abdominal segment of a wild-type embryo. The cell was voltage clamped at the holding potential of −65 mV in Ca2+-free saline. The horizontal bars below the current traces indicate the time and duration of the puff pulse of hypertonic solution. The frequency of synaptic currents started to increase after about 1 s, reached a peak (23 events s−1) at 4 s after the onset of puff pulse, and gradually declined during the puff pulse. Dots above the record traces mark some of the small and slow synaptic currents that are probably synaptic currents in neighbouring cells propagated through electrical coupling (Kidokoro & Nishikawa, 1994). These slow and small events were not included in the analysis.
Typical responses are shown in Fig. 2 for four different concentrations of sucrose. With a sucrose concentration of 200 mm, the frequency increased gradually and reached a peak near the end of an 11 s puff, declining within 10 s after termination of the puff (Fig. 2A). With sucrose concentrations of 340 mm or higher, however, the response reached a peak quickly, declined gradually during the puff pulse and fell to the pre-application level within 10–15 s after the puff pulse (Fig. 2B–D). The peak frequency of the response increased continuously up to 600 mm, whereas the total number of events during the hypertonicity response peaked at 420 mm sucrose and declined slightly at higher concentrations. The dose- response curves are shown in Fig. 2E. The total number of events at 600 mm was significantly smaller than at 420 mm (P < 0.05). This decline in higher concentrations is not likely to be the result of irreversible damage to the presynaptic nerve terminal, since the peak rate was still increasing at 600 mm sucrose and since the response recovered to 83 % of the original level after 41 s, which was similar to the recovery after 420 mm sucrose.
Figure 2. Hypertonicity responses induced with different concentrations of sucrose.

Hypertonicity responses induced with 200 mm (A), 340 mm (B), 420 mm (C) and 600 mm (D) sucrose, and dose–response curves (E) obtained in wild-type embryos are shown. Synaptic currents were recorded in Ca2+-free saline, and the hypertonic solution in Ca2+-free saline was puffed through a pipette by gas pressure. The frequency of synaptic events (events s−1) is plotted against time (s). The horizontal bars indicate the time and duration of the puff pulse. E, ○, peak frequency of events (right ordinate); •, total number of events during the hypertonicity response (left ordinate). The total number of events was measured during a period of 30 s starting with the onset of the puff. Triangles are the data obtained after treatment with 200 μm forskolin; ▴, total number of events (left ordinate); ▵, peak frequency (right ordinate). The vertical bars attached to each data point indicate the standard error of the mean (s.e.m.).
Relationship between the cAMP/PKA cascade and the hypertonicity response: mutant analysis
The involvement of the cAMP/PKA cascade in the hypertonicity response was explored in Drosophila mutants that have defects in the cascade. Figure 3 compares representative hypertonicity responses in wild-type embryos (Fig. 3A) with those from three mutants: dunce (dnc, Fig. 3B), in which a defective cAMP-specific phosphodiesterase results in elevated cAMP levels (Byers et al. 1981), rutabaga (rut, Fig. 3C), in which Ca2+–calmodulin-dependent adenylyl cyclase is defective, resulting in low cAMP levels (Livingstone et al. 1984) and DC0 (Fig. 3D), in which the sole or major catalytic subunit of PKA is lacking (Lane & Kalderon, 1993). In dnc embryos, the resting spontaneous synaptic current frequency (2.0 ± 1.7 min−1, n = 36) was not different from that in wild-type (P > 0.05), but the peak frequency was clearly enhanced in sucrose solutions (36.9 ± 7.9 s−1 (n = 9) at 340 mm sucrose and 51.8 ± 17.0 s−1 (n = 9) at 420 mm sucrose, summarized in Fig. 3E for 340 mm sucrose, P < 0.01). On the other hand, the total number of events during the response in dnc was similar at all concentrations to that observed in wild-type and reached a peak at 420 mm sucrose (Fig. 3A and B, summarized in Fig. 3F). The dose–response curves for dnc and wild-type are compared in Fig. 3G.
Figure 3. Hypertonicity responses in mutants of the cAMP/PKA cascade.

Sample hypertonicity responses induced with 340 mm sucrose in wild-type (wt) (A), dnc (B), rut (C) and DC0 (D) mutant embryos are shown. The horizontal bars below the abscissa indicate the timing and duration of the puff pulse of hypertonic solution. E, peak frequencies. F, the total numbers of events in wild-type, dnc, rut and DC0 during the hypertonicity response induced by 340 mm sucrose. ** Statistical difference, P < 0.01. G, dose–response curves in dnc embryos. ○, peak frequency of events (right ordinate); •, total number of events (left ordinate). The vertical bars attached to each data point are the standard error of the mean. For comparison, the data from Fig. 2E for wild-type are also plotted (▴, total number of events; ▵, peak frequency).
The number of boutons at the neuromuscular junction is greater in third instar larvae of dnc than in wild-type (Zhong et al. 1992; Schuster et al. 1996). Hence the larger peak frequency during hypertonicity response could simply be due to the larger number of release sites in dnc. However, the growth in the synaptic area in dnc occurs mainly or entirely post-embryonically (Schuster et al. 1996). Moreover, the nerve-evoked synaptic currents are indistinguishable between dnc and wild-type embryos (see below). We conclude, therefore, that the larger peak frequency observed in dnc is not likely to be the result of structural changes in the synapses.
In rut embryos, with abnormally low levels of cAMP, the hypertonicity response was not different from that in wild-type (Fig. 3C, summarized in Fig. 3E and F). It appears that at the resting level of cAMP, the hypertonicity response is not enhanced in wild-type embryos.
On the other hand, the mutant DC0 exhibited dramatic differences. The spontaneous miniature synaptic current frequency was low (0.8 ± 0.2 min−1, n = 6), and the hypertonicity response was much smaller than in wild-type embryos (Fig. 3D). Both the peak frequency to 340 mm sucrose (13.7 ± 2.7 s−1, n = 7), and the total number of events during the response (59 ± 17, n = 7), were significantly smaller than the corresponding values in wild-type (P < 0.01, summarized in Fig. 3E and F).
These changes in DC0 could be due to developmental alterations in the structure of synapses which have been found in DC0 third instars (Renger et al. 2000). However, it seems that the developmental alterations occur post-embryonically, as in dnc. Light microscopic examination of synaptic structures of DC0 embryos using antibodies against horseradish peroxidase for presynaptic nerve terminals, and a subunit of the glutamate receptor (Saitoe et al. 1997) to label glutamate receptor clusters in the postsynaptic membrane, did not reveal any abnormalities compared with wild-type embryos (data not shown). Furthermore, nerve-evoked synaptic currents in DC0 embryos were indistinguishable from those in control embryos in various external Ca2+ concentrations (Yoshihara et al. 2000), supporting the conclusion that functional aspects of synaptic structure in DC0 and wild-type neuromuscular junctions are not different at the embryonic stage.
In conclusion, it is clear that mutations affecting the cAMP/PKA cascade modulate the hypertonicity response.
An adenylyl cyclase activator, forskolin, enhanced the hypertonicity response
Forskolin, an adenylyl cylcase activator, elevates cAMP in the presynaptic terminal of wild-type embryos, as do membrane-permeant analogues of cAMP (Yoshihara et al. 1999; Zhang et al. 1999). Use of these agents makes it possible to test the effects of varying cAMP levels on the hypertonicity response. In wild-type embryos, the frequency of spontaneous miniature synaptic currents with forskolin (200 μm) in the absence of external Ca2+ was 2.4 ± 1.3 s−1 (n = 5). This is about sixty times higher than the frequency without forskolin treatment (2.7 ± 1.1 min−1, n = 13). The hypertonicity response was also enhanced in the presence of forskolin. The peak frequency was 59.0 ± 8.6 s−1 (n = 12) with 420 mm sucrose, which is significantly larger than 42.3 ± 14.8 s−1 (n = 12) in controls (P < 0.01, Fig. 4B and C). The frequency of events declined during the puff pulse and settled at the pre-application level without reaching zero, indicating that vesicles were not depleted at any time during the response (Fig. 4B). However, the total number of events during the response (213 ± 55, n = 9), was not different from the paired control (216 ± 49, n = 10, P > 0.05, Fig. 4D). This might be due to saturation of the response; however, even at the non-saturating concentration of 340 mm, the total number of events was not different from the control. At both concentrations the peak frequency was significantly higher (P < 0.01, Fig. 2E, triangles). Thus the peak frequency of quantal release during the hypertonicity response was enhanced by an elevation of cAMP, while the total number of release events was unchanged.
Figure 4. Effects of forskolin on the hypertonicity response.

A and B, representative responses showing the effect of 200 μm forskolin; C, peak frequencies; D, total numbers of events during the hypertonicity response induced by 420 mm sucrose. The effect of 200 μm forskolin is observed in the peak frequency but not in the total number of events. ** Statistical difference, P < 0.01.
Blockers of PKA reduced the total number of events during the hypertonicity response
Next we tested the effect of PKA blockers on the hypertonicity response. Dissected wild-type embryos were incubated for 30 min in Ca2+-free saline containing 10 μm KT5720, a specific blocker of cAMP-dependent PKA (Kase et al. 1987). The frequency of miniature synaptic currents in the presence of KT5720 was 2.6 ± 2.0 min−1 (n = 10), not different from controls (P > 0.05). On exposure to a 420 mm sucrose solution, the frequency of quantal synaptic events increased quickly to a peak frequency of 42.5 ± 13.8 s−1 (n = 12), not significantly different from the response in controls (50.0 ± 15.5 s−1, n = 7, P > 0.05). However, the response declined faster during the puff pulse at KT5720-treated junctions than in controls (Fig. 5A, controls; Fig. 5B, KT5720). Moreover, the total number of hypertonicity-evoked synaptic events was 150 ± 48 (n = 12), a value significantly smaller than the controls (242 ± 48, n = 6, P < 0.01, Fig. 5C and D).
Figure 5. Effects of PKA blockers on the hypertonicity response.

Preparations were treated with PKA blockers, KT5720 (A–D) and Rp-cAMPS (E–H), for longer than 20 min, and the hypertonicity response was evoked with 420 mm sucrose in wild-type embryos. A, control; wild-type preparations were incubated in 0.5 % DMSO in Ca2+-free saline for more than 30 min before recording. B, 10 μm KT5720 was applied for more than 30 min. C, summary of results, peak frequency. D, total number of events occurring during the hypertonicity response. ** Statistical difference, P < 0.01. E, control; wild-type preparations were incubated in 2 % ethanol in Ca2+-free saline for more than 15 min before recording. F, 100 μm Rp-cAMPS was applied for more than 15 min. G, summary of results, peak frequency. H, total number of events; ** statistical difference, P < 0.01.
Another PKA blocker, Rp-cAMPS (Parker Botelho et al. 1988), was also tested at 100 μm. The frequency of miniature synaptic currents in the presence of Rp-cAMPS was 1.7 ± 1.6 min−1 (n = 10), not different from controls (P > 0.05). This blocker also reduced the total number of hypertonicity-evoked events (155 ± 71, n = 10, in Rp-cAMPS, compared with 229 ± 62, n = 22, in controls, P < 0.01). The peak frequency in the hypertonicity response (36.4 ± 12.2 s−1, n = 10) was again not different from the paired controls (41.5 ± 14.4 s−1, n = 19, P > 0.05) (Fig. 5E, control; Fig. 5F, Rp-cAMPS; summarized in Fig. 5G and H).
Thus PKA blockers reduced the total number of synaptic events during the response but did not significantly change the peak frequency. These results are different from those observed in DC0 embryos, in which both the peak frequency and total number of events were significantly reduced. It is possible that the PKA blockers at the concentrations used in the experiments have not completely suppressed the activity of PKA. Alternatively, in DC0 embryos something else might have changed as a consequence of the absence of PKA during development.
RGD peptides reduced the hypertonicity response
Recently Kashani et al. (2001) demonstrated that integrins are involved in the hypertonicity response at the frog neuromuscular junction. A peptide with the structure Gly-Arg-Gly-Asp-Ser-Pro (GRGDSP, hereafter termed RGD), which blocks binding of ligands to integrins (Pierschbacher & Ruoslahti, 1987) strongly suppressed the enhancement of spontaneous release in response to hypertonicity (Kashani et al. 2001), as it does to muscle stretch (Chen & Grinnell, 1995, 1997). A similar peptide, Gly-Arg-Gly-Glu-Ser-Pro (GRGESP, hereafter RGE) does not block integrin binding or cell adhesion (Pierschbacher & Ruoslahti, 1987) and has no effect on stretch or hypertonicity-enhanced release at frog junctions. We first tested the effect of these peptides on the hypertonicity response at 340 mm sucrose in dnc mutants, where the response is larger than in wild-type. In initial experiments, this was done ‘blindly’, i.e. the experimenters did not know which of the two peptides, RGD or RGE, was in the solution. The peak response to the 340 mm sucrose solution was 20.8 ± 6.0 s−1 (n = 8) for RGD and 45.0 ± 15.0 s−1 (n = 6) for RGE (Fig. 6A and B). These values are significantly different (P < 0.01). The total number of events during the hypertonicity response was 130 ± 41 (n = 7) for RGD and 317 ± 119 (n = 4) for RGE (significantly different at P < 0.01). Thus the effect of the peptide is specific to the RGD sequence, as is the case in stretch- and hypertonicity-induced facilitation of miniature endplate potential frequency in the frog neuromuscular junction (Chen & Grinnell, 1995, 1997; Kashani et al. 2001). These results suggest that the hypertonicity response in Drosophila neuromuscular junctions is, at least in part, mediated by interaction between integrins and proteins in the extracellular matrix.
Figure 6. Effects of integrin-blocking peptides on the hypertonicity response.
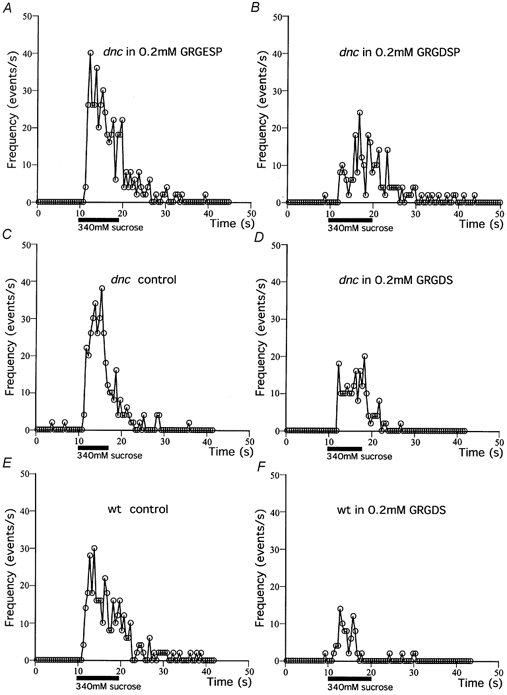
Sample experimental results show the effects of integrin-blocking peptides on the hypertonicity response in dnc and wild-type. The response was evoked with 340 mm sucrose. Peptides (0.2 mm) were added to the bath solution as well as to the hypertonic puff solution. The preparation was pretreated for 20 min in 50 μm Ca2+, 50 μm Mg2+ saline containing 0.2 mm of the peptide. A, the effect of GRGESP. B, the effect of GRGDSP in experiments that were carried out blindly, i.e. the experimenters did not know the type of peptide used during the experiments. C and D, the effect of another peptide, 0.2 mm GRGDS, in dnc. E and F, the effect of 0.2 mm GRGDS in wild-type embryos.
A more extensive series of experiments was done with dnc embryos in which the experimenters knew the content of the solution. The peak response to the 340 mm sucrose solution in the presence of 0.2 mm GRGDSP was 12.9 ± 9.5 s−1 (n = 17, including data in the blind experiment described above) in dnc. This value is significantly smaller than that without the peptide (37.6 ± 8.1 s−1, n = 9, P < 0.01) (Fig. 7A). The total number of events (70 ± 65, n = 16) was also smaller (P < 0.01, Fig. 7B).
Figure 7. The effect of various peptides on the hypertonicity response in dnc embryos.
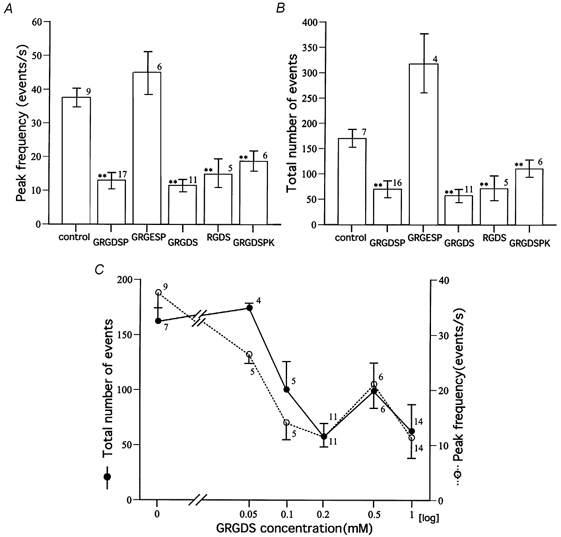
A, peak frequency during the hypertonicity response. B, total number of events during 30 s of the hypertonicity response. The peptide concentration was 0.2 mm. The vertical bar attached to each column is the standard error of the mean, and the number denotes the number of cells examined. ** Statistically significant difference from control, P < 0.01. C, dose–response curves for the inhibitory effect of GRGDS. The concentration of GRGDS peptide is plotted on a logarithmic scale on the abscissa, and the peak frequency and the total number of events during the hypertonicity response are plotted on the ordinate. The vertical bar attached to each data point is the standard error of the mean, and the number denotes the number of cells examined.
Another peptide containing the RGD sequence, GRGDS (0.2 mm), had a similar effect in dnc (Fig. 6C and D, summarized in Fig. 7A and B). The peak frequency was 12.9 ± 9.5 s−1 (n = 17), which was significantly smaller than that without the peptide (37.6 ± 8.1 s−1, n = 9, P < 0.01). Next we examined the effect of other peptides containing RGD on the hypertonicity response in dnc. As summarized in Fig. 7A and B, all four peptides tested that contained the RGD sequence were effective in reducing the response to hypertonicity, while a peptide which did not contain the RGD sequence, GRGESP, was not effective.
The dose–response relationship was next examined in dnc using GRGDS. As shown in Fig. 7C, as the peptide concentration was increased from 0.05 to 0.2 mm, the hypertonicity response progressively reduced, but at higher concentrations the blocking effect of the peptide saturated or even decreased in some cells. In any case, complete block of the response was not attained at any concentration tested.
We have also ascertained that the effect of RGD peptides on the hypertonicity response was not restricted to the mutant, dnc. In wild-type embryos, the peak frequency and the total number of events during the response to 340 mm sucrose after treatment with 0.2 mm GRGDS was 13.4 ± 5.9 s−1 (n = 10) and 79 ± 50 (n = 9), respectively, which are significantly smaller than those without the peptide (26.0 ± 5.9 s−1, n = 14, P < 0.05 and 162 ± 46, n = 14, P < 0.05, respectively) (Fig. 6E and F).
Nerve-evoked synaptic transmission was not affected by an RGD peptide
If RGD peptides affect vesicle fusion during the hypertonicity response, they might also modulate nerve-induced synaptic transmission. We therefore examined the effect of the RGD peptides on Ca2+-triggered release of synaptic vesicles. To avoid muscle contraction in these experiments we used a low Ca2+ (0.15 mm) external solution in which nerve stimulation frequently failed to evoke synaptic currents.
In wild-type embryos, the failure rate was 0.89 ± 0.07 (n = 7) in the control and 0.89 ± 0.08 (n = 8) after treatment with 0.2 mm GRGDS. These numbers are not statistically different (P > 0.05). Since the failure rate was high in this experimental condition, we were concerned about the possibility of stimulation or conduction failures mixed in the true synaptic transmission failures. To circumvent this problem we measured the amplitude of synaptic currents that were the result of successful transmission. The mean amplitude of synaptic currents was 227 ± 122 pA (n = 5) in the control and 198 ± 57 pA (n = 7) after treatment with GRGDS. Again these numbers are not statistically different (P > 0.05).
The effect of RGD peptides on the hypertonicity response was more pronounced in dnc than in wild-type. We therefore examined the effect of GRGDS on nerve-evoked synaptic currents in dnc. Again both the failure rate (0.92 ± 0.05, n = 8 in the control and 0.91 ± 0.05, n = 5 with GRGDS) and the mean amplitude (202 ± 65 pA, n = 4 in the control and 193 ± 27 pA, n = 6 with GRGDS) were not different (P > 0.05).
In summary, both in wild-type and dnc the nerve-evoked synaptic currents were not affected by GRGDS, suggesting that a steady activation of PS integrins by binding with natural ligands in the extracellular matrix does not modulate nerve-evoked synaptic transmission.
Synaptic transmission and the hypertonicity response in a mutant, myospheroid, lacking the integrin β subunit
RGD peptides do not completely suppress transmitter release induced by hypertonicity at the frog neuromuscular junction (the enhancement of release was reduced by about 40 %) (Kashani et al. 2001). The question remains, therefore, whether RGD peptides, even at high concentrations, do not completely interrupt integrin binding to natural ligands in the extracellular matrix, or whether other molecules than integrins are also involved in the hypertonicity response. Another Drosophila mutant should help directly answer this question. A lethal mutant, myospheroidXG43 (mys), does not express the βPS subunit of integrin (Liptin et al. 1989), and consequently, αPS subunits do not appear on the cell surface (MacKrell et al. 1988; Volk et al. 1990). Its hypomorphic mutant alleles affect synaptic structures and functional transmission in proportion to the severity of morphological aberrations (Beumer et al. 1999). If PS integrins were the sole mediator of the hypertonicity response, no response would be evoked in this null mutant.
Embryos of homozygous mys develop normally up to 14.5 h after fertilization. However, upon initial contraction muscle cells detach from insertion points and become spherical (MacKrell et al. 1988; Volk et al. 1990). Many of these spherical muscle cells exhibited no spontaneous synaptic currents in the Ca2+-free or 0.5 mm Ca2+ solution. These muscle cells had probably been denervated during dissection or when the muscle cells contracted and became spherical. In other muscle cells, however, spontaneous synaptic currents were observed at low frequencies (1.2 ± 0.8 min−1, n = 9) in Ca2+-free saline. The mean amplitude of miniature synaptic currents in the Ca2+-free solution was 121 ± 88 pA (28 events in 6 cells), which was somewhat smaller than that in wild-type (175 ± 31 pA, n = 7). The amplitude histogram had a skewed distribution (Fig. 8B), similar to that observed in wild-type (Zhang et al. 1999). In the presence of 0.5 mm Ca2+ in the external solution, synaptic currents were evoked by nerve stimulation as shown in Fig. 8A, indicating that PS integrins are not essential for formation of functional synapses. In accordance with this finding, in hypomorphic mutant alleles synaptic transmission is reported to persist (Beumer et al. 1999).
Figure 8. Synaptic transmission and the hypertonicity response in mys embryos.

A, nerve-evoked synaptic currents. The nerve was stimulated in the presence of 0.5 mm Ca2+ by a microelectrode placed in the ventral ganglion as described previously (Deitcher et al. 1998). Stimulation was repeated at 0.3 Hz. B, sample traces and an amplitude histogram of spontaneous miniature synaptic currents in Ca2+-free saline. Spontaneous synaptic currents were recorded before application of hypertonic solutions. Since the frequency was so low and not enough events were collected in one cell, synaptic currents in 6 cells were pooled to construct the histogram. The average amplitude was 121 ± 88 pA. C, a hypertonicity response in a mys embryo. D, a hypertonicity response in a mys embryo in the presence of 0.2 mm GRGDS. The horizontal bars below the abscissa indicate the time and duration of the hypertonic puff pulse. The frequency is plotted on the ordinate. E, absence of effect of 0.2 mm GRGDS on the peak frequency of synaptic events during the hypertonicity response in mys embryos. F, absence of effect of 0.2 mm GRGDS on the total number of events during the hypertonicity response in mys embryos.
Upon puff application of the 340 mm sucrose solution in Ca2+-free saline, the frequency of synaptic events increased to 8.5 ± 5.2 s−1 (n = 8; Fig. 8C and E). The extent of increase was smaller than in wild-type, which might be due to the absence of integrins, but which could equally well be due to defects in synapse formation, such as smaller synaptic contact areas. The total number of synaptic events during the hypertonicity response was also smaller (53 ± 48, n = 8, P < 0.01, Fig. 8F). As expected in mys, GRGDS had no significant effect on the hypertonicity response (Fig. 8D, P > 0.05, summarized in Fig. 8E and F). Thus the mys neuromuscular junction responded to hypertonicity even in the absence of PS integrins, but the response was small and an RGD peptide had no effect.
cAMP sensitivity of the RGD-unblockable component and RGD sensitivity of the PKA-independent component
In the results described above, we have shown that there are both RGD-blockable and -unblockable components to the hypertonicity response. Neuromuscular junctions in dnc embryos responded to hypertonicity with a larger peak rate of release than did wild-type junctions (Fig. 3). In the presence of RGD, however, the remaining component of the hypertonicity response (the RGD-unblockable component) was not different from wild-type in either the peak rate or the total number of events in the hypertonicity response (Fig. 9A, P > 0.05). Since our evidence suggests that the increased hypertonicity response in dnc is due to elevated levels of cAMP, this finding indicates that the RGD-blockable component is sensitive to cAMP, while the RGD-unblockable component is not.
Figure 9. Mean hypertonicity responses in dnc and wild-type after RGD block, effects of RGD on hypertonicity responses in DC0, and possible schemes for the integrin-dependent pathway.

A and B, the peak frequency (A) and the total number of events (B) in wild-type and dnc embryos in the presence of GRGDS (0.2 mm). The response was evoked with 340 mm sucrose. The data for dnc are the same as those shown in Fig. 7A and B. C and D, the peak frequency (C) and total number of events (D) in DC0 with and without GRGDSP (0.2 mm). The response was evoked with 340 mm sucrose. E, possible schemes for the RGD-blockable (integrin-dependent) pathway.
If that is the case, the hypertonicity response in DC0, which lacks the sole or major subunit of PKA, may be insensitive to RGD peptides. We tested this hypothesis and found that an RGD peptide did not affect the hypertonicity response in DC0 (Fig. 9B). This is consistent with the conclusion that the cAMP/PKA-independent component in the hypertonicity response in dnc and wild-type embryos is not blockable by RGD and not mediated by integrins.
DISCUSSION
The hypertonicity response in wild-type Drosophila embryos
The enhancement of transmitter release by hypertonic solutions has been demonstrated in a wide variety of chemical synapses (Hubbard et al. 1968; Kita & Van der Kloot, 1977; Niles & Smith, 1982; Bourque & Renaud, 1984; Tanabe & Kijima, 1988; Brosius et al. 1992; Yu & Miller, 1995; Rosenmund & Stevens, 1996; Mochida et al. 1998), and, like stretch-induced modulation, it appears to bypass the Ca2+-triggering step in exocytosis. The response is robust in the absence of external Ca2+ and persists even when terminals are loaded with BAPTA to buffer free Ca2+ or treated with thapsigargin, which disables Ca2+ sequestering mechanisms and prevents release of Ca2+ from internal stores (Tanabe & Kijima, 1988; Rosenmund & Stevens, 1996; Mochida et al. 1998). Moreover, the hypertonicity response remains at central synapses in culture obtained from homozygous mice carrying a mutation in the synaptotagmin I gene (Geppert et al. 1994). On the other hand, in hippocampal cell cultures, cleaving synaptobrevin, SNAP-25 or syntaxin by clostridial neurotoxins blocks the response to hypertonic saline (Capogna et al. 1997), and at Drosophila neuromuscular junctions, the response to hypertonicity is eliminated by the absence of neuronal-synaptobrevin, syntaxin or Unc-13 (Aravamudan et al. 1999). Thus hypertonicity seems to bypass the Ca2+-sensing mechanism but share a basic transmitter release mechanism with Ca2+-triggered vesicle fusion.
The dose–response curve for the total number of quantal synaptic events during the hypertonicity response peaked at 420 mm sucrose and declined slightly at higher concentrations (Fig. 2E). In embryos with elevated cAMP, i.e. wild-type treated with forskolin (Fig. 2E, Fig. 4B and C) and dnc (Fig. 3B, E and G), the peak frequency in the hypertonicity response was increased, but not the total number of quanta released. Thus the total number of quantal synaptic events occurring during the hypertonicity response seems to have a ceiling. If we interpret the maximum number of events occurring during the hypertonicity response to be the size of a pool (Stevens & Tsujimoto, 1995; Rosenmund & Stevens, 1996), it is approximately 230 quanta in this preparation. However, two observations are inconsistent with this interpretation. First, the hypertonicity response to 420 mm sucrose did not affect the persistence of a high rate of spontaneous release after the response (Fig. 4B). If the hypertonicity response with 420 mm sucrose had emptied the pool, spontaneous release should have decreased below original levels or ceased transiently after the response. Secondly, although the dose–response curve for the total number of events peaked at 420 mm sucrose, the value at 600 mm sucrose was significantly smaller than at 420 mm, suggesting that at very high concentrations of sucrose another effect of hypertonicity reveals itself and suppresses vesicle release. Thus we consider it probable that the peak in the total number of events at 420 mm does not reflect the ceiling imposed by the size of a pool.
We tentatively propose an alternative hypothesis for the mechanism underlying the hypertonicity response as follows: independent of Ca2+, the hypertonicity facilitates vesicle fusion as well as recruitment of vesicles to release sites, at least in part, by activating cellular signal transduction mechanisms, such as the cAMP/PKA cascade.
The cAMP/PKA cascade is involved in the hypertonicity response
The peak frequency of quantal synaptic events during the hypertonicity response was greater in dnc than in wild-type (Fig. 3A and B, summarized in Fig. 3E), and forskolin increased it in wild-type embryos (Fig. 4A and B, summarized in Fig. 4C). Thus it appears that an elevation of cAMP in the terminal enhances the hypertonicity response. In contrast, in DC0 embryos, which are lacking the sole or major subunit of PKA (Lane & Kalderon, 1993), both the peak frequency and the total number of events were reduced to less than 50 % of control (Fig. 3D, summarized in Fig. 3E and F). In this mutant neither forskolin nor membrane-permeant analogues of cAMP increase the frequency of quantal transmitter release, regardless of the presence of external Ca2+ (Yoshihara et al. 2000). Furthermore, the total number of events was smaller after treatment with PKA inhibitors (Fig. 5). Taken together, we conclude that the cAMP/PKA cascade is involved in the hypertonicity response.
The two parameters we measured, i.e. the peak frequency and the total number of events during the hypertonicity response, did not change in parallel under various conditions. The peak frequency was enhanced in dnc and in wild-type treated with forskolin, but the total number of events was not different from that in the control (Fig. 3F and Fig. 4D). In wild-type embryos, treatment with PKA inhibitors reduced the total number of events but not the peak rate. Thus these two parameters may reflect separate steps that lead to vesicle fusion during the hypertonicity response. The peak frequency may mainly depend on factors such as the number of vesicles docked/primed, the maximum release rate induced by hypertonicity and the docking/priming rate. In dnc and in wild-type embryos treated with forskolin, the number of vesicles docked/ primed, or the docking/priming rate may be larger, and consequently the peak frequency is higher. On the other hand, the total number of events could be more heavily affected by other factors, such as the time course of increase in the release rate induced by hypertonicity and the rate with which vesicles are recruited to the release sites. In the presence of PKA inhibitors, the recruitment process may be compromised while the number of vesicles already docked/primed is not affected, and as the result the peak frequency is not reduced. In the complete absence of PKA in DC0 both factors may be reduced. Examining these parameters separately could be useful in assessing the steps in transmitter release in the absence of Ca2+.
Involvement of PS integrins in the hypertonicity response
Our results show clearly that PS integrins play an important role in the response to hypertonicity, but they are not responsible for the entire response. In dnc embryos, peptides containing the RGD sequence reduced the peak frequency by 50–70 % (Fig. 7A), but even at higher concentrations did not totally eliminate the hypertonicity response (Fig. 7C). Pretreatment in saline containing 50 μm Ca2+ and 50 μm Mg2+ would be expected to destabilize the integrin-native ligand bonds (Gailit & Ruoslahti, 1988; Kirchofer et al. 1991). When the preparations were returned to the high divalent (zero Ca2+, 6 mm Mg2+) saline containing 0.2 mm RGD, the peptides presumably out-competed the native ligands for most of the integrin bonds formed. The 30–50 % of the hypertonicity response that persisted in the presence of the peptide might reflect the presence of some remaining integrin-ligand bonds, or might be a measure of an integrin-independent hypertonicity effect.
The results with mys showed that a significant hypertonicity effect persists in the absence of any PS integrins at the synapse (Fig. 8C) and that an RGD-containing peptide had no apparent effect on the hypertonicity response in mys (Fig. 8D). It seems probable that much of the response that persists in wild-type or dnc embryos after the treatment with high concentrations of RGD peptides also results from an integrin-independent mechanism. Cells from mys embryos do attach to a laminin substrate and connections do form between cells (MacKrell et al. 1988; Volk et al. 1990). Thus other molecules than PS integrins can mediate adhesion between cells. Physical tension in these molecules due to cell shrinkage might be able to act via a different pathway to contribute to the hypertonicity response.
In summary, there are two components in the hypertonicity response: one that can be blocked by RGD-containing peptides (PS integrin-dependent) and one that is not blockable by RGD (PS integrin-independent).
The RGD-sensitive component is mediated by the cAMP/PKA cascade
Our data indicate that the integrin-dependent component of the hypertonicity response involves the cAMP/PKA cascade, while the integrin-independent component does not. Thus after RGD treatment the hypertonicity response in dnc, in which the cAMP level is high, is not different from that in RGD-treated wild-type (Fig. 9A), whereas the cAMP/PKA cascade clearly modulated the hypertonicity response when the preparations were not treated with RGD peptides (Figs 3 and 4). Conversely, the hypertonicity response in DC0 (PKA-independent) was not sensitive to an RGD peptide (Fig. 9B). These observations led us to conclude that the RGD-blockable component is mediated by the cAMP/PKA cascade.
Two alternative mechanisms that might explain our observations on the RGD-blockable component of the hypertonicity response are shown in Fig. 9E. In Scheme 1, the hypertonicity stimulates PS integrins that activate the cAMP/PKA cascade and facilitate quantal transmitter release. Thus the elimination of PKA by the DC0 mutation obliterates this whole pathway. In Scheme 2, the integrin pathway is activated at the resting state by the cAMP/PKA cascade, enabling hypertonicity to initiate quantal transmitter release. The elimination of PKA brings the integrin pathway into an inactivated state in which hypertonicity no longer induces transmitter release through this pathway. However, in rut, in which the cAMP level is low, the hypertonicity response was not different from that in wild-type (Fig. 3C, summarized in Fig. 3E and F). This finding suggests that the cAMP/PKA cascade is not activating the integrin pathway in the resting state. Thus we prefer Scheme 1 in which the cAMP/PKA cascade is situated downstream of PS integrins. This scheme is in accordance with our previous observation that cAMP by itself facilitates quantal transmitter release in the absence of external Ca2+ (Yoshihara et al. 1999; Zhang et al. 1999; Yoshihara et al. 2000).
An elevation of cellular cAMP levels after mechanical stress on liganded integrins has been documented in endothelial cells. Ferromagnetic microbeads coated with an integrin ligand, a synthetic peptide containing the RGD sequence, were attached to the cell surface, and mechanical stress was given by a magnetic twisting device. The cAMP level was elevated threefold in cells in which magnetic twist was applied compared with cells with no beads attached. The focal adhesion complex is formed between integrins in the cell surface membrane and ligand molecules on the beads and transmits a stress signal to the cAMP/PKA cascade in the cell (Meyer et al. 2000). Also, in mouse lymphoma cells mechanical forces induced by hypotonicity on the cell surface stimulate the activity of adenylyl cyclase and elevate the intracellular level of cAMP (Watson, 1990). Thus it is plausible that PS integrins are linked to the cAMP/PKA cascade. PS integrins are strategically well situated at the Drosophila neuromuscular junction, being localized in the peri-active zone surrounding the release site (Sone et al. 2000). Cyclic AMP facilitates vesicle release (Yoshihara et al. 1999; Zhang et al. 1999; Yoshihara et al. 2000) and enhances recruitment of vesicles from the reserve pool for further release (Kuromi & Kidokoro, 2000).
In conclusion, we suggest that a major component of the hypertonicity response is due to mechanical stress that is transmitted through the presynaptic membrane by integrins situated near the release site and that tension on integrins activates the cAMP/PKA cascade. Local elevation of cAMP concentration facilitates recruitment and fusion of synaptic vesicles. Another component of the hypertonicity response is integrin independent and does not work through cAMP/PKA. These two components may reflect action on different steps leading to vesicle fusion. Both components are independent of Ca2+. The hypertonicity response seems to reflect multiple steps leading to vesicle fusion, which are independent of Ca2+. Various Drosophila mutants with defects in synaptic transmission may provide us with a unique opportunity to dissect those steps.
Acknowledgments
This work was supported by a grant-in-aid from the Ministry of Education, Science, Sports and Culture (to Y.K.), a fellowship for research in Japan from the Japan Society for the Promotion of Science (to A.D.G.), an NIH grant (to A.D.G.) and a NASA grant NAG-3964 (to A.D.G.). We thank Dr H. Kuromi for his insightful discussion and Dr T. Okamoto for participating in some of the experiments.
REFERENCES
- Aravamudan B, Fergestad T, Davis WS, Roedesch CK, Broadie K. Drosophila Unc-13 is essential for synaptic transmission. Nature Neuroscience. 1999;2:965–971. doi: 10.1038/14764. [DOI] [PubMed] [Google Scholar]
- Beumer KJ, Rohrbough J, Prokop A, Broadie K. A role for PS integrins in morphological growth and synaptic function at the postembryonic neuromuscular junction of Drosophila. Development. 1999;126:5833–5846. doi: 10.1242/dev.126.24.5833. [DOI] [PubMed] [Google Scholar]
- Bourque CW, Renaud LP. Activity patterns and osmosensitivity of rat supraoptic neurones in perfused hypothalamic explants. Journal of Physiology. 1984;349:631–642. doi: 10.1113/jphysiol.1984.sp015178. [DOI] [PMC free article] [PubMed] [Google Scholar]
- Brosius DC, Hackett JT, Tuttle JB. Ca2+-independent and Ca2+-dependent stimulation of quantal neurosecretion in avian ciliary ganglion neurons. Journal of Neurophysiology. 1992;68:1229–1234. doi: 10.1152/jn.1992.68.4.1229. [DOI] [PubMed] [Google Scholar]
- Byers D, Davis RL, Kiger JA. Defect in cyclic AMP phosphodiesterase due to the dunce mutation of learning in Drosophila melanogaster. Nature. 1981;289:79–81. doi: 10.1038/289079a0. [DOI] [PubMed] [Google Scholar]
- Capogna M, McKinney RA, O'Connor V, Gähwiler BH, Thompson SM. Ca2+ or Sr2+ partially rescues synaptic transmission in hippocampal cultures treated with botulinum toxin A and C, but not tetanus toxin. Journal of Neuroscience. 1997;17:7190–7202. doi: 10.1523/JNEUROSCI.17-19-07190.1997. [DOI] [PMC free article] [PubMed] [Google Scholar]
- Chen B-M, Grinnell AD. Regulation of transmitter release by muscle length in frog motor nerve terminals: Dynamics of the effect and role of integrin-ECM interactions. In: Stjäne L, editor. Molecular and Cellular Mechanisms of Neurotransmitter Release. New York: Raven Press; 1994. [PubMed] [Google Scholar]
- Chen B-M, Grinnell AD. Integrins and modulation of transmitter release from motor nerve terminals by stretch. Science. 1995;269:1578–1580. doi: 10.1126/science.7667637. [DOI] [PubMed] [Google Scholar]
- Chen B-M, Grinnell AD. Kinetics, Ca2+ dependence, and biophysical properties of integrin-mediated mechanical modulation of transmitter release from frog motor nerve terminals. Journal of Neuroscience. 1997;17:904–916. doi: 10.1523/JNEUROSCI.17-03-00904.1997. [DOI] [PMC free article] [PubMed] [Google Scholar]
- Clark EA, Brugge JS. Integrins and signal transduction pathways: The road taken. Science. 1995;268:233–239. doi: 10.1126/science.7716514. [DOI] [PubMed] [Google Scholar]
- Cohen MW, Hoffstrom BG, Desimone DW. Active zones on motor nerve terminals contain α3β1 integrins. Journal of Neuroscience. 2000;20:4912–4921. doi: 10.1523/JNEUROSCI.20-13-04912.2000. [DOI] [PMC free article] [PubMed] [Google Scholar]
- Deitcher DL, Ueda A, Stewart BA, Burgess RW, Kidokoro Y, Schwarz TL. Distinct requirements for evoked and spontaneous release of neurotransmitter are revealed by mutations in the Drosophila gene neuronal-synaptobrevin. Journal of Neuroscience. 1998;15:2028–2039. doi: 10.1523/JNEUROSCI.18-06-02028.1998. [DOI] [PMC free article] [PubMed] [Google Scholar]
- Fatt P, Katz B. Spontaneous subthreshold activity at the motor nerve endings. Journal of Physiology. 1952;117:109–128. [PMC free article] [PubMed] [Google Scholar]
- Gailit J, Ruoslahti E. Regulation of the fibronectin receptor affinity by divalent cations. Journal of Biological Chemistry. 1988;263:12927–12932. [PubMed] [Google Scholar]
- Geppert M, Goda Y, Hammer RE, Li C, Rosahl TW, Stevens CF, Südhof TC. Synaptotagmin 1: A major Ca2+ sensor for transmitter release at a central synapse. Cell. 1994;79:717–727. doi: 10.1016/0092-8674(94)90556-8. [DOI] [PubMed] [Google Scholar]
- Hubbard JI, Jones SF, Landau EM. An examination of the effects of osmotic pressure changes upon transmitter release from mammalian motor nerve terminals. Journal of Physiology. 1968;197:639–657. doi: 10.1113/jphysiol.1968.sp008579. [DOI] [PMC free article] [PubMed] [Google Scholar]
- Kandel ER, Schwartz JH. Molecular biology of learning: Modulation of transmitter release. Science. 1982;218:433–443. doi: 10.1126/science.6289442. [DOI] [PubMed] [Google Scholar]
- Kase H, Iwahashi K, Nakanishi S, Matsuda Y, Yamada K, Takahashi M, Murakata C, Sato A, Kaneko M. K-252 compounds, novel and potent inhibitors of protein kinase C and cyclic nucleotide-dependent protein kinases. Biochemical and Biophysical Research Communications. 1987;142:436–440. doi: 10.1016/0006-291x(87)90293-2. [DOI] [PubMed] [Google Scholar]
- Kashani A, Chen B-M, Grinnell AD. Hypertonic enhancement of transmitter release from frog motor nerve terminals: Ca2+ independence and role of integrins. Journal of Physiology. 2001;530:243–252. doi: 10.1111/j.1469-7793.2001.0243l.x. [DOI] [PMC free article] [PubMed] [Google Scholar]
- Kidokoro Y, Nishikawa K. Miniature endplate currents at the newly formed neuromuscular junction in Drosophila embryos and larvae. Neuroscience Research. 1994;19:143–154. doi: 10.1016/0168-0102(94)90137-6. [DOI] [PubMed] [Google Scholar]
- Kirchofer D, Grzesiak J, Pierschbacher MD. Calcium as a potential physiological regulator of integrin-mediated cell adhesion. Journal of Biological Chemistry. 1991;266:4471–4477. [PubMed] [Google Scholar]
- Kita H, Van der Kloot W. Time course and magnitude of effects of changes in tonicity on acetylcholine release at frog neuromuscular junction. Journal of Neurophysiology. 1977;40:212–224. doi: 10.1152/jn.1977.40.2.212. [DOI] [PubMed] [Google Scholar]
- Kuromi H, Kidokoro Y. The tetanic stimulation recruits vesicles from reserve pool via a cAMP-mediated process in Drosophila synapses. Neuron. 2000;27:133–143. doi: 10.1016/s0896-6273(00)00015-5. [DOI] [PubMed] [Google Scholar]
- Lane ME, Kalderon D. Genetic investigation of cAMP-dependent protein kinase function in Drosophila development. Genes and Development. 1993;7:1229–1243. doi: 10.1101/gad.7.7a.1229. [DOI] [PubMed] [Google Scholar]
- Liptin M, Bogaert T, Lehmann R, Wilcox M. The function of PS integrins during Drosophila embryogenesis. Cell. 1989;56:401–408. doi: 10.1016/0092-8674(89)90243-2. [DOI] [PubMed] [Google Scholar]
- Livingstone MS, Sziber PP, Quinn WG. Loss of calcium/calmodulin responsiveness in adenylate cyclase of rutabaga, Drosophila learning mutant. Cell. 1984;37:205–215. doi: 10.1016/0092-8674(84)90316-7. [DOI] [PubMed] [Google Scholar]
- MacKrell AJ, Blumberg B, Haynes SR, Fessler JH. The lethal myospheroid gene of Drosophila encodes a membrane protein homologous to vertebrate integrin β subunits. Proceedings of the National Academy of Sciences of the USA. 1988;85:2633–2637. doi: 10.1073/pnas.85.8.2633. [DOI] [PMC free article] [PubMed] [Google Scholar]
- Meyer CJ, Alenghat FJ, Rim P, Fong J H-J, Fabry B, Ingber DE. Mechanical control of cyclic AMP signaling and gene transcription through integrins. Nature Cell Biology. 2000;2:666–668. doi: 10.1038/35023621. [DOI] [PubMed] [Google Scholar]
- Mochida S, Yokoyama CT, Kim DK, Itoh K, Catterall WA. Evidence for a voltage-dependent enhancement of neurotransmitter release mediated via the synaptic protein interaction site of N-type Ca2+ channels. Proceedings of the National Academy of Sciences of the USA. 1998;95:14523–14528. doi: 10.1073/pnas.95.24.14523. [DOI] [PMC free article] [PubMed] [Google Scholar]
- Niles WD, Smith DO. Effects of hypertonic solutions on quantal transmitter release at the crayfish neuromuscular junction. Journal of Physiology. 1982;329:185–202. doi: 10.1113/jphysiol.1982.sp014297. [DOI] [PMC free article] [PubMed] [Google Scholar]
- Nishikawa K, Kidokoro Y. Junctional and extrajunctional glutamate receptor channels in Drosophila embryos and larvae. Journal of Neuroscience. 1995;15:7905–7915. doi: 10.1523/JNEUROSCI.15-12-07905.1995. [DOI] [PMC free article] [PubMed] [Google Scholar]
- Parker Botelho LH, Rothermel JD, Coombs RV, Jastorff B. cAMP analog antagonists of cAMP action. Methods in Enzymology. 1988;159:159–172. doi: 10.1016/0076-6879(88)59017-1. [DOI] [PubMed] [Google Scholar]
- Pierschbacher MD, Ruoslahti E. Influence of stereochemistry of the sequence Arg-Gly-Asp-Xaa on binding specificity in cell adhesion. Journal of Biological Chemistry. 1987;262:17294–17298. [PubMed] [Google Scholar]
- Prokop A, Martin-Bermudo MD, Bate M, Brown NH. Absence of PS integrins or laminin A affects extracellular adhesion, but not intracellular assembly, of hemiadherens and neuromuscular junctions in Drosophila embryos. Developmental Biology. 1998;196:58–76. doi: 10.1006/dbio.1997.8830. [DOI] [PubMed] [Google Scholar]
- Renger JJ, Ueda A, Atwood HL, Govind CK, Wu C-F. Role of cAMP cascade in synaptic stability and plasticity: Ultrastructural and physiological analyses of individual synaptic boutons in Drosophila memory mutants. Journal of Neuroscience. 2000;20:3980–3992. doi: 10.1523/JNEUROSCI.20-11-03980.2000. [DOI] [PMC free article] [PubMed] [Google Scholar]
- Rosenmund C, Stevens CF. Definition of the readily releasable pool of vesicles at hippocampal synapses. Neuron. 1996;16:1197–1207. doi: 10.1016/s0896-6273(00)80146-4. [DOI] [PubMed] [Google Scholar]
- Saitoe M, Tanaka S, Takata K, Kidokoro Y. Neural activity affects distribution of glutamate receptors during neuromuscular junction formation in Drosophila embryos. Developmental Biology. 1997;184:48–60. doi: 10.1006/dbio.1996.8480. [DOI] [PubMed] [Google Scholar]
- Schuster CM, Davis GW, Fetter RD, Goodman CS. Genetic dissection of structural and functional components of synaptic plasticity. II. Fasciclin II controls presynaptic structural plasticity. Neuron. 1996;17:655–667. doi: 10.1016/s0896-6273(00)80198-1. [DOI] [PubMed] [Google Scholar]
- Sone M, Suzuki E, Hoshino M, Hou D, Kuromi H, Fukata M, Kuroda S, Kaibuchi K, Nabeshima Y-I, Hama C. Synaptic development is controlled in the periactive zones of Drosophila synapses. Development. 2000;127:4157–4168. doi: 10.1242/dev.127.19.4157. [DOI] [PubMed] [Google Scholar]
- Stevens CF, Tsujimoto T. Estimates for the pool size of releasable quanta at a single central synapse and for the time required to refill the pool. Proceedings of the National Academy of Sciences of the USA. 1995;92:846–849. doi: 10.1073/pnas.92.3.846. [DOI] [PMC free article] [PubMed] [Google Scholar]
- Suzuki K, Grinnell AD, Kidokoro Y. Quantal transmitter release induced by hypertonic solutions at the Drosophila neuromuscular junction; effects of RGD peptides and cyclic AMP. Society for Neuroscience Abstracts. 2000;26:887. [Google Scholar]
- Tanabe N, Kijima H. Transmitter release at frog endplate loaded with a Ca2+ chelator, BAPTA: hypertonicity and erythrosin B augment the release independently of internal Ca2+ Neuroscience Letters. 1988;92:52–57. doi: 10.1016/0304-3940(88)90741-0. [DOI] [PubMed] [Google Scholar]
- Volk T, Fessler LI, Fessler JH. A role for integrin in the formation of sarcomeric cytoarchitecture. Cell. 1990;63:525–536. doi: 10.1016/0092-8674(90)90449-o. [DOI] [PubMed] [Google Scholar]
- Yoshihara M, Suzuki K, Kidokoro Y. Two independent pathways mediated by cAMP and protein kinase A enhance spontaneous transmitter release at Drosophila neuromuscular junctions. Journal of Neuroscience. 2000;20:8315–8322. doi: 10.1523/JNEUROSCI.20-22-08315.2000. [DOI] [PMC free article] [PubMed] [Google Scholar]
- Yoshihara M, Ueda A, Zhang D, Deitcher DL, Schwarz TL, Kidokoro Y. Selective effects of neuronal-synaptobrevin mutations on transmitter release evoked by sustained versus transient Ca2+ increases and by cAMP. Journal of Neuroscience. 1999;19:2432–2441. doi: 10.1523/JNEUROSCI.19-07-02432.1999. [DOI] [PMC free article] [PubMed] [Google Scholar]
- Yu W, Miller RF. Hyperosmotic activation of transmitter release from presynaptic terminals onto retinal ganglion cells. Journal of Neuroscience Methods. 1995;62:159–168. doi: 10.1016/0165-0270(95)00071-2. [DOI] [PubMed] [Google Scholar]
- Wang N, Butler JP, Ingber DE. Mechanotransduction across the cell surface and through the cytoskeleton. Science. 1993;260:1124–1127. doi: 10.1126/science.7684161. [DOI] [PubMed] [Google Scholar]
- Watson PA. Direct stimulation of adenylate cyclase by mechanical forces in S49 mouse lymphoma cells during hyposmotic swelling. Journal of Biological Chemistry. 1990;265:6569–6575. [PubMed] [Google Scholar]
- Zhang D, Kuromi H, Kidokoro Y. Activation of metabotropic glutamate receptors enhances synaptic transmission at the Drosophila neuromuscular junction. Neuropharmacology. 1999;38:645–657. doi: 10.1016/s0028-3908(98)00232-9. [DOI] [PubMed] [Google Scholar]
- Zhong Y, Budnik V, Wu C-F. Synaptic plasticity in Drosophila memory and hyperexcitability mutants: role of cAMP cascade. Journal of Neuroscience. 1992;12:644–651. doi: 10.1523/JNEUROSCI.12-02-00644.1992. [DOI] [PMC free article] [PubMed] [Google Scholar]