

Abstract
The volume of the extracellular compartment (tubular system) within intact muscle fibres from cane toad and rat was measured under various conditions using confocal microscopy. Under physiological conditions at rest, the fractional volume of the tubular system (t-sysVol) was 1.38 ± 0.09 % (n = 17), 1.41 ± 0.09 % (n = 12) and 0.83 ± 0.07 % (n = 12) of the total fibre volume in the twitch fibres from toad iliofibularis muscle, rat extensor digitorum longus muscle and rat soleus muscle, respectively. In toad muscle fibres, the t-sysVol decreased by 30 % when the tubular system was fully depolarized and decreased by 15 % when membrane cholesterol was depleted from the tubular system with methyl-β-cyclodextrin but did not change as the sarcomere length was changed from 1.93 to 3.30 μm. There was also an increase by 30 % and a decrease by 25 % in t-sysVol when toad fibres were equilibrated in solutions that were 2.5-fold hypertonic and 50 % hypotonic, respectively. When the changes in total fibre volume were taken into consideration, the t-sysVol expressed as a percentage of the isotonic fibre volume did actually decrease as tonicity increased, revealing that the tubular system in intact fibres cannot be compressed below 0.9 % of the isotonic fibre volume. The results can be explained in terms of forces acting at the level of the tubular wall. These observations have important physiological implications showing that the tubular system is a dynamic membrane structure capable of changing its volume in response to the membrane potential, cholesterol depletion and osmotic stress but not when the sarcomere length is changed in resting muscle.
In skeletal muscle fibres excitation spreads from the surface via a network of transverse (Melzer et al. 1995), longitudinal (Posterino et al. 2000) and helicoidal (Peachey & Eisenberg, 1978) tubular structures which, for the purpose of this study, will be referred to as the tubular (t-) system. The t-system is a dynamic structure and is known to play roles in volume regulation, membrane repair and water balance (Krolenko & Lucy, 2001). At present, quantitative measurements of t-system dimensions in skeletal muscle fibres have been derived mainly from electron microscopy (EM) studies after the muscle preparations were fixed, dehydrated and stained prior to sectioning. From these EM studies the fractional volume of the t-system (t-sysVol; expressed as a fraction of total fibre volume) was estimated to be 0.14–0.28 % in slow-twitch mammalian muscle (Luff & Atwood, 1971; Eisenberg, 1983; Cullen et al. 1984; Dulhunty, 1984), 0.27–0.69 % in fast-twitch mammalian muscle (Peachey, 1965; Peachey & Schild, 1968; Luff & Atwood, 1971; Eisenberg et al. 1974; Cullen et al. 1984; Dulhunty, 1984) and 0.2–0.35 % for twitch amphibian muscle (Peachey, 1965; Peachey & Schild, 1968; Eisenberg et al. 1974). Since the t-system is a dynamic structure, it is likely that dimensions derived from EM studies differ from those in the living skeletal muscle fibres. Furthermore, it is important to understand how the t-system handles various stresses that are expected to cause dynamic changes in the t-system. Such changes cannot be fully documented by EM studies (Franzini-Armstrong et al. 1978). A method of determining the t-sysVol in intact, normally polarized skeletal muscle fibres under various conditions would be valuable to the understanding of these phenomena.
A fluorescent marker applied in extracellular solution to visualize the t-system was previously used by Endo (1966) with frog skeletal muscle fibres and Soeller & Cannell (1999) with cardiac myocytes. We have also previously imaged the t-system of toad skeletal muscle by confocal microscopy with a fluorescent marker applied in extracellular solution (Launikonis & Stephenson, 2001) and in the present study we extend this method to determine the t-sysVol of rat and toad skeletal muscle and examine the influence of various physiological changes on t-sysVol. The results show that most EM studies have underestimated the t-sysVol of intact skeletal muscle fibres and that the t-system is capable of global changes in its volume in response to changes in osmotic pressure, membrane potential and membrane cholesterol content. Some of these results have been presented to The Physiological Society (Stephenson & Launikonis, 2001).
METHODS
Preparation and imaging of muscle fibres
The Animal Ethics and Experimentation Committee at La Trobe University approved the use and killing method of all animals in this study. Male rats (Long Evans, hooded; 3 months old) were killed under deep anaesthesia with halothane (2 % v/v). The extensor digitorum longus (EDL) and soleus muscles were dissected and well blotted on filter paper (Whatman no. 1) and then placed on a layer of Sylgard 184 (Dow Chemicals, Midland, MI, USA) in a Petri dish and immersed in a layer of paraffin oil or in a rat physiological solution, which contained (mm): NaCl, 145; KCl, 3; CaCl2, 4; MgCl2, 2; and Hepes, 10 (pH 7.4 with NaOH). The osmolality of this solution was determined to be 280 mosmol kg−1 with a Vapour Pressure Osmometer (Wescor). Cane toads (Bufo marinus) were stunned with a heavy blow to the head and killed by double pithing. The iliofibularis muscles were dissected and similarly blotted and placed on a layer of Sylgard in a Petri dish either under a layer of paraffin oil or in a toad physiological solution, which contained (mm): NaCl, 112; KCl, 3.3; MgCl2, 1; CaCl2, 2.5; and Hepes, 20 (pH 7.4 with NaOH). All toad solutions had an osmolality of 255 mosmol kg−1, except where indicated. In some experiments, toad muscles were depolarized in physiological solutions with raised [K+] (to 20 and 115 mm), with a [K+][Cl−] product close to 400 mm2. For 20 mm K+, the physiological solution contained (mm): K+, 20; Na+, 95; Ca2+, 3; Cl−, 20; hexamethylenediamine tetraacetate (HDTA2-; Fluka, Buchs, Switzerland), 52; Mg2+, 1; sucrose, 37; and Hepes, 20 (pH 7.4). The 115 mm K+ physiological solution contained (mm): K+, 115; HDTA2-, 52; Mg2+, 1; Ca2+, 2.5; Cl−, 3.5; sucrose, 40; and Hepes, 20 (pH 7.4). These solutions were assumed to produce membrane potentials of −48 and 0 mV in the muscle, respectively (Hodgkin & Horowicz, 1959). The osmotic strength of the physiological solutions was raised and lowered to desired levels by the addition of appropriate amounts of sucrose and by simple dilution, respectively (Blinks, 1965), when required. In other experiments, methyl-β-cyclodextrin (MβCD; Aldrich, Milwaukee, WI, USA) was added to toad physiological solution to reduce membrane cholesterol content (Launikonis & Stephenson, 2001).
Intact fibre bundles were cut from tendon to tendon from the twitch portion of the iliofibularis muscle of the toad and from the EDL and soleus muscles of the rat (diameter range: 0.6–2.0 mm) and were placed on a coverslip under paraffin oil at slack length. In some experiments single intact fibres from the iliofibularis muscle were used. A ‘dye solution’, containing the Ca2+-sensitive dye fluo-3 (pentaammonium salt; Molecular Probes, Eugene, OR, USA) dissolved (1 mm) in toad or rat physiological solution, was administered to the muscle preparation with a microcap (Drummond, Broomall, PA, USA) along the edge of the preparation where it met the coverslip. The dye solution was applied ‘in excess’ so that a relatively large pool of dye solution remained around the preparation and was left to equilibrate with the preparation.
Coverslips with dye-loaded preparations were placed on the stage of an inverted Leitz laser (Ar ion; excitation wavelength 488 nm) scanning confocal microscope and images were obtained with × 40 (NA 1.3) or × 63 (NA 1.4) oil immersion lenses. Preparations were scanned in x-y mode, averaging 16 scans line−1; all images were stored on an optical disk for later analysis. Any damage to a muscle fibre could be easily identified by the increased background fluorescence as a result of fluo-3 and Ca2+ entry into the myoplasm and local contraction. The preparations were also checked for vacuolation of the t-system (Krolenko et al. 1995), which could be easily identified by imaging preparations at higher zoom factors. Measurements were obtained strictly from fibres that did not display any obvious damage or vacuolation.
Measurements of t-sysVol
It was important to make measurements 15–25 μm from the top of the coverslip in the same optical slice to minimize edge effects and differences in light intensity changes as it passed through different regions of the sample. Calculations of t-sysVol (see below) at the extremes of this range were found not to produce significantly different results (Student's one-sampled t test, P > 0.1). As calculation of t-sysVol required the measurement of two distinct fluorescence signals from the same optical slice, which differed by about two orders of magnitude (see Fig. 1A), it was important that the signal from the dye solution was close to the maximum detectable by our system so that the weaker signal from within the fibre could be maximized. It therefore became important that no pixel intensity showed saturation for the fluorescence measurement in the dye solution. A signal overflow could be easily identified by a change in pixel colour to blue from the normal range (see Fig. 1). The pixel size for all t-sysVol measurements was 0.245 μm × 0.245 μm and lowering the pixel size to 0.061 μm × 0.061 μm did not have any significant effect on the results.
Figure 1. Confocal images of skeletal muscle fibres with fluo-3 applied extracellularly.

A, single intact toad fibre showing a weak banded fluorescence pattern within the fibre and bands of strongly fluorescing dye solution around the fibre. Inset, enhanced fluorescence signal from within the fibre showing the t-system. B and C, banded fluorescence pattern showing the t-sytem in rat EDL and soleus fibres, respectively. D shows the fluorescent dye solution between two toad fibres. The average fluorescence signal between the lines indicated by 1 and 2 (5 pixels long) was measured pixel-by-pixel to show that no significant binding of fluo-3 to membrane occurred; this would be indicated by an increase in fluorescence intensity near the apparent dye solution-membrane boundary. The average fluorescence intensity (in arbitrary units, au) at each line of pixels is shown in E (±s.d. is shown where the error bar is bigger than the symbol). Scale bars represent 20 μm (A), 5 μm (B and C) or 1.2 μm (D).
The t-sysVol could be estimated from the ratio between the average fluo-3 fluorescence intensity per pixel in the fibre and that in the dye solution surrounding the preparation in the same optical slice (see Fig. 1) if the fluorescence intensity within the fibre is proportional to the volume occupied by the dye in the t-system. The properties of fluo-3 ensure that fluorescence is only emitted from the space within the muscle preparation open to the extracellular environment (ie. the t-system) as the dye is applied extracellularly and is membrane impermeant. Also, fluo-3 is strongly fluorescent only in its Ca2+-bound form and therefore the millimolar Ca2+ in the t-system will ensure a strong fluorescence signal whereas any leakage of fluo-3 into the myoplasm will negligibly contribute to the fluorescence signal. The fibre autofluorescence was negligible and in control experiments where the preparation was kept in the dye solution for about 1 h, there was no increase in background fibre fluorescence before addition and after subsequent rapid removal (approximately 5 min) of the dye, indicating that no measurable amount of fluo-3 could have entered the sarcoplasmic reticulum during the incubation period. The low molecular mass of fluo-3 (855 Da) also allows this dye to penetrate into caveolae, which have narrow openings that may exclude larger fluorescent markers.
In view of the comments made above we are confident that the fluorescence intensity within the fibre is directly related to the fibre volume connected to the extracellular environment, which, for the purpose of this study, is equated to the t-system. Therefore, the t-sysVol was calculated as follows. Five equally spaced lines scanning at least 50 sarcomeres within the fibre parallel to its longitudinal axis and at least 10 μm away from the fibre membrane to avoid edge effects (see Fig. 1A) were used to measure the average fluorescence intensity per pixel (Fline) for each line. In order to correct for the apparent increase in fluorescence background in the fibre due to spherical aberration in our confocal system (see Sheppard & Török, 1997), we obtained a value for Fbackground by averaging the minimum fluorescence signal for the five lines, which were along the sarcomeres. These minimum fluorescence signals would correspond to pixels lying between the regularly spaced t-system elements of the fibre where no tubules should be present. The Fbackground was therefore subtracted from Fline to obtain ΔFline. The ΔFline of each of the five lines was then averaged to obtain ΔFfibre. At least 2500 pixels were averaged to obtain ΔFfibre. Fsolution was obtained by averaging at least 500 pixels in the dye solution away from the fibre surface and the Fbackground was subtracted from Fsolution to give ΔFsolution. It follows that t-sysVol could be calculated as:
| (1) |
A factor that could produce an overestimate of t-sysVol measurements is fluo-3 binding to membranes. There are several lines of evidence that suggest that this factor does not play a significant role in this study. If external membranes bound significant amounts of fluo-3 then one would expect to see an increase in fluorescence signal near the boundary of the fibre with the dye solution. To determine whether this was the case, the change in fluorescence intensity was measured in the direction perpendicular to the fibre axis by moving a line of 5 pixels pixel-by-pixel across the dye solution-membrane interface between the two lines indicated in Fig. 1D. The plot of fluorescence intensities measured is shown in Fig. 1E. As the line of 5 pixels was moved across the solution-membrane interface from position 1 to position 2, there was a monotonic decrease in fluorescence intensity, indicating that the dye was not concentrated at the membrane. If the dye were concentrated at the membrane, one would have expected that the fluorescence intensity would initially increase slightly before decreasing as we passed across the solution boundary interface. A similar fluorescence intensity profile was obtained when moving across the dye solution-membrane interface of large vacuoles that can be formed in fibres under certain conditions (Krolenko et al. 1995). In another experiment designed to increase the sensitivity of detecting dye binding to the external membrane surface, the surface membrane was rolled up under paraffin oil for several millimetres along a single toad fibre, i.e. the fibre was partially mechanically skinned (Launikonis & Stephenson, 1997). The peeled back surface membrane, looking like a ‘cuff’, defined the border between intact and skinned regions of the fibre. This preparation was washed of oil and then was immersed in Cafluo-3 solution and imaged on the confocal microscope (see above). The preparation entered into a state of rigor and it was expected that a significantly greater fluorescence signal was emitted from the ‘cuff’ region compared to the surrounding dye solution if any significant binding of fluo-3 to membrane occurred. However, if anything there was a weaker fluorescence intensity in the region of the cuff where several layers of membrane were present (data not shown). Therefore, from these observations, one can safely conclude that significant dye binding to membranes does not occur in muscle fibres.
Analysis of results
Unless otherwise stated in the text, the results are given as means ± s.e.m. and n is the number of fibres. Student's t test was used to determine statistical significance where appropriate. GraphPad software (Prism, San Diego, CA, USA) was used to fit data to various functions.
RESULTS
t-system volume in intact fibres
Figure 1 shows confocal images scanned in x-y mode of intact skeletal muscle fibres loaded extracellularly with fluo-3 dissolved in physiological solutions. In the middle of panel A is the image of a toad muscle fibre equilibrated in a toad physiological solution containing 1 mm fluo-3, which fluoresces intensely around the fibre. There is a much weaker fluorescence signal originating from the extracellular compartment (t-system) within the fibre. The presence of fluo-3 in the t-system is clearly shown in the inset of Fig. 1A, which displays the distinct banding pattern of the transverse tubular system (software enhanced). These fluorescence signals were used to calculate the volume of the t-system (t-sysVol, expressed as a fraction of total fibre volume; see eqn (1)). Figures 1B and C and 3A–C show optical sections with higher spatial resolution than in Fig. 1A, through intact rat EDL, rat soleus and toad iliofibularis muscle fibres equilibrated in physiological solutions with 1 mm fluo-3. The confocal images of the rat EDL and soleus tubular system (Fig. 1B and C, respectively) show double rows of tubules separated by the Z-line and a high number of longitudinal connections across this gap. In contrast, there are very few such connections between the two adjacent tubules across the gap in the middle of the sarcomere.
Figure 3. The effect of osmolality on the t-system.

Confocal images of toad fibres exposed to physiological solutions of different osmotic strength: 637.5 (A), 255 (B) and 127.5 mosmol kg−1 (C). Note the change in the optical appearance of the t-system in solutions of different osmotic strength. Scale bar: 5 μm. The fluorescence profile beside each lowercase letter is from the image with the corresponding uppercase letter along the line indicated by the arrow. Fluorescence profiles are in relative units.
The t-sysVol values calculated from eqn (1) (see Methods) for skeletal muscle fibres from rat and toad are shown in Table 1. The values of t-sysVol for amphibian fast-twitch and mammalian fast- and slow-twitch muscles determined from confocal imaging are generally greater than those previously estimated from EM studies (Peachey, 1965; Peachey & Schild, 1968; Luff & Atwood, 1971; Eisenberg et al. 1974; Cullen et al. 1984; Dulhunty, 1984). This issue is addressed in the Discussion.
Table 1.
The volume fraction of the t-system as determined with confocal imaging of intact rat and toad skeletal muscle fibres loaded with fluo-3
| Animal | Muscle | Fractional t-system volume (% fibre volume) | Sarcomere length (μm) |
|---|---|---|---|
| Rat | Soleus | 0.83 ± 0.07 (n = 12) | 2.15 ± 0.02 (n = 5) |
| Rat | EDL | 1.41 ± 0.09 (n = 12) | 2.08 ± 0.04 (n = 6) |
| Toad | Iliofibularis | 1.38 ± 0.09 (n = 17) | 1.93 ± 0.04 (n = 8) |
| Toad | Iliofibularis | 1.39 ± 0.07 (n = 10) | 3.30 ± 0.07 (n = 10) |
The smaller n for the sarcomere length measurements is because sarcomere length was only determined from images at the highest zoom factor, which was not recorded in all fibres.
Table 1 shows that the volumes occupied by the t-system in rat fast- and slow-twitch fibres (EDL and soleus, respectively) are significantly different (Student's t test, P < 0.001). However, the volumes occupied by the t-system in rat EDL and toad iliofibularis muscles are not significantly different (Student's t test, P > 0.5). This result is interesting because rat muscle contains two transverse tubules per sarcomere whereas toad muscle only contains one per sarcomere (Fig. 1 and Fig. 3). Also there was no difference in the toad t-sysVol when the sarcomere length was increased from about 1.9 to about 3.3 μm (Table 1; Student's t test, P > 0.5).
Membrane potential and t-system volume
To examine whether the membrane potential had an influence on t-sysVol, toad muscle was exposed to physiological solutions with [K+] of 0, 3.3, 20 and 115 mm and the membrane potential across the tubular system was estimated from the [K+] in solution (see Methods; Hodgkin & Horowicz, 1959). In all experiments, the composition of the dye solution administered to the isolated bundle of toad fibres matched that of the bathing physiological solution from which the bundle was removed. Physiological solutions with [K+] of 0, 20 and 115 mm resulted in t-sysVol of 1.36 ± 0.07 % (n = 14), 1.08 ± 0.04 % (n = 15) and 0.99 ± 0.03 % (n = 26), respectively. In Fig. 2, the t-sysVol data were plotted against the square of the predicted membrane potential (Hodgkin & Horowicz, 1959) to find out whether the observed changes could be explained by electric interactions at the level of the lipid bilayer (see Discussion). Note that the t-sysVol values determined at 0 and 3.3 mm K+ were not significantly different (Student's t test, P > 0.5) and therefore the relationship between t-sysVol and predicted (membrane potential)2 appeared to reach a plateau around 8000 mV2 (3.3 mm K+). It is also possible that the absolute value of the (membrane potential)2 in the 0 mm K+ solution was less than 10 000 mV2 because, obviously, the [K+][Cl−] product could not be maintained close to 400 mm2 in this solution. From Fig. 2, a minimum t-sysVol of 0.99 ± 0.03 (n = 26) was suggested in a fully depolarized (0 mV) toad muscle.
Figure 2. t-system volume of toad skeletal muscle fibres at different membrane potentials.

Membrane potential was changed by varying the [K+] of the extracellular solution while maintaining a constant [K+][Cl−] product (see Methods) and the membrane potential across the tubular system was estimated from the [K+] in solution and the results of Hodgkin & Horowicz (1959). The increase in t-sysVol with increased polarization of toad skeletal muscle fibres could be fitted by linear regression: y = 4.63 × 10⁻⁵x + 0.99; where x = (membrane potential)2 (mV2). Note that the total fibre volume did not change when preparations were depolarized.
Even though the [K+][Cl−] product was maintained close to 400 mm2 in the 3.3, 20 and 115 mm K+ solutions to prevent major ion and water fluxes across the membrane, it was also important to check that this was indeed the case. This was done by comparing the weight of the muscle bundle that had been soaked in standard toad physiological solution (3.3 mm K+) to that after being soaked in 115 mm K+ physiological solution ([K+][Cl−] constant). The preparation was well blotted on filter paper before it was weighed. No change in the muscle bundle was observed (< 0.5 % of total bundle weight), suggesting that the total fibre volume remained the same after depolarization. Because the [K+][Cl−] was kept constant we would fully expect that there would be no significant movement of water or ions across the t-system over the observation period.
Hypotonic and hypertonic solutions and t-system volume
Toad muscle fibre bundles were soaked for at least 1 h in solutions of various osmolalities prepared from physiological solutions by the addition of sucrose or by simple dilution (see Methods; Blinks, 1965). Figure 3 shows toad iliofibularis fibres that had been soaked in hypertonic, isotonic or hypotonic solutions (637.5, 255 and 127.5 mosmol kg −1, respectively). After isolation of a fibre bundle, each preparation was transferred to a glass coverslip and equilibrated in a solution containing 1 mm fluo-3 and having otherwise the same composition and osmotic strength as the original bathing medium. Preparations were imaged with a low zoom factor (× 40 objective) so that images appropriate for calculating t-sysVol were obtained (similar to Fig. 1A, pixel size 0.245 μm × 0.245 μm; data not shown) and with a high zoom factor so that individual transverse tubules could be imaged with higher spatial resolution (e.g. Fig. 3; pixel size 0.061 μm × 0.061 μm).
Fibres imaged with a higher zoom factor are shown in Fig. 3. Note that the t-system appears to become crenated (folded) after exposure to hypertonic solution (Fig. 3A) and ‘stretched’ when exposed to hypotonic solution (Fig. 3C) compared to that exposed to normal physiological (isotonic) solution (Fig. 3B). This behaviour is probably influenced by fibre volume changes in response to osmotic stress (Blinks, 1965).
Fluorescence profiles along a line perpendicular to the direction of the transverse tubules in Fig. 3A-C are shown in the lower right panel in Fig. 3 by the corresponding lower case letter. Peaks and troughs in the fluorescence profiles are clearly evident in the fibres soaked in hypertonic (Fig. 3A) and isotonic (Fig. 3B) solution, but less differentiation is shown in the fluorescence profile from the fibre exposed to hypotonic solution (Fig. 3C), indicating less dye per pixel in the transverse tubules than in the former two cases.
The width at half-maximum of the fluorescence signal indicating the transverse tubules in isotonic (0.36 ± 0.06 μm, n = 8) and hypotonic (0.30 ± 0.03 μm, n = 8) solution were not significantly different (Student's one-sampled t test, P > 0.2 in both cases) from the resolution of the microscope (estimated at about 0.3 μm) and therefore the diameter of the transverse tubules in these cases is assumed to be much smaller than 0.3 μm. However, the average width at half-maximum of the fluorescence peaks in fibres in hypertonic solution (e.g. Fig. 3A) indicate that the transverse tubules were significantly wider (0.76 ± 0.08 μm, n = 7) than the resolution of the microscope (Student's one sampled t test, P = 0.001). This suggests an apparent tubule diameter of about 0.46 μm, which is likely to be due to crenation, rather than to expansion of the tubule diameter.
The t-sysVol of toad fibres exposed to solutions of different osmotic strengths increased with the osmolality of the fibre environment (Fig. 4A), varying from 1.15 ± 0.05 % (n = 10) to 1.87 ± 0.12 % (n = 12) over the range of osmolalities from 127.5 to 637.5 mosmol kg −1. The increase in t-sysVol with osmolality could be fitted well by linear regression (Fig. 4A) with a slope significantly different from 0 (P < 0.0001). Note that our method of changing solution osmolality by the addition of sucrose or by simple dilution (see Methods; Blinks, 1965) should have produced a slight hyperpolarization of the t-system compared with the isosmotic condition. The slight t-system hyperpolarization should not have changed the t-sysVol, as shown in Fig. 2.
Figure 4. t-system volume of toad skeletal muscle fibres at different osmolalities.
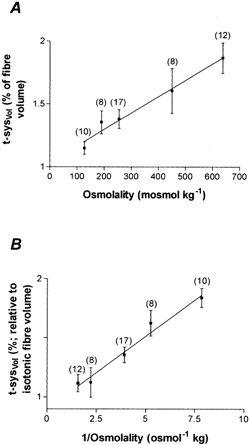
A, fractional t-system volume at different osmotic strengths. B, t-system volume expressed as a percentage of isotonic fibre volume as a function of the reciprocal osmolality after correction based on the results of Blinks (1965) for changes in fibre volume in solutions of different osmotic strengths. The number in parentheses indicates the number of fibres from which measurements were made. The function in A could be fitted by linear regression: y = 0.0013x + 1.04, where x = osmolality and is expressed as mosmol kg−1. The function in B could also be fitted by linear regression: y = 0.123x + 0.9, where x = 1/osmolality and is expressed as osmol−1 kg. Note that the origin of the y-axis is not shown on either graph.
Because the total fibre volume changes with the osmotic strength of the bathing medium (Blinks, 1965), the t-sysVol in bathing solutions of different osmolalities (expressed as the inverse of osmolality; Blinks, 1965) was calculated relative to the fibre volume in isotonic solution (Fig. 4B) so that analysis of relative changes in the t-sysVol across different osmotic concentrations could be made. The resulting data could be fitted by linear regression. This relationship revealed a minimum t-sysVol of 0.90 ± 0.08 % relative to the fibre volume in isotonic medium when the osmolality was increased indefinitely.
Membrane cholesterol depletion and t-system volume
We have previously presented confocal images of toad fibres showing that membrane cholesterol depletion with MβCD (Bender & Komiyama, 1978; Szejtli, 1982; Gimpl et al. 1997) does not disrupt the integrity of the t-system membrane (Launikonis & Stephenson, 2001). Furthermore, we showed that the ability of intact fibre bundles to respond to electrical stimulation was significantly impaired after 4 h treatment with 10 mm MβCD due to depolarization of the t-system (Launikonis & Stephenson, 2001). Since depolarization by cholesterol depletion was expected to lead to a reduction in t-sysVol, it was of interest to determine whether this was the case.
It was found that bundles of toad fibres exposed to 10 mm MβCD for 4 h in physiological solution had their t-sysVol reduced to 1.19 ± 0.05 % (n = 9), which is significantly different from the control (Student's one-tailed t test, P = 0.045; Table 1). From Fig. 2 it can be estimated that the depolarization of the t-system membrane induced by the depletion of membrane cholesterol by the protocol described above would correspond to a membrane potential of about −65 mV (see Discussion).
DISCUSSION
Tubular system volume in toad and rat muscle fibres
This study has shown that the t-system is a dynamic structure, capable of changes in volume in response to changes in membrane potential, osmotic pressure and possibly lipid composition. The fractional volume of the t-system in intact muscle fibres at rest determined by confocal microscopy in this study is much larger than earlier estimates by EM techniques (e.g. Peachey, 1965; Peachey & Schild, 1968; Luff & Atwood, 1971; Eisenberg et al. 1974), probably because of errors introduced by volume changes during fixation, dehydration and embedding of the muscle preparations (Mobley & Eisenberg, 1975; Davey & O'Brien, 1978; Dulhunty, 1984). This is further supported by similar observations made on rat cardiac muscle by Soeller & Cannell (1999), who used a confocal method to measure the fractional volume of the transverse tubular system in isolated myocytes, obtaining results that were severalfold greater than those obtained from earlier EM studies (Page, 1971; Stewart & Page, 1978). When precautions were taken to minimise errors arising from uncertainties in the effect of fixation on the geometry of the transverse tubular system (Davey & O'Brien, 1978; Dulhunty, 1984; Dulhunty et al. 1984), the fractional volume of the t-system obtained by EM techniques approached the values obtained in this study, considering that the t-system would be expected to be depolarized during fixing in EM experiments. Thus, from the data provided by Dulhunty (1984, Tables 2, 3 and 5–7) it can be estimated that the fractional volume of the t-system in toad sartorius and rat EDL and soleus muscle fibres was greater by about 30–50 % than that in sternomastoid muscle fibres, which was estimated at 0.62–0.69 % of the total fibre volume (Dulhunty et al. 1984).
The observations made on frog muscle fibres by Endo (1966) using membrane-impermeant fluorescent dyes and conventional fluorescence microscopy yielded a value of 1.28 ± 0.13 % for the ‘dye space’, which represents the fractional volume of the entire extracellular compartment within the fibre. This value is not significantly different from our value obtained on cane toad muscle using confocal microscopy (1.38 ± 0.09 %). It is ironic that until now less credence was given to the values reported by Endo (1966) for the fractional volume of the transverse tubular system in intact skeletal muscle fibres of the frog than to those obtained by EM or other techniques (e.g Hill, 1964) on fixed preparations.
As briefly mentioned in the Methods section, there are several lines of evidence suggesting that Cafluo-3 does not bind in significant quantities to the extracellular membranes. In this context it is relevant to point out that the negative charge carried by the Cafluo-3 complex would actually prevent it from accumulating in the vicinity of the negatively charged basal membrane. This would lead to a small underestimation of t-sysVol. It is noteworthy that despite the use of different molecular species of fluorescent dyes in this study and in the study of Endo (1966), essentially the same value was obtained for t-sysVol in intact amphibian fibres.
Based on the results of our study, it appears that the volume fraction of the extracellular compartment within the intact muscle fibre of the twitch portion of the cane toad iliofibularis muscle is similar to that of the predominantly fast-twitch fibres from the rat EDL muscle. Despite the fact that the geometry of the t-system in rat muscle is different from that in toad muscle, with two tubules per sarcomere vs. one, respectively, the overall volume fraction of the extracellular compartment in the iliofibularis fibres of the toad was very similar to that in rat EDL muscle. This is because the average cross-sectional area of the t-tubules in the toad fibres is markedly greater than that in EDL muscle (Dulhunty, 1984). Interestingly, from Fig. 1B it is also apparent that the t-tubules bordering the Z-line in rat fibres are more intimately associated by apparent interconnections than the t-tubules bordering opposite Z-lines in the same sarcomere (see Fig. 1).
The fact that the estimated t-sysVol in toad and rat EDL muscle fibres was the same despite their different geometry implies that the surface area of the t-system is considerably greater in rat than in toad fibres. Since the velocity of propagation of action potentials through the t-system depends directly on the length constant, which in turn is proportional to the volume-to-surface ratio of the t-system, it follows that the action potentials would be expected to propagate faster in the t-system of toad than rat fibres, assuming the properties of the t-system membrane were otherwise the same. The potentially higher velocity of propagation of action potentials in toad may explain why the amphibian fibres can grow significantly wider than mammalian fibres without loss of function.
A quantitative estimate for the volume-to-surface ratio can be made from data in Table 1 and using fibre capacity values per cm2 fibre area (Cf) from electrophysiological experiments. Thus, the area of the t-system per unit fibre volume, At, can be calculated from the following equation, assuming a membrane capacity per unit area of 1 μF cm−2 (Hodgkin & Nakajima, 1972) for the surface and the tubular membranes in both toad and rat muscle fibres:
| (2) |
where r is the fibre radius. Using the volume fraction values for the tubular system from Table 1 and Cf values from electrophysiological measurements (Dulhunty et al. 1984, Table 7, for EDL fibres; Hodgkin & Nakajima, 1972; Adrian & Peres, 1979, for amphibian fibres), the volume-to-surface ratios for the tubular system in the rat EDL and toad fibres are 32 and between 53 and 44 nm, respectively.
With respect to the t-sysVol in slow-twitch fibres, there is a significantly smaller value than in fast-twitch fibres (0.83 vs. 1.41 %; Table 1). This difference is possibly due to a longer non-junctional tubular system in slow-twitch fibres than in fast-twitch fibres (Dulhunty, 1984) considering that the cross-sectional area of the non-junctional tubules is much smaller than that of junctional tubules due to a considerably greater short axis of the junctional t-tubules. The estimated value for the volume-to-surface ratio for the soleus fibres based on the data in Table 1 and on the electrophysiological measurements of Dulhunty et al. (1984) is 22 nm, which is about 30 % smaller than in rat EDL fibres (see above). Note, however, that Cullen et al. (1984) reported a similar value for the volume-to-surface ratio in the rat EDL and soleus fibres of the rat. Therefore it is difficult to predict whether the velocity of action potential propagation in the t-tubule is faster in EDL than in soleus fibres.
Depolarization effects
A rather interesting result from this study was the linear dependence of the fractional volume of the tubular system on the square of the estimated membrane potential across the tubule membrane (Fig. 2). This result can be simply explained by the decrease of the overall tension in the tubular wall when an electrical potential difference is applied across the membrane. The electrical potential difference across the membrane is associated with the accumulation of electrical charges of opposite sign on the two sides of the membrane, generating a mechanical pressure across the membrane that is rather small to significantly compress the lipid bilayer (Benz & Janko, 1976). Moreover, the repulsive forces between the electrical charges of the same sign along both surfaces of the membrane produce a decrease in the tension in the membrane that is proportional to the square of the membrane potential and the specific electrical capacity of the membrane, Cs (Requena et al. 1975). The repulsive electrical forces will also tend to reduce the curvature of the membrane because they will be greater on the concave side of the membrane, where the density of the charges is slightly greater, than on the convex part of the membrane, where the density of the charges is slightly lower. Thus, the presence of a membrane potential across the tubular wall will result in a decrease in tubular wall tension that is proportional to the square of the membrane potential, which in turn will generate a small negative pressure in the tubular system. Since the tubular system is open to the outside, this small negative pressure will be sufficient to cause more extracellular fluid to enter the tubular system, which increases in volume until a new equilibrium is reached. Therefore, it makes sense that the experimentally measured increase in the volume of the tubular system was linearly dependent on the square of the membrane potential up to a certain point. Of course, because of various physical constraints in the tubular wall, the volume of the tubular system cannot increase indefinitely as the membrane potential increases. Therefore hyperpolarization of the tubules beyond a certain level may not produce any further increase in the tubular volume (Fig. 2).
It is also relevant to point out here that the electrostatic pressure exerted on membranes when applying a potential difference across them of the order of 100 mV is capable of significantly increasing the membrane capacitance of artificial bilayers containing various amounts of solvents. This increase in capacitance, which is linearly dependent on the square of the membrane potential, is not due to compression of the lipids in the bilayer and the ensuing increase in the surface area, but is caused by pushing excess solvent laterally from thinner areas of the membrane to thicker areas of the membrane as a result of the larger pressure created by the electric field in thinner areas than in thicker areas of the membrane (Benz & Janko, 1976). This causes an effective thinning of relatively large areas of the membrane that is responsible for the increase in capacitance. This phenomenon may also occur in biological membranes which are not entirely homogeneous, but to a much smaller extent because there is not much ‘solvent’ present in biological membranes.
In conclusion, the volume of the tubular system in muscle fibres from the cane toad is about 40 % greater when the membrane is polarized to physiological levels than when the membrane is fully depolarized. This ensures a markedly larger volume-to-surface ratio when the membrane is polarized than when the membrane is fully depolarized and, in turn, this facilitates the faster propagation of an action potential along the tubular network. Furthermore, the fact that the volume of the tubular system is dependent on the membrane potential may facilitate the exchange of substances between the lumen of the tubular system and the solution surrounding the muscle fibre during repeated depolarization- repolarization cycles. Finally, the volume of the tubular system in fixed preparations will always be significantly smaller than that in fully polarized fibres.
Osmotic pressure effects
There was a positive correlation between the t-sysVol of toad skeletal muscle fibres and the osmolality of the bathing medium (Fig. 4A). Thus, t-sysVol increased linearly by a factor of 1.6 when the osmolality of the environment changed from 127.5 to 637.5 mosmol kg−1. Previous studies have also shown an increase in the fractional volume of the transverse tubular system when the muscle fibres were placed in hypertonic solutions (Davey & O'Brien, 1978; Franzini-Armstrong et al. 1978). However, if one takes into consideration the change in the total fibre volume when the osmolality of the solution increased (Blinks, 1965), then there was a net decrease in the tubular system volume expressed relative to the fibre volume in isosmotic medium as the osmolality of the bathing solution increased (Fig. 4B). This makes sense, since a decrease in fibre volume effectively creates an increase in the tension of the tubular wall by removing a positive tension component associated with a higher fibre volume. This, in turn, increases the hydrostatic pressure in the tubular system and consequently decreases its volume, as the t-system is open to the outside. Of course, below a certain fibre volume there is no positive tension component in the tubular wall that can be further decreased. Therefore, one would expect that the volume of the tubular system could not be decreased below a certain level by further increasing the osmolality of the solution. Indeed, from Fig. 4B it is apparent that the volume of the tubular system cannot decrease below about 0.9 % of the fibre volume in isotonic solution as the osmolality is increased indefinitely. This result indicates that the tubular system cannot be compressed below about 0.9 % when the net tension in the tubular wall is reduced to zero by reducing either the fibre volume or the membrane potential across the tubular membrane.
Evidence that the t-system is more restricted in its changes in diameter and volume than the fibre as a whole is also apparent from gross t-system morphology in solutions of different osmolality (Fig. 3). The transverse tubule diameters of fibres in hypotonic solution appear ‘thin’ as if they have been stretched (Fig. 3C) and the spacing between tubules appears to have increased compared with the situation in isotonic medium (Fig. 3B). In contrast to this behaviour in hypotonic solution, there is an apparent increase in the tubular diameter of fibres in hypertonic solution (Fig. 3), where the fibre volume and diameter are reduced (Blinks, 1965). The inability of the t-system to reduce its volume to the same degree as the rest of the fibre (see Results and Fig. 4) causes it to ‘buckle’ and produce the crenated look shown in Fig. 3A and, in the converse situation, the t-system becomes stretched when the fibre significantly increases its volume in hypotonic solutions (Fig. 3C).
The increase of 33 % in t-system volume compared with that in the isotonic solution when the osmotic strength was reduced by half implies that the ratio between t-system volume and t-system area may increase by a similar factor if one assumes that the area of the t-system remains constant. This increase is likely to be due to a slight expansion of the t-system lumen as a result of the increase in fibre volume. As mentioned above, an increase in fibre volume beyond a certain point will be associated with a stretch of the tubular wall, which, in turn, creates a negative hydrostatic pressure in the tubular lumen, causing it to fill more with solution from the external environment and thus increase in volume. Hence, it is likely that under hyposmotic conditions, the t-system is both stretched (straightened) and slightly expanded as a result of forces associated with the increase in fibre volume. There was no change in the t-system volume when the cross-sectional area was reduced without changes in the total volume of the fibre when the sarcomere length of the fibre was increased (see below). This further supports the suggestion that the osmotically induced changes measured here in the volume of the tubular system are more likely to be associated with changes in the overall volume of the muscle fibre than with simple changes in the fibre cross-sectional area.
Sarcomere length effects
The observation that the change in sarcomere length from 1.93 to 3.30 μm did not affect the steady-state fractional volume of the tubular system in toad muscle fibres is important in several ways. First, this result implies that the volume of the tubular system in a muscle fibre does not change when the cross-sectional area of the fibre is reduced by a factor of 1.7 (considering that the fibre volume remains constant). Such a reduction in cross-sectional area would be expected to occur when muscle fibres are exposed at constant sarcomere length to 2.5-fold hypertonic solutions (Blinks, 1965). Interestingly, when the osmotic strength was increased by a similar factor, there was actually a decrease in the volume of the tubular system compared with that under isotonic conditions (Fig. 4B). This shows that the forces acting on the tubular system do not solely depend on the cross-sectional area of the preparation. Second, since the volume of the tubules does not change and since the surface area of the tubules is unlikely to change when the sarcomere length changes, it follows that the volume-to-surface ratio and therefore the length constant is not likely to change when the sarcomere length changes between 1.93 and 3.30 μm. Third, this result implies that the spread of the action potential within the fibre is not different when the cross-sectional area is reduced by a factor of 1.7. The conclusion that the volume of the tubules does not change with a change in sarcomere length is further supported by observations that show that the cross-sectional area of the tubules in the junctional region is not affected by changes in sarcomere length (Takekura et al. 1996).
Effects of cholesterol removal
It was shown in this study that a depletion of t-system cholesterol results in a reduction of t-sysVol. The reduction of t-sysVol upon cholesterol depletion may be caused by the decrease in resting membrane potential induced by cholesterol depletion (Launikonis & Stephenson, 2001). If it is assumed that the decrease in t-sysVol upon depletion of membrane cholesterol is due to the subsequent decrease in resting membrane potential (Launikonis & Stephenson, 2001), then the decrease in resting membrane potential can be calculated from the equation generated in Fig. 2. The t-sysVol decrease to 1.19 ± 0.05 % after 4 h treatment with 10 mm MβCD equates to a reduction in resting membrane potential to approximately −65 mV, which is close to threshold for force development (Nagai et al. 1979). This drop in membrane potential fits with the drop in tetanic force responses induced by this MβCD treatment (3.1 ± 3.1 % of initial tetanus, n = 3; Launikonis & Stephenson, 2001). However, we cannot be certain that the depletion of the t-system cholesterol itself does not have a specific effect on t-sysVol or that the relationship between t-sysVol and membrane potential is different in membranes of altered lipid composition, as has been suggested from artificial bilayer experiments (Benz & Janko, 1976).
Concluding remarks
This study has reassessed the fractional volume of the tubular system in intact toad and rat skeletal muscle fibres and shown that the t-system is a dynamic membrane structure capable of changing its volume in response to membrane potential, cholesterol depletion and osmotic stress but not when the sarcomere length is changed in muscle fibres at rest. The results have some interesting implications for muscle physiology in particular, and cell biology in general, because they show that changes in membrane potential and/or changes in the cholesterol content of microdomains that have high cholesterol contents, such as caveolae and lipid rafts (Anderson, 1998), can cause local alterations in the membrane geometry that may be associated with membrane trafficking and signal transduction in cells.
Acknowledgments
This work was supported by the Australian Research Council and The National Health and Medical Research Council of Australia.
REFERENCES
- Adrian RH, Peres A. Charge movement and membrane capacity in frog muscle. Journal of Physiology. 1979;289:83–97. doi: 10.1113/jphysiol.1979.sp012726. [DOI] [PMC free article] [PubMed] [Google Scholar]
- Anderson RGW. The caveolae membrane system. Annual Review of Biochemistry. 1998;67:199–225. doi: 10.1146/annurev.biochem.67.1.199. [DOI] [PubMed] [Google Scholar]
- Bender ML, Komiyama M. Cyclodextrin Chemistry. Berlin: Springer-Verlag; 1978. [Google Scholar]
- Benz R, Janko K. Voltage-induced capacitance relaxation of lipid bilayer membranes. Effects of membrane composition. Biochimica et Biophysica Acta. 1976;455:721–738. doi: 10.1016/0005-2736(76)90043-2. [DOI] [PubMed] [Google Scholar]
- Blinks JR. Influence of osmotic strength on cross-section and volume of isolated single muscle fibres. Journal of Physiology. 1965;177:42–57. doi: 10.1113/jphysiol.1965.sp007574. [DOI] [PMC free article] [PubMed] [Google Scholar]
- Cullen MJ, Hollingworth S, Marshall MW. A comparative study of the transverse tubular system of the rat extensor digitorum longus and soleus muscles. Journal of Anatomy. 1984;138:297–308. [PMC free article] [PubMed] [Google Scholar]
- Davey DF, O'Brien JM. The sarcoplasmic reticulum and T-system of rat extensor digitorum longus muscles exposed to hypertonic solutions. Australian Journal of Experimental Biology and Medical Sciences. 1978;56:409–419. doi: 10.1038/icb.1978.46. [DOI] [PubMed] [Google Scholar]
- Dulhunty AF. Heterogeneity of t-tubule geometry in vertebrate skeletal muscle fibres. Journal of Muscle Research and Cell Motility. 1984;5:333–347. doi: 10.1007/BF00713111. [DOI] [PubMed] [Google Scholar]
- Dulhunty AF, Carter G, Hinrichsen C. The membrane capacity of mammalian skeletal muscle fibres. Journal of Muscle Research and Cell Motility. 1984;5:315–332. doi: 10.1007/BF00713110. [DOI] [PubMed] [Google Scholar]
- Eisenberg BR. Quantitative ultrastructure of mammalian skeletal muscle. In: Peachey LD, editor. Handbook of Physiology, section 10, Skeletal Muscle. Bethesda, MD, USA: American Physiological Society; 1983. pp. 73–112. [Google Scholar]
- Eisenberg BR, Kuda AM, Peter JB. Stereological analysis of mammalian skeletal muscle. I. Soleus muscle of the adult guinea pig. Journal of Cell Biology. 1974;60:732–754. doi: 10.1083/jcb.60.3.732. [DOI] [PMC free article] [PubMed] [Google Scholar]
- Endo M. Entry of fluorescent dyes into the sarcotubular system of the frog muscle. Journal of Physiology. 1966;185:224–238. doi: 10.1113/jphysiol.1966.sp007983. [DOI] [PMC free article] [PubMed] [Google Scholar]
- Franzini-Armstrong C, Heuser JE, Reese TS, Somlyo AP, Somlyo AV. T-tubule swelling in hypertonic solutions: a freeze substitution study. Journal of Physiology. 1978;283:133–140. doi: 10.1113/jphysiol.1978.sp012492. [DOI] [PMC free article] [PubMed] [Google Scholar]
- Gimpl G, Burger K, Fahrenholz F. Cholesterol as modulator of receptor function. Biochemistry. 1997;36:10959–10974. doi: 10.1021/bi963138w. [DOI] [PubMed] [Google Scholar]
- Hill DK. The space accessible to albumin within the striated muscle fibre of the toad. Journal of Physiology. 1964;175:275–294. doi: 10.1113/jphysiol.1964.sp007517. [DOI] [PMC free article] [PubMed] [Google Scholar]
- Hodgkin AL, Horowicz P. The influence of potassium and chloride ions on the membrane potential of single muscle fibres. Journal of Physiology. 1959;148:127–160. doi: 10.1113/jphysiol.1959.sp006278. [DOI] [PMC free article] [PubMed] [Google Scholar]
- Hodgkin AL, Nakajima S. Analysis of the membrane capacity in frog muscle. Journal of Physiology. 1972;221:121–136. doi: 10.1113/jphysiol.1972.sp009743. [DOI] [PMC free article] [PubMed] [Google Scholar]
- Krolenko SA, Amos WB, Lucy JA. Reversible vacuolation of the transverse tubules of frog skeletal muscle: a confocal fluorescence microscopy study. Journal of Muscle Research and Cell Motility. 1995;16:401–411. doi: 10.1007/BF00114505. [DOI] [PubMed] [Google Scholar]
- Krolenko SA, Lucy JA. Reversible vacuolation of T-tubules in skeletal muscle: mechanisms and implications for cell biology. International Review of Cytology. 2001;202:243–298. doi: 10.1016/s0074-7696(01)02006-x. [DOI] [PubMed] [Google Scholar]
- Launikonis BS, Stephenson DG. Effect of saponin treatment on the sarcoplasmic reticulum of rat, cane toad and crustacean (yabby) skeletal muscle. Journal of Physiology. 1997;504:425–437. doi: 10.1111/j.1469-7793.1997.425be.x. [DOI] [PMC free article] [PubMed] [Google Scholar]
- Launikonis BS, Stephenson DG. Effects of membrane cholesterol manipulation on excitation-contraction coupling in skeletal muscle of the toad. Journal of Physiology. 2001;534:71–85. doi: 10.1111/j.1469-7793.2001.00071.x. [DOI] [PMC free article] [PubMed] [Google Scholar]
- Luff AT, Atwood HL. Changes in the sarcoplasmic reticulum and transverse tubular system of fast and slow skeletal muscles of the mouse during postnatal development. Journal of Cell Biology. 1971;51:369–383. doi: 10.1083/jcb.51.2.369. [DOI] [PMC free article] [PubMed] [Google Scholar]
- Melzer W, Herrmann-Frank A, Lüttgau H Ch. The role of Ca2+ ions in excitation-contraction coupling of skeletal muscle fibres. Biochimica et Biophysica Acta. 1995;1241:59–116. doi: 10.1016/0304-4157(94)00014-5. [DOI] [PubMed] [Google Scholar]
- Mobley B, Eisenberg B. Sizes of components in frog skeletal muscle measured by methods of stereology. Journal of General Physiology. 1975;66:31–45. doi: 10.1085/jgp.66.1.31. [DOI] [PMC free article] [PubMed] [Google Scholar]
- Nagai T, Takauji M, Kosaka I, Tsutsu-Ura M. Biphasic time course of inactivation of potassium contractures in single twitch muscle fibres of the frog. Japanese Journal of Physiology. 1979;29:539–549. doi: 10.2170/jjphysiol.29.539. [DOI] [PubMed] [Google Scholar]
- Page E. Stereological measurements of cardiac ultrastructures implicated in excitation-contraction coupling. Proceedings of the National Academy of Sciences of the USA. 1971;68:1465–1466. doi: 10.1073/pnas.68.7.1465. [DOI] [PMC free article] [PubMed] [Google Scholar]
- Peachey LD. The sarcoplasmic reticulum and transverse tubules of the frog's sartorius. Journal of Cell Biology. 1965;25:209–231. doi: 10.1083/jcb.25.3.209. [DOI] [PubMed] [Google Scholar]
- Peachey LD, Eisenberg BR. Helicoids in the T system and striations of frog skeletal muscle fibres seen by high voltage electron microscopy. Biophysical Journal. 1978;22:145–154. doi: 10.1016/S0006-3495(78)85480-0. [DOI] [PMC free article] [PubMed] [Google Scholar]
- Peachey LD, Schild RF. The distribution of the t-system along the sarcomeres of frog and toad sartorius muscles. Journal of Physiology. 1968;194:249–258. doi: 10.1113/jphysiol.1968.sp008405. [DOI] [PMC free article] [PubMed] [Google Scholar]
- Posterino GS, Lamb GD, Stephenson DG. Twitch and tetanic force responses and longitudinal propagation of action potentials in skinned skeletal muscle fibres of the rat. Journal of Physiology. 2000;527:131–137. doi: 10.1111/j.1469-7793.2000.t01-2-00131.x. [DOI] [PMC free article] [PubMed] [Google Scholar]
- Requena J, Haydon DA, Hladky SB. Lenses and the compression of black lipid membranes by an electric field. Biophysical Journal. 1975;15:77–81. doi: 10.1016/S0006-3495(75)85793-6. [DOI] [PMC free article] [PubMed] [Google Scholar]
- Sheppard CJR, Török P. Effects of specimen refractive index on confocal imaging. Journal of Microscopy. 1997;185:366–374. [Google Scholar]
- Soeller C, Cannell MB. Examination of the transverse tubular system in living cardiac rat myocytes by 2-photon microscopy and digital image-processing techniques. Circulation Research. 1999;84:266–275. doi: 10.1161/01.res.84.3.266. [DOI] [PubMed] [Google Scholar]
- Stephenson DG, Launikonis BS. Cholesterol depletion causes depolarisation of the transverse tubular (t-) system in skeletal muscle fibres from cane toads. Journal of Physiology. 2001;533P:127P. [Google Scholar]
- Stewart JM, Page E. Improved stereological techniques for studying myocardial cell growth: application to external sarcolemma, t system, and intercalated disks of rabbit and rat hearts. Journal of Ultrastructure Research. 1978;65:119–134. doi: 10.1016/s0022-5320(78)90050-3. [DOI] [PubMed] [Google Scholar]
- Szejtli J. Cyclodextrins and their Inclusion Complexes. Budapest: Akadémiai Kiadó; 1982. [Google Scholar]
- Takekura H, Kasuga N, Yoshioka T. Influences of sarcomere length and selective elimination of myosin filaments on the localization and orientation of triads in rat muscle fibres. Journal of Muscle Research and Cell Motility. 1996;17:235–242. doi: 10.1007/BF00124245. [DOI] [PubMed] [Google Scholar]