Abstract
GABAergic interneurones are diverse in their morphological and functional properties. Perisomatic inhibitory cells show fast spiking during sustained current injection, whereas dendritic inhibitory cells fire action potentials with lower frequency. We examined functional and molecular properties of K+ channels in interneurones with horizontal dendrites in stratum oriens-alveus (OA) of the hippocampal CA1 region, which mainly comprise somatostatin-positive dendritic inhibitory cells. Voltage-gated K+ currents in nucleated patches isolated from OA interneurones consisted of three major components: a fast delayed rectifier K+ current component that was highly sensitive to external 4-aminopyridine (4-AP) and tetraethylammonium (TEA) (half-maximal inhibitory concentrations < 0.1 mm for both blockers), a slow delayed rectifier K+ current component that was sensitive to high concentrations of TEA, but insensitive to 4-AP, and a rapidly inactivating A-type K+ current component that was blocked by high concentrations of 4-AP, but resistant to TEA. The relative contributions of these components to the macroscopic K+ current were estimated as 57 ± 5, 25 ± 6, and 19 ± 2 %, respectively. Dendrotoxin, a selective blocker of Kv1 channels had only minimal effects on K+ currents in nucleated patches. Coapplication of the membrane-permeant cAMP analogue 8-(4-chlorophenylthio)-adenosine 3′:5′-cyclic monophosphate (cpt-cAMP) and the phosphodiesterase blocker isobutyl-methylxanthine (IBMX) resulted in a selective inhibition of the fast delayed rectifier K+ current component. This inhibition was absent in the presence of the protein kinase A (PKA) inhibitor H-89, implying the involvement of PKA-mediated phosphorylation. Single-cell reverse transcription-polymerase chain reaction (RT-PCR) analysis revealed a high abundance of Kv3.2 mRNA in OA interneurones, whereas the expression level of Kv3.1 mRNA was markedly lower. Similarly, RT-PCR analysis showed a high abundance of Kv4.3 mRNA, whereas Kv4.2 mRNA was undetectable. This suggests that the fast delayed rectifier K+ current and the A-type K+ current component are mediated predominantly by homomeric Kv3.2 and Kv4.3 channels. Selective modulation of Kv3.2 channels in OA interneurones by cAMP is likely to be an important factor regulating the activity of dendritic inhibitory cells in principal neurone-interneurone microcircuits.
GABAergic interneurones play a key role in the control of electrical activity in neuronal networks (reviewed by Freund & Buzsáki, 1996; McBain & Fisahn, 2001). Interneurones forming inhibitory synapses on the somata or the axon initial segments of their postsynaptic target cells are thought to set the threshold of action potential initiation (Cobb et al. 1995; Miles et al. 1996; Kraushaar & Jonas, 2000). In contrast, interneurones establishing inhibitory synapses mainly on dendrites could suppress dendritic Na+ or Ca2+ spikes (Miles et al. 1996), and thus regulate plasticity at glutamatergic synapses in the cortex (Freund & Buzsáki, 1996; Katona et al. 1999; McBain & Fisahn, 2001).
Interneurones, especially those targeting somatic regions, differ from pyramidal neurones in their ability to generate high-frequency trains of action potentials during sustained current injection in vitro (Connors & Gutnick, 1990; Han et al. 1993; Martina et al. 1998). Previous studies suggested that differential expression of voltage-gated channels shapes this characteristic difference in the action potential pattern (Storm, 1990; Martina et al. 1998). Voltage-gated K+ channels are assembled from subunits of four major subfamilies, designated as Kv1, Kv2, Kv3, and Kv4 (reviewed by Coetzee et al. 1999). Perisomatic inhibitory interneurones, often parvalbumin-immunopositive, express Kv3 subunits (Kv3.1 and Kv3.2) at substantially higher levels than pyramidal neurones (Weiser et al. 1995; Du et al. 1996; Martina et al. 1998; Chow et al. 1999). In contrast, the expression of Kv4 subunits is much lower in perisomatic inhibitory interneurones than in pyramidal neurones (Martina et al. 1998). This is consistent with the view that delayed rectifier K+ channels assembled from Kv3 subunits facilitate fast spiking (Wang et al. 1998; Erisir et al. 1999; reviewed by Rudy & McBain, 2001), whereas inactivating A-type K+ channels assembled from Kv4 subunits help a cell to fire repetitively at low frequencies (Connor & Stevens, 1971; Hille, 1992). A critical role of Kv3 channels in fast spiking of interneurones is further suggested by the observation that both pharmacological block of Kv3 channels by 4-AP and TEA (Martina et al. 1998; Erisir et al. 1999) and targeted disruption of the Kv3.2 gene (Lau et al. 2000) impair fast spiking in cortical interneurones.
Unlike the firing pattern of perisomatic inhibitory cells, that of dendritic inhibitory cells is more heterogeneous, and the molecular determinants are less clear. In the neocortex, somatostatin-positive dendritic inhibitory cells are not fast spiking (Kawaguchi & Kubota, 1997), but apparently do express Kv3.2 subunits (Chow et al. 1999). This led to the suggestion that Kv3 subunits could have functions other than supporting high-frequency action potential generation (Chow et al. 1999). In the hippocampus, interneurones with horizontal dendrites in the stratum oriens-alveus of the CA1 region (presumably mainly dendritic inhibitory interneurones; Sik et al. 1995; Maccaferri & McBain, 1996a; Martina et al. 2000; Maccaferri et al. 2000) have been classified as fast-spiking (Zhang & McBain, 1995a, b). However, immunocytochemical analysis suggests that OA interneurones do not express Kv3.1b subunits (Du et al. 1996), and Kv3.2 subunits are found only in approximately 30 % of somatostatin-positive cells in the hippocampal formation (Atzori et al. 2000). Furthermore, OA interneurones express a high level of Kv4.3 subunits (Serôdio & Rudy, 1998), which may prevent the generation of high-frequency activity. Thus the relation between action potential pattern and K+ channel subunit expression in dendritic inhibitory interneurones remains unclear.
The goal of the present study was to examine voltage-gated K+ channels in interneurones of stratum oriens-alveus in the hippocampal CA1 region, a major class of somatostatin-positive dendritic inhibitory interneurones (Martina et al. 2000). We characterized the functional properties of K+ channels in these neurones using the nucleated patch technique, and examined whether the interneurone K+ channels were affected by neuromodulators. Finally, we determined the putative subunit composition of the native channels by single-cell RT-PCR. Part of this work has been published in abstract form (Lien et al. 2001).
METHODS
Cell identification and nucleated patch recording
Transverse hippocampal slices of 300 μm thickness were cut from the brains of 13- to 22-day-old Wistar rats using a vibratome (Campden, Loughborough, UK or Dosaka, Kyoto, Japan). Animals were killed by rapid decapitation without anaesthesia, in accordance with national and institutional guidelines. Experiments were approved by the Animal Care Committee Freiburg according to #15 of the Tierschutzgesetz (Az 644Z/142). Interneurones in stratum oriens-alveus in the hippocampal CA1 subfield were examined using infrared differential interference contrast (IR-DIC) videomicroscopy (Stuart et al. 1993). Cells were selected on the basis of the following criteria: (1) location of the soma at the oriens-alveus border, (2) horizontal orientation of their dendrites (Maccaferri & McBain, 1996a; Martina et al. 2000), (3) a pronounced sag, presumably due to activation of a hyperpolarization-activated current Ih (Sik et al. 1995; Maccaferri & McBain, 1996b), and (4) repetitive firing with a maximal frequency in the range of 40–70 Hz. Patch pipettes were pulled from borosilicate glass tubing (2.0 mm outer diameter, 0.5 mm wall thickness) and heat-polished before use. The pipette resistance ranged from 2 to 5 MΩ, and the series resistance in the whole-cell configuration was 7–15 MΩ. Only neurones with initial resting potentials more negative than −55 mV were accepted. To isolate nucleated patches, a negative pressure (5–12 kPa) was applied and the patch pipette was withdrawn slowly; a small negative pressure (2–5 kPa) was kept during recording. Nucleated patches had input resistances of > 1 GΩ; their shape was roughly spherical, and mean diameter was 8.5 ± 0.3 μm (Fig. 1Ac).
Figure 1. Recording from OA interneurones in hippocampal slices.
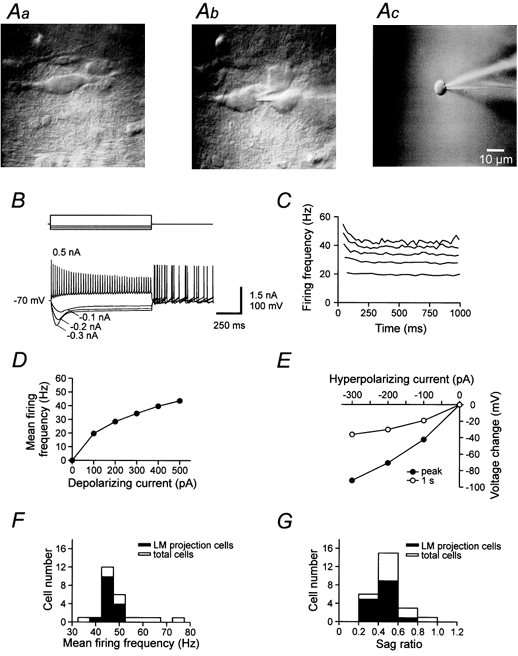
A, IR-DIC videoimages of OA interneurones in the hippocampal CA1 region in control conditions (a), with a recording pipette in the whole-cell configuration (b), and after excision of the nucleated patch (c). B, voltage responses to 1 s de- or hyperpolarizing current pulses in the whole-cell current-clamp recording configuration. Membrane potential before the pulse was −70 mV. Current during the pulse was −0.1, −0.2, −0.3 and +0.5 nA. Note the sag during hyperpolarizing current pulses and the generation of rebound spikes after the pulses. C, action potential frequency, calculated from the interspike interval, during 1 s current pulses (0.1–0.5 nA, 0.1 nA increments; lowermost data set corresponding to the smallest current). D, mean action potential frequency, plotted against injected current. E, mean peak voltage (•) and mean voltage at the end of the 1 s pulse (○), plotted against amplitude of the hyperpolarizing current pulse. Note the presence of a marked sag. Data in A-E were obtained from the same cell. F and G, histograms of maximal mean action potential frequency for 0.5 nA current pulses (F) and of sag ratio (voltage change at the end of the 1 s pulse / maximal voltage change for −0.3 nA current pulses, G). Resting membrane potentials were set to −70 mV in all cells by injection of a small hyperpolarizing current (−10 to −40 pA). Open bars in F and G represent the total sample of 24 morphologically analysed cells, filled bars represent OA interneurones with axonal arborization in stratum lacunosum-moleculare (LM).
Nucleated patch recordings (voltage clamp) and whole-cell recordings (current clamp) were made using an Axopatch 200A amplifier (Axon Instruments, Foster City, CA, USA) that included a bridge-balance circuit for series resistance compensation in current-clamp mode. Signals were filtered at 5 kHz using the 4-pole low-pass Bessel filter, and capacitive transients were reduced by the compensation circuit of the amplifier. A 1401plus interface (CED, Cambridge, UK) connected to a personal computer was used for stimulus generation and data acquisition. The sampling frequency was 10 kHz. In some cases, digitized traces were passed through an additional Gaussian filter.
Nucleated patches were held at −90 mV. Pulse sequences were generated by home-made programs. Leakage and capacitive currents were subtracted on-line using a ′P over −4′ procedure (Martina & Jonas, 1997; Martina et al. 1998). Sodium currents, when apparent, were blocked by adding 0.5 μm tetrodotoxin (TTX) to the external solution. Traces shown in the figures represent single sweeps or averages of up to 6 sweeps. Pulse sequences were applied every 4–10 s. The wash-in of TEA, 4-AP, and dendrotoxin was monitored continuously, and final recordings were made in steady-state conditions. No correction for liquid junction potentials was made. The electrophysiological data included in this study were obtained from 195 nucleated patches. All recordings were made at room temperature (20–24 °C).
Solutions and chemicals
Slices were superfused with physiological extracellular solution containing (mm): 125 NaCl, 25 NaHCO3, 2.5 KCl, 1.25 NaH2PO4, 2 CaCl2, 1 MgCl2, and 25 glucose, bubbled with 95 % O2 and 5 % CO2. 4-AP (from 0.5 m stock solution in distilled water) and TEA (from 1 m stock solution in distilled water) were applied to nucleated patches either via bath superfusion or using a multi-barrelled application pipette (perfused with Hepes-buffered Na+-rich solution containing (mm): 135 NaCl, 5.4 KCl, 1.8 CaCl2, 1 MgCl2, and 5 Hepes, pH adjusted to 7.2 with NaOH). α-Dendrotoxin (DTX, 20 μm stock solution in distilled water) was applied with the application pipette; in these experiments, 0.1 % bovine serum albumin was added to the Hepes-buffered Na+-rich solution. 8-(4-chlorophenylthio)-adenosine 3′:5′-cyclic monophosphate (cpt-cAMP, directly dissolved in final solution) plus 3-isobutyl-1-methylxanthine (IBMX; 0.5 m stock solution in dimethyl sulfoxide) were applied by bath perfusion. Recording pipettes were filled with K+-rich internal solution, containing (mm): 140 KCl, 10 EGTA, 2 MgCl2, 2 Na2ATP and 10 Hepes, pH adjusted to 7.3 with KOH. In some experiments, 2 mm glutathione-SH was included in the internal solution; the kinetic properties of K+ channels did not appear to differ from those in the absence of glutathione. For staining of neurones, the internal solution contained (mm): 120 potassium gluconate, 20 KCl, 10 EGTA, 2 MgCl2, 2 Na2ATP, and 10 Hepes, pH adjusted to 7.3 with KOH. In a subset of experiments (Fig. 8B and C), 2 μm H-89 (10 mm stock solution in dimethyl sulfoxide) was added to the internal solution. Final solutions were prepared on the day of experiment. TTX and DTX were from Alomone (Jerusalem, Israel), cpt-cAMP and IBMX were from Sigma, H-89 was from Calbiochem (La Jolla, CA, USA), all other chemicals were from Merck, Sigma, Riedel-de-Haën, or Gerbu.
Figure 8. Modulation of fast delayed rectifier K+ channels by the cAMP pathway.
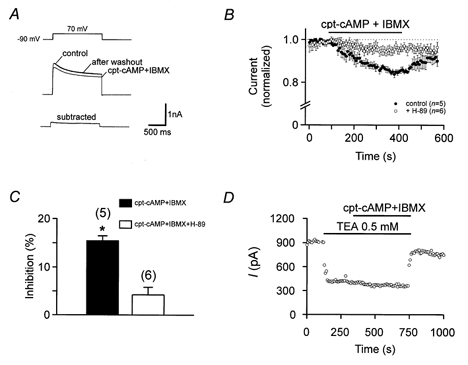
A, top traces show K+ currents in a nucleated patch in control conditions, in the presence of 2 mm external cpt-cAMP plus 0.5 mm IBMX, and after wash out. Bottom trace is subtracted current (Icontrol – I2mmcpt-cAMP+0.5mmIBMX). B, onset of the effect of 2 mm cpt-cAMP plus 0.5 or 1 mm IBMX. •, five nucleated patches with standard internal solution; ○, six nucleated patches with internal solution containing 2 μm H-89. C, bar graph summarizing the inhibition of the K+ current by cpt-cAMP plus IBMX in control conditions and with H-89 in the intracellular solution. * Significant difference (P < 0.005). D, occlusion between low concentration of external TEA and 2 mm cpt-cAMP plus 0.5 mm IBMX, suggesting that the cAMP pathway selectively affects the TEA-sensitive K+ current component.
Data analysis
Analysis was made using home-made programs, Sigmaplot 5.0 (SPSS, Chicago, IL, USA), or Mathematica 4.01 (Wolfram Research, Champaign, IL, USA). Current amplitudes were measured from baseline either preceding (most cases) or following (inactivation curves) the depolarizing pulse. To obtain the activation curve, values of chord conductance (G) were calculated from the respective peak currents, assuming ohmic behaviour and a reversal potential of −95 mV (Martina et al. 1998). Activation curves were fitted with a Boltzmann function raised to the 4th power:
where V is the membrane potential, V1/2 is the potential where the value of the Boltzmann function is 0.5, and k is the slope factor; the midpoint potentials given in the text indicate the potential where f = 0.5. Inactivation curves for delayed rectifier components were fitted with a Boltzmann function plus a constant:
where A is the fraction of channels that inactivate. Fitting was made using a non-linear least-squares algorithm.
Data are reported as means ± standard error of the mean (s.e.m.); error bars in figures also represent s.e.m. and were plotted only when they exceeded the respective symbol size. Statistical significance was assessed using Student's two-sided t test at a given significance level (P). Activation and inactivation curves in figures show data pooled from different patches. Standard errors of midpoint potentials and slope factors were obtained by analysing data of individual experiments separately. Standard errors of parameters of dose-response curves and recovery from inactivation were calculated by a parametric bootstrap method (Efron & Tibshirani, 1998). Artificial data sets (500) were generated in which the original values were replaced by normally distributed random numbers with means and s.e.m.s identical to those of the original data points, and were fitted as the original data set.
Morphological analysis
Morphological methods were similar to those reported previously (Martina et al. 2000). A separate subset of OA interneurones was filled with biocytin (0.5 %) during recording (a combination of morphological analysis with nucleated patch analysis or single-cell RT-PCR was not feasible). After pipette withdrawal, slices were fixed in 2.5 % paraformaldehyde, 1.25 % glutaraldehyde, 15 % picric acid in 100 mm phosphate buffer (PB, at pH 7.4, for 12 h, at 4 °C). After fixing and rinsing, slices were treated with hydrogen peroxide (1 %, for 10 min) and rinsed in PB several times. Following incubation in 10 and then 20 % sucrose solution (in PB), slices were snap-frozen in liquid nitrogen, and finally thawed to room temperature. Slices were then incubated in PB containing 1 % avidin-biotinylated horseradish peroxidase complex (ABC, Vector Laboratories, Burlingame, CA, USA) for about 12 h at 4 °C in the dark. Excess ABC was removed by several rinses in PB and the slices were developed with 0.05 % 3,3′-diaminobenzidine tetrahydrochloride (DAB) and 1 % hydrogen peroxide. Finally, slices were embedded in Mowiol (Aldrich), and neurones were examined by a light microscope using ×10–60 objectives.
Single-cell RT-PCR
Single-cell RT-PCR was performed as described previously (Monyer & Jonas, 1995; Martina et al. 1998) with minor modifications. Kv3 transcripts (Kv3.1 and Kv3.2) were amplified with common degenerate primers in the first round of PCR and with specific primers in the second round of PCR. Kv4 transcripts (Kv4.2 and Kv4.3) were amplified with degenerate primers in both rounds. Cycle conditions were similar to those described previously (Martina et al. 1998). Positive controls for primer efficiency were run using plasmids (detection threshold: < 100 attograms), showing that the respective cDNAs in 1:1 plasmid mixtures were amplified with similar efficacy. Controls for possible contamination artifacts were performed for each PCR amplification. Additional controls to exclude non-specific harvesting were performed by advancing pipettes into the slice and taking them out without seal formation and suction (Monyer & Jonas, 1995). Both types of controls gave negative results throughout. The molecular identity of the PCR products was tested using Southern blotting with radiolabelled oligonucleotides. Amplification of genomic DNA could be excluded by the intron-overspanning location of the primers. Primer sequences and locations (referring to published sequences in the GenBank of the National Center for Biotechnology Information, http://www.ncbi.nlm.nih.gov/) were as follows:
Kv3.1 (X62840) and Kv3.2 (X62839): first round of PCR with common upper primer: 5′-CAG CAC CG(GC) GAC GC(GT) GAG GAG GC-3′ (617–649, 662–685), common lower primer: 5′-AAA TGG CGG GT(AC) AGC TTG AAG AT-3′ (1247–1270, 1262–1285). Second round of PCR with specific Kv3.1 upper primer: 5′-GGC GAG GAC GAG CTG GAG ATG A-3′ (719–741), Kv3.1 lower primer: 5′-TTT CGA ACG TTC TCA ATT-3′ (955–973), Kv3.2 upper primer: 5′-TTG AGG ATG CTG CGG GGC TGG GAG-3′ (765–789), Kv3.2 lower primer: 5′-TGG TGC CGT TGA TGA CTG G-3′(977–996).
Kv4.2 (S64320) and Kv4.3 (U75448): upper primer: 5′-T(CT)A TCG A(TC)G TGG TGG CCA TC-3′ (1342–1361, 802–821), upper nested primer: 5′-TAC AC(AC) CT(CG) AAG AGC TGT GC-3′ (1494–1513, 954–973), lower primer: 5′-TGG TAG AT(CG) C(GT)(AG) CT(AG) AAG TT-3′ (1773–1792, 1223–1242). Oligonucleotide probes and conditions for hybridization were identical to those described previously (Martina et al. 1998).
RESULTS
Action potential pattern and morphological properties of OA interneurones
We performed whole-cell recordings and nucleated patch recordings from interneurones with horizontal dendrites in stratum oriens-alveus (OA) of the hippocampal CA1 region (Fig. 1). Infrared-DIC images of a typical OA interneurone are shown in Fig. 1A, and responses of the same cell to de- or hyperpolarizing current pulses in the whole-cell configuration are illustrated in Fig. 1B. The large majority of OA interneurones showed three functional characteristics. First, OA interneurones generated trains of action potentials during 1 s depolarizing current pulses at 22 °C (Fig. 1B and D). Second, OA interneurones showed a modest adaptation in action potential frequency and a decrease in action potential amplitude during the train (Fig. 1B and C). Finally, OA interneurones showed a marked sag during hyperpolarizing current pulses (Fig. 1B and E), presumably due to activation of a hyperpolarization-activated current Ih (Sik et al. 1995; Maccaferri & McBain, 1996b). The large majority of neurones exhibited a maximal mean action potential frequency of approximately 50 Hz (Fig. 1F) and a sag ratio (voltage change at the end of the 1 s hyperpolarizing pulse/maximal voltage change) of approximately 0.5 (Fig. 1G).
To examine the identity of the recorded neurones further, a correlated analysis of electrical properties and morphology was performed (Fig. 2). In total, 24 OA interneurones with horizontal dendrites were filled with biocytin during recording and visualized by standard staining procedures (see Methods). In 15 neurones, the main part of the axonal arborization was located in stratum lacunosum-moleculare. In the remaining 9 neurones, the axon was either cut close to the site of origin (6 cells) or in stratum radiatum (1 cell), or was confined to stratum oriens-alveus (2 cells). In the 15 neurones rigorously identified as OA interneurones projecting into stratum lacunosum-moleculare, the maximal mean action potential frequency was 45.7 ± 0.8 Hz, and the sag ratio was 0.46 ± 0.03 (Fig. 1F and G, filled bars), very similar to that of the overall population (Fig. 1F and G, open bars).
Figure 2. Identification of OA interneurones by intracellular filling with biocytin.
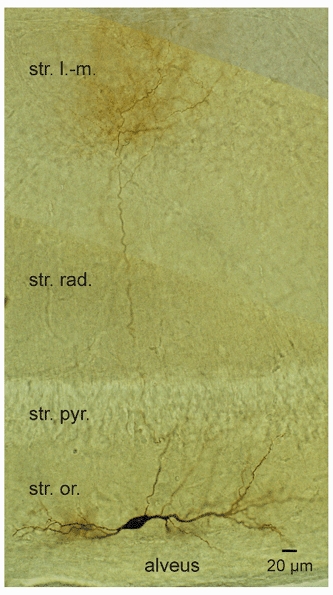
Morphological properties of an OA interneurone filled with biocytin during whole-cell recording. Photomontage of three images at slightly different focal planes. Note that the axon crosses the pyramidal cell layer and shows an extensive arborization in stratum lacunosum-moleculare. Str. l.-m., stratum lacunosum-moleculare; str. rad., stratum radiatum; str. pyr., stratum pyramidale; str. or., stratum oriens. For the cell shown, the mean action potential frequency for a +0.5 nA current pulse was 44.7 Hz, and the sag ratio for a −0.3 nA current pulse was 0.39.
Pharmacological dissection of three kinetically distinct K+ current components
We next characterized the functional properties of K+ channels expressed in these OA interneurones using the nucleated patch configuration, which allowed us to examine channel gating under ideal voltage-clamp conditions (Fig. 1Ac). 4-AP, TEA, and peptide toxins were shown previously to distinguish between recombinant K+ channels assembled from subunits of different Kv subfamilies (Coetzee et al. 1999). We, therefore, examined the effects of these blockers on the K+ currents (Fig. 3). Micromolar concentrations of both 4-AP and TEA blocked the K+ currents in nucleated patches (Fig. 3A and B). In contrast, DTX (500 nm), a selective blocker of K+ channels assembled from Kv1.1, 1.2 and 1.6 subunits (Coetzee et al. 1999; Bekkers & Delaney, 2001), had only minimal effects; the peak current in the presence of DTX was 99.2 ± 5.9 % of the control value (n = 3, P > 0.5; Fig. 3C).
Figure 3. Pharmacological properties of K+ channels in nucleated patches from OA interneurones.
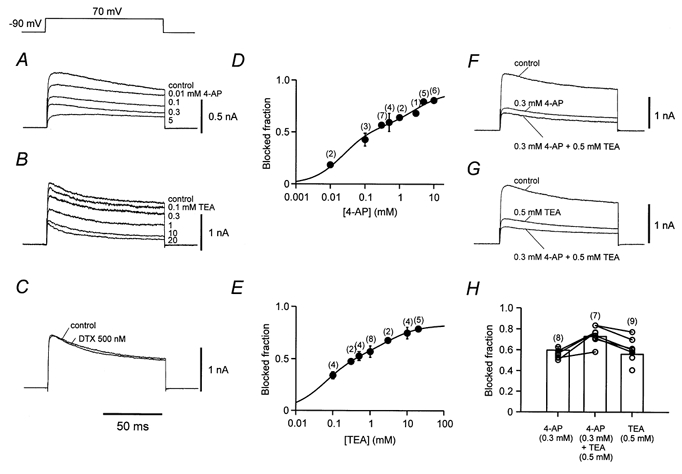
A-C, K+ current traces in control conditions and in the presence of different concentrations of external 4-AP (A), TEA (B), and in 500 nm DTX (C). Recordings from different nucleated patches. D and E, concentration-effect curves for external 4-AP (D) and TEA (E). Continuous curves represent the sum of two Hill equations (Hill coefficients constrained to 1) fitted to the data points. The IC50 values were 24 ± 19 μm (56 ± 16 %) and 2.8 ± 3.2 mm (32 ± 12 %) for 4-AP and 63 ± 36 μm (55 ± 12 %) and 3.2 ± 3.6 mm (28 ± 10 %) for TEA. F and G, K+ current traces in control conditions, in the presence of either 0.3 mm 4-AP or 0.5 mm TEA, and in the presence of both blockers. H, fraction of total K+ current blocked by TEA, 4-AP, and a combination of both blockers. ○, individual measurements; bars, mean values. Measurements from the same patch are shown connected by lines. Note marked occlusion of the effects. Currents were evoked by test pulses to +70 mV (from a holding potential of −90 mV) in all experiments. Numbers of patches are given in parentheses above data points or bars.
The concentration dependence of the block by 4-AP and TEA is illustrated in Fig. 3D and E, respectively. For both 4-AP and TEA, the block was incomplete even at millimolar concentrations. When data points were fitted with a single Hill equation, the Hill coefficient was significantly less than 1 (0.51 ± 0.19 for 4-AP and 0.49 ± 0.15 for TEA; data not illustrated). We, therefore, fitted the data with the sum of two Hill equations (Martina et al. 1998; Southan & Robertson, 2000), constraining the Hill coefficients to 1 (e.g. Kirsch & Drewe, 1993). For 4-AP, the half-maximal inhibitory concentrations (IC50 values) were 24 μm and 2.8 mm, and the blocked fractions were 56 and 32 % (Fig. 3D). Similarly, for TEA the IC50 values were 63 μm and 3.2 mm, and the blocked fractions were 55 and 28 % (Fig. 3E). These results indicate that the K+ current in nucleated patches of OA interneurones is comprised of multiple components that differ in their sensitivity to both 4-AP and TEA.
We next examined possible additive effects of low concentrations of 4-AP and TEA (Fig. 3F-H). 4-AP (0.3 mm) and TEA (0.5 mm) blocked 59.6 ± 3.4 and 55.9 ± 1.0 % of the total K+ current, respectively. Coapplication of 0.3 mm 4-AP and 0.5 mm TEA blocked 72.8 ± 2.9 % of the total K+ current, significantly more than the effect of each of the blockers (P < 0.05), but markedly less than the arithmetic sum of the individual effects (Fig. 3F-H). Thus, these results show a large degree of occlusion between the effects of low concentrations of 4-AP and TEA.
To characterize the K+ current components further, we correlated pharmacological properties with gating characteristics (Fig. 4). Subtraction analysis revealed that the current component sensitive to low concentrations of TEA showed fast activation, but little inactivation during 100 ms test pulses (Fig. 4A, C). The current component blocked by low concentrations of 4-AP showed identical properties (Fig. 4B and C), suggesting that it is mediated by the same type of channel. In contrast, the current component sensitive to high concentrations of TEA showed a slower activation time course (Fig. 4A and C), and resembled the current remaining in the presence of 5 mm 4-AP (Fig. 4B). Finally, the current component sensitive to high concentrations of 4-AP was rapidly inactivating (Fig. 4B and C), and resembled the current remaining in the presence of 20 mm TEA (Fig. 4A). In summary, these results indicate that the K+ current in nucleated patches of OA interneurones is composed of three pharmacologically and kinetically distinct components: A fast delayed rectifier component that is highly sensitive to both 4-AP and TEA, a slow delayed rectifier component with intermediate TEA-sensitivity, but resistance against 4-AP, and an inactivating (A-type) K+ current component that is largely TEA-resistant, but is blocked by high concentrations of 4-AP. The mean relative contributions of the three components in nucleated patches were 57 ± 5, 25 ± 6 and 19 ± 2 % (n = 12, 9 and 10, respectively; Table 1).
Figure 4. Current subtraction analysis suggests the presence of three kinetically distinct K+ current components in nucleated patches.
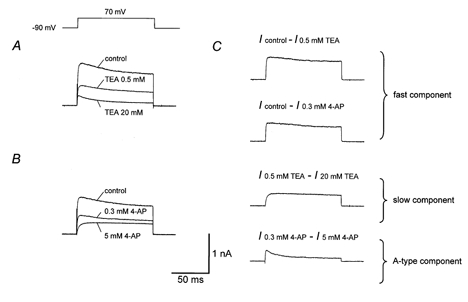
A, K+ currents in different concentrations of external TEA. B, K+ currents in different concentrations of external 4-AP. Traces were obtained from the same patch as shown in A; trace designated as ‘control’ was obtained after washout of 20 mm TEA (approximately 90 % reversibility). C, currents obtained by digital subtraction of the traces shown in A and B (Icontrol – I0.5mmTEA, Icontrol – I0.3mm4-AP, I0.5mmTEA – I20mmTEA, I0.3mm4-AP – I5mm4-AP). Note that the time course of Icontrol – I0.5mmTEA is almost identical to that of Icontrol – I0.3mm4-AP, but markedly faster than that of I0.5mmTEA – I20mmTEA. Also note that the time course of I0.3mm4-AP – I5mm4-AP is very similar to that of the current in the presence of 20 mm TEA (lowermost trace in A). Currents were evoked by test pulses to +70 mV (from a holding potential of −90 mV).
Table 1.
Functional properties of three major K+ current components in OA interneurones
| 1. Fast delayed rectifier (%) | 57±5 | (12) |
| Activation curve | ||
| Midpoint V (mV) | −8.0±2.1 | |
| k (mV) | 16.1±0.7 | (10) |
| Inactivation curve | ||
| Midpoint V (mV) | −40.6±2.4 | |
| k (mV) | 7.8±0.8 | |
| Non-inact. comp. (%) | 8±4 | (5) |
| Deactiv. time constant (−40mV)(ms) | 11.1±0.9 | (7) |
| 2. Slow delayed rectifier (%) | 25±6 | (9) |
| Activation curve | ||
| Midpoint V (mV) | −3.6±4.2 | |
| k (mV) | 23.1±1.0 | (7) |
| Inactivation curve | ||
| Midpoint V (mV) | −52.2±7.7 | |
| k (mV) | 15.2±1.7 | |
| Non-inact. comp.(%) | 7±2 | (5) |
| Deactiv. time constant (−40mV)(ms) | 21.0±1.7 | (9) |
| 3. A-type(%) | 19±2 | (10) |
| Activation curve | ||
| Midpoint V (mV) | −0.2±3.0 | |
| k (mV) | 26.8±0.8 | (10) |
| Inactivation curve | ||
| Midpoint V (mV) | −78.5±2.4 | |
| k (mV) | 6.0±1.2 | (7) |
| Recovery from inactivation time | ||
| constant (ms) | 39.3±18.5 | |
| Amplitude (%) | 42±13 | |
| Time constant (ms) | 329±317 | |
| Amplitude (%) | 36±12 | (6) |
Values indicate: means, s.e.m., and total number of nucleated patches (in parentheses). Non-inact., non-inactivating; deactiv. deactivation.
Gating properties of the three types of K+ channels in OA interneurones
Subtraction analysis allowed us to examine the gating properties of the three components in isolation (Figs 5–7). The fast delayed rectifier component, isolated as Icontrol – I0.3mm4-AP or Icontrol – I0.5mmTEA, had an activation curve with a midpoint potential of −8.0 ± 2.1 mV and a slope factor of 16.1 ± 0.7 mV (Fig. 5A and B; Table 1). Although this K+ current component showed little inactivation during 100 ms test pulses, inactivation by 10 s prepulses above −40 mV was substantial (Fig. 5A and B). The inactivation curve showed a midpoint potential of −40.6 ± 2.4 mV and a slope factor of 7.8 ± 0.8 mV (Fig. 5A and B; Table 1). The 20–80 % rise time was strongly voltage dependent, ranging from 11.6 ms at −10 mV to 0.8 ms at +70 mV (Fig. 5C). A striking kinetic property was the fast deactivation kinetics; the mean deactivation time constant at −40 mV was 11.1 ± 0.9 ms (n = 7; Fig. 5D; Table 1).
Figure 5. Gating properties of the fast delayed rectifier K+ current component.
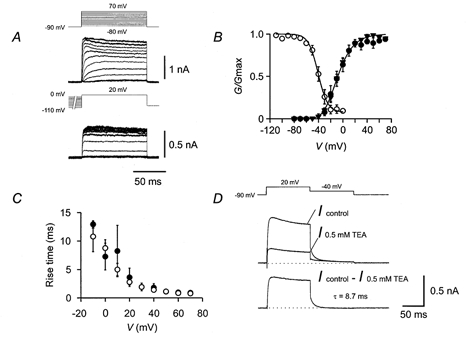
A, traces of K+ current obtained by subtraction (Icontrol – I0.5mmTEA). In the upper panel, the test pulse potential was varied from −80 to +70 mV (10 mV increments), and the holding potential was −90 mV. Clear outward currents were evoked by test pulses with potentials ≥ −20 mV. In the lower panel, the potential of the prepulse (10 s) was varied from −110 mV to 0 mV, and the test pulse potential was kept constant at +20 mV. Pulse protocols are shown above the traces. B, activation curve (▾, Icontrol – I0.5mmTEA; •, Icontrol – I0.3mm4-AP; n = 6 and 4, respectively) and inactivation curve (○, Icontrol – I0.5mmTEA, n = 5). Activation data were fitted with a Boltzmann function raised to the 4th power. Inactivation data were fitted with a simple Boltzmann function plus a constant. Pulse protocols as described in A. For curve parameters, see Table 1. C, 20–80 % rise time, plotted against test pulse potential (○, Icontrol – I0.5mmTEA; •, Icontrol – I0.3mm4-AP; n = 6 and 4, respectively). D, deactivation time course. Top traces indicate K+ current in control conditions and in the presence of 0.5 mm TEA, lower trace is subtracted current (Icontrol – I0.5mmTEA). Fitted exponential function is shown superimposed; the deactivation time constant was 8.7 ms.
Figure 7. Gating properties of the A-type K+ current component.
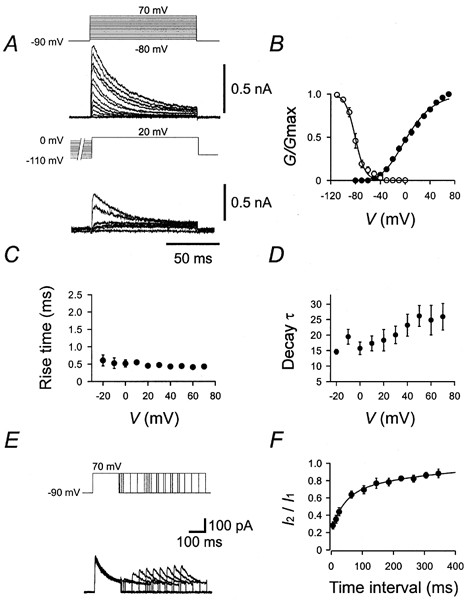
A, traces of K+ current in the presence of 20 mm external TEA. Pulse protocols (identical to those used in Fig. 5) are shown above the traces. B, activation curve (•, n = 10) and steady-state inactivation curve (○, n = 7). C, 20–80 % rise time, plotted against test pulse potential (n = 10). D, decay τ, plotted against test pulse potential (n = 10). The decay phase of the current during a 100 ms pulse was fitted with the sum of a single exponential function and a constant. E, traces of K+ currents in the presence of 20 mm external TEA. Pulse protocol: holding potential −90 mV, 150 ms pulse to +70 mV (conditioning pulse), pulse of variable duration to −90 mV, 150 ms pulse to +70 mV (test pulse), and step back to −90 mV. Pulse protocol is shown above the traces. F, time course of recovery from inactivation (n = 6). The amplitude of the peak current evoked by the test pulse (I2) divided by that evoked by the conditioning pulse (I1) was plotted against the interpulse interval. Data points were fitted with the sum of two exponentials. For curve parameters see Table 1.
The slow delayed rectifier component, isolated as I5mm4-AP, I10mm4-AP, I0.5mmTEA – I20mmTEA, or I0.3mm4-AP – I0.3mm4-AP+20mmTEA showed an activation curve with comparable midpoint potential (-3.6 ± 4.2 mV), but less steep voltage-dependence (slope factor 23.1 ± 1.0 mV; Fig. 6A and B; Table 1) than that of the fast delayed rectifier component. This K+ current component showed little inactivation during 100 ms test pulses, but substantial inactivation by 10 s prepulses (Fig. 6A and B). The inactivation curve had a midpoint potential of −52.2 ± 7.7 mV and a slope factor of 15.2 ± 1.7 mV (Fig. 6A and B; Table 1). Consistent with the less steep activation curve, the rise time was less voltage dependent, ranging from 18.7 ms at −10 mV to 6.7 ms at +70 mV (Fig. 6C). The deactivation kinetics were significantly slower than those of the first component; the mean deactivation time constant at −40 mV was 21.0 ± 1.7 ms (n = 9; P < 0.001; Fig. 6D; Table 1).
Figure 6. Gating properties of the slow delayed rectifier K+ current component.
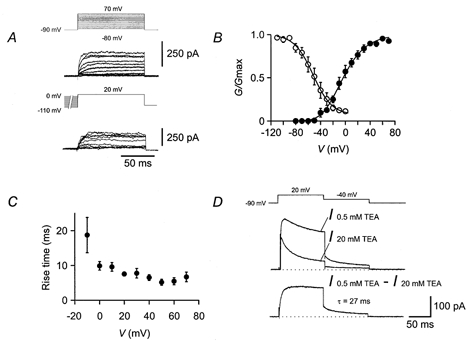
A, traces of K+ current in the presence of external 10 mm 4-AP. Pulse protocols (identical to those used in Fig. 5) are shown above the traces. B, activation curve (•, n = 7) and inactivation curve (○, n = 5). The slow delayed rectifier K+ current component was studied as the current remaining in the presence of 5 or 10 mm 4-AP or was isolated by subtraction (I0.5mmTEA – I20mmTEA, I0.3mm4-AP – I0.3mm4-AP+20mmTEA). For curve parameters see Table 1. C, 20–80 % rise time, plotted against test pulse potential (n = 7). D, deactivation time course. Top traces indicate K+ current in 0.5 and 20 mm TEA, lower trace is subtracted current (I0.5mmTEA – I20mmTEA). Fitted exponential function is shown superimposed; the deactivation time constant was 27 ms.
The A-type, TEA-insensitive, component had an activation curve with a midpoint potential of −0.2 ± 3.0 mV and a slope factor of 26.8 ± 0.8 mV (Fig. 7A and B; Table 1). This K+ current component showed marked inactivation during 100 ms test pulses and complete inactivation by 10 s prepulses. The steady-state inactivation curve had a midpoint potential of −78.5 ± 2.4 mV and showed steep voltage-dependence (slope factor 6.0 ± 1.2 mV; Fig. 7A and B). The rise time of the current was fast and almost independent of voltage (Fig. 7C), whereas the decay time constant was slower and increased with increasing membrane potential (Fig. 7D). The time course of recovery from inactivation, investigated by a double-pulse protocol (Martina et al. 1998), was biexponential: the time constants were 39.3 and 329 ms, respectively (Fig. 7E and F; Table 1).
Selective modulation of fast delayed rectifier K+ channels
Previous studies suggested that subtypes of delayed rectifier K+ channels are selectively modulated by the cAMP pathway (Moreno et al. 1995; Atzori et al. 2000). We have examined this directly, by coapplication of a membrane-permeant form of cAMP (cpt-cAMP) and the phosphodiesterase blocker IBMX to nucleated patches (Fig. 8). Coapplication of 2 mm cpt-cAMP plus 0.5 or 1 mm IBMX resulted in a slow, reversible reduction of the K+ outward current in nucleated patches from OA interneurones (n = 5; Fig. 8A and B). On average, 15.8 ± 0.8 % of the total K+ current was inhibited. In contrast, in the presence of 2 μm of the protein kinase A blocker H-89 in the pipette solution, cpt-cAMP plus IBMX had no significant effects (n = 6; P > 0.3; Fig. 8B and C). These results suggest that OA interneurone K+ channels were inhibited via PKA-mediated phosphorylation. The effect of cpt-cAMP plus IBMX appeared to be mediated by changes in the number of available channels rather than changes in gating properties, since the midpoint potentials and slopes of activation curves of the delayed rectifier K+ current were unaffected by cpt-cAMP plus IBMX (midpoint potentials: −5.8 ± 5.0 vs. −2.3 ± 3.8 mV; slope factors: 16.9 ± 0.6 vs. 18.5 ± 0.9 mV; n = 3, data not illustrated).
Two lines of evidence suggested that cpt-cAMP plus IBMX primarily affected the fast delayed rectifier component. First, current subtraction revealed that the current component affected showed fast activation and little inactivation during test pulses (Fig. 8A). Second, cpt-cAMP plus IBMX had no significant effects in the presence of 0.5 mm TEA (Fig. 8D). Thus, the fast delayed rectifier component appears to be selectively inhibited by cAMP.
Single-cell RT-PCR analysis of K+ channel subunit transcripts
Previous studies indicated that Kv3 and Kv4 subunits are expressed differentially between principal neurones and interneurones (Martina et al. 1998). We therefore examined the expression of these K+ channel subunits in OA interneurones by single-cell RT-PCR. The cytoplasm of single OA neurones was harvested into the recording pipette, and the harvested material was used for reverse transcription and PCR (Monyer & Jonas, 1995; see Methods). The amplified cDNA products were visualized on ethidium bromide-stained gels (Fig. 9A and Fig. 10A) and probed with specific radiolabelled oligonucleotides (Fig. 10B).
Figure 9. Single-cell RT-PCR reveals the expression of Kv3 mRNA in OA interneurones.
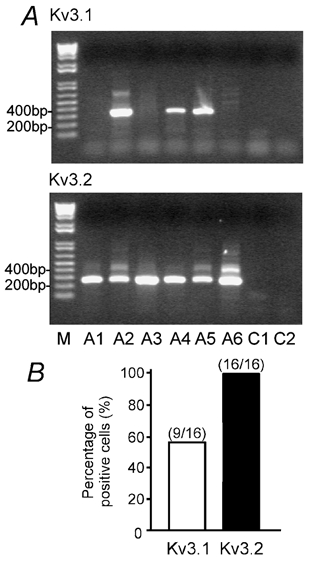
A, ethidium bromide-stained gels of the PCR products amplified with primers specific for Kv3.1 and Kv3.2 transcripts. Material from six OA interneurones (A1-A6). Molecular weight marker (M) is shown in the left lane, together with the corresponding number of base pairs. PCR controls (C1, C2; without any PCR product) are shown in the right lanes. B, bar graph showing the percentage of OA interneurones expressing Kv3.1 and Kv3.2 transcripts.
Figure 10. Single-cell RT-PCR suggests the expression of Kv4.3 homomeric channels in OA interneurones.
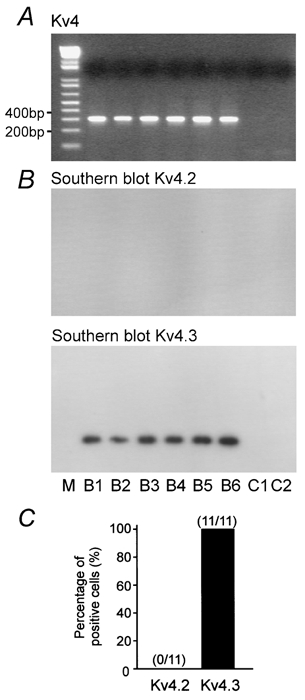
A, ethidium bromide-stained gels of the PCR products amplified with primers specific for Kv4 transcripts. B, Southern blot analysis of gels with selective radiolabelled oligonucleotide probes specific for Kv4.2 and Kv4.3 transcripts. Note the lack of expression of Kv4.2. Material from six OA interneurones (B1-B6). Molecular weight marker (M) is shown in the left lane, together with the corresponding number of base pairs. PCR controls (C1, C2; without any PCR product) are shown in the right lanes. C, bar graph showing the percentage of OA interneurones expressing Kv4.2 and Kv4.3 transcripts.
Single-cell RT-PCR analysis revealed that the K+ channel expression pattern of OA interneurones differed from that of dentate gyrus basket cells (BCs, Martina et al. 1998). In OA interneurones the abundance of Kv3.2 mRNA was much higher than that of Kv3.1 mRNA (Fig. 9A). 100 % of OA interneurones (n = 16) expressed Kv3.2 mRNA, whereas only 56 % of cells (n = 9) were positive for Kv3.1 mRNA (Fig. 9B). Similarly, 100 % of cells (n = 11) expressed Kv4.3 mRNA, whereas Kv4.2 mRNA was not detected (Fig. 10A and B). These results suggest that the fast delayed rectifier K+ current in OA interneurones is mediated predominantly by Kv3.2 homomeric channels, whereas the A-type current is mediated exclusively by Kv4.3 homomers.
DISCUSSION
Using the nucleated patch configuration that allows us to investigate somatic ion channels under ideal voltage-clamp conditions (Martina et al. 1998), we have examined the functional properties of voltage-gated K+ channels expressed in OA interneurones in the hippocampal CA1 region, a major class of dendritic inhibitory interneurone. The main results are as follows. First, the macroscopic K+ current in OA interneurones consists mainly of a fast delayed rectifier, a slow delayed rectifier, and an A-type component, although we cannot exclude the presence of additional components with small contributions. Second, we have found that the fast delayed rectifier K+ channel is selectively modulated by the cAMP pathway, presumably via PKA-mediated phosphorylation. Third, the subunit composition of the voltage-gated K+ channels in OA interneurones appears to be unique. OA interneurones typically express only a single type of subunit of the same subfamily, suggesting preferential assembly of homomeric rather than heteromeric channels (Ruppersberg et al. 1990).
A Kv3.1/3.2-like channel is the major voltage-gated K+ channel in OA interneurones
The present results reveal three functionally distinct components of the macroscopic K+ current in nucleated patches from OA interneurones. A previous report distinguished a sustained K+ current component and an A-type K+ current component in OA cells (in addition to a Ca2+-activated component; Zhang & McBain, 1995a). A major fraction of the sustained component showed intermediate sensitivity to TEA (IC50 = 7.4 mm), but insensitivity to 4-AP, like the slow delayed rectifier component reported here. However, a small fraction (∼10 %) of the sustained component was sensitive to 50 μm 4-AP (Zhang & McBain, 1995a), similar to our fast delayed rectifier K+ channel. It is unclear why this fast delayed rectifier component is substantially smaller than that observed in our study. Differences may be due to the smaller test pulse potential, different recording configurations, heterogeneity of interneurones examined, or downregulation of this component by neuromodulators in the latter study (see below).
Several lines of evidence converge on the conclusion that this fast delayed rectifier component is mediated by Kv3.1/3.2 (Shaw-related) subunits. First, the channel is highly sensitive to both 4-AP and TEA (IC50 < 0.1 mm), which is characteristic for this channel subtype (Rettig et al. 1992; Grissmer et al. 1994). Second, the channel shows fast activation and deactivation, but very slow inactivation, similar to recombinant Kv3.1/3.2 channels (Rettig et al. 1992; Grissmer et al. 1994; Macica & Kaczmarek, 2001; Klemic et al. 2001). Although the midpoint potential for activation (-8.0 mV, this paper) is close to that of other native Kv3-like channels (e.g. in basal ganglia neurons; Baranauskas et al. 1999; Wigmore & Lacey, 2000), it is more negative than that of recombinant Kv3.1/Kv3.2 channels (+16 mV, Grissmer et al. 1994; +16.9 mV, Macica & Kaczmarek, 2001; +12.1 mV, Hernández-Pineda et al. 1999). Channel modulation may explain this difference (Macica & Kaczmarek, 2001). Finally, our single-cell RT-PCR experiments show directly that Kv3.2 mRNA is expressed in OA interneurones. As OA interneurones are mainly somatostatin positive (Katona et al. 1999; Martina et al. 2000), the present results are consistent with the previous suggestion that Kv3.2 protein, but not Kv3.1b protein, is expressed in a subset of somatostatin-positive neurones (Du et al. 1996; Atzori et al. 2000; their Fig. 1A).
Based on both functional properties and single-cell RT-PCR analysis, we further suggest that the A-type channel is formed by Kv4.3 (Shal-related) subunits. It is possible that the native channel is a Kv4.3 homomer. Alternatively, the native channel could be assembled from Kv4.3 principal subunits and accessory subunits (e.g. the K+ channel interacting protein KChIP; An et al. 2000). Based on its functional characteristics, the slow delayed rectifier component may be assembled from Kv2 (Shab-related) subunits, perhaps in combination with Kv5–9 subunits (reviewed by Coetzee et al. 1999). Consistent with this hypothesis, Kv2.1 is expressed in somatostatin-positive neurones in the hippocampus (Du et al. 2000).
Kv3.2-like channels as selective targets for neuromodulatory control
The present results show that fast delayed rectifier K+ channels are selective targets of neuromodulatory control (Nicoll, 1988; Atzori et al. 2000). In OA interneurons, bath application of 2 mm cpt-cAMP plus 0.5 mm IBMX blocked 15.8 % of total K+ current in nucleated patches. If the inhibition selectively affected Kv3.1/3.2 channels, as the occlusion by TEA (Fig. 8D) suggests, 27 % of the Kv3.1/3.2-like component would be inhibited. H-89 blocked the effect, suggesting the involvement of intracellular PKA. The reduction of the amplitude of the fast delayed rectifier current in OA interneurones by an increase of intracellular cAMP was consistent with the expression of Kv3.2 in OA interneurones. Kv3.2 channels, unlike Kv3.1 channels, show a consensus sequence for PKA phosphorylation (Rudy & McBain, 2001). Furthermore, recombinantly expressed Kv3.2 channels, but not Kv3.1 channels, are inhibited by cpt-cAMP plus IBMX (Moreno et al. 1995). In recombinant Kv3.2 channels, 1 mm cpt-cAMP plus 1 mm IBMX inhibit approximately 73 % of current (Moreno et al. 1995). The difference in the extent of inhibition observed in OA interneurones (27 %) may be due to a difference between native and recombinant channels, or to the different recording configurations, in which PKA is likely to be preserved to different degrees.
As Kv3 channels are selective neuromodulatory targets, their expression will enable differential neuromodulation of the spiking pattern in interneurones. Extrinsic innervation by cholinergic, serotonergic, or histaminergic pathways could lead to activation of receptors coupled to the cAMP pathway (Levey et al. 1995; Atzori et al. 2000; reviewed by Freund & Buzsáki, 1996). This will modulate the activity of Kv3 channels, and thus shift the corner frequency of reliable action potential initiation to lower values (Atzori et al. 2000). Additionally, intrinsic neuromodulatory pathways may operate. OA interneurones express nitric oxide (NO) synthase (Freund & Buzsaki, 1996). This may suggest the possibility of an intrinsic feedback mechanism, in which NO released from OA interneurones downregulates Kv3 channels in the same cells via activation of cyclic GMP pathway and phosphatases (Moreno et al. 2001). Both extrinsic and intrinsic pathways could regulate action potential duration and frequency in interneurones, which may help to maintain the balance between excitation and inhibition in the hippocampus (Galarreta & Hestrin, 1998).
K+ channel expression determines the action potential patterns of neurones
The spiking phenotype of a given neurone is determined by the combination of a variety of factors, including membrane time constant, voltage-gated Na+ channels (Martina & Jonas, 1997), voltage-gated and Ca2+-activated K+ channels (Storm, 1990), and Ih channels (Maccaferri & McBain, 1996b). Among them, the expression of voltage-gated K+ channels is probably the main factor that shapes the differences in the firing patterns between fast spiking perisomatic inhibitory interneurones and pyramidal neurones (Martina et al. 1998; Erisir et al. 1999). Fast delayed rectifier K+ channels assembled from Kv3 subunits facilitate fast spiking in basket cells (BCs, Martina et al. 1998). Slow delayed rectifier K+ channels, which are expressed in comparable amounts in different types of neurones, may confer adaptation of action potential frequency (Du et al. 2000). Finally, A-type K+ channels assembled from Kv4 subunits support regular spiking at low frequency in pyramidal neurones (Martina et al. 1998).
How do OA interneurones fit into this view? OA interneurones are fast spiking, although the maximal action potential frequency (Fig. 1) is below that of typical perisomatic inhibitory cells (Han et al. 1993; Sik et al. 1995; Martina et al. 1998). K+ channels in OA interneurones are similar to those of BCs in several functional parameters, such as the quantitative relative proportion of the three components, the midpoint potentials of activation and inactivation curves, and the pharmacological properties (Martina et al. 1998; this paper). However, two differences should be noted. First, activation and inactivation curves for all three K+ current components are less steep in OA interneurones than in both BCs and pyramidal neurones. Second, the deactivation of the fast delayed rectifier component is significantly slower than in BCs (11.1 ± 0.9 vs. 5.8 ± 0.4 ms; Martina et al. 1998). The higher expression level of Kv3.2 mRNA may explain the slower deactivation of the fast delayed rectifier component, because recombinant Kv3.2 channels deactivate more slowly than Kv3.1 channels (Hernández-Pineda et al. 1999). These differences may contribute to the lower maximal action potential frequency of OA interneurones.
Role of interneurone K+ channels in dendritic inhibition
Does the repetitive firing of dendritic inhibitory interneurones observed in vitro (e.g. Fig. 1) have any functional significance for the operation of the hippocampal network in vivo? Several lines of evidence suggest that this may be the case. First, OA interneurones generate action potentials with high frequency in the behaving animal; the average frequency is approximately 12 Hz during theta phases (Csicsvari et al. 1999). Second, inhibitory output synapses on pyramidal neurones lack paired-pulse depression (Maccaferri et al. 2000), suggesting that repetitive action potential generation will translate proportionally into increased inhibitory synaptic output. Third, repetitive activation of inhibitory synapses may be important for the regulation of plasticity at glutamatergic synapses on pyramidal cells (Katona et al. 1999); a long-lasting inhibitory output signal may be necessary to counter balance the activation of NMDA-type glutamate receptors, which is essential for induction of long-term potentiation at glutamatergic synapses (Bliss & Collingridge, 1993). Finally, the functional significance of repetitive firing of interneurones for the operation of the hippocampal network in vivo is underscored by the increased seizure susceptibility of Kv3.2 knockout mice (Lau et al. 2000). If dendritic inhibition is more important than perisomatic inhibition in controlling network activity (Cossart et al. 2001), the selective expression of Kv3.2 in dendritic inhibitory interneurones provides a straightforward explanation of this phenotype.
Acknowledgments
We thank Drs J. Bischofberger, M. Heckmann, and I. Vida for critically reading the manuscript, and A. Blomenkamp and K. Winterhalter for technical assistance. This work was supported by a scholarship from the Deutscher Akademischer Austansch dienst to C.-C. L., a Deutsche Forschungsgemeinschaft grant to P. J. (SFB 505/C5), and the Alexander-von-Humboldt foundation.
REFERENCES
- An WF, Bowlby MR, Betty M, Cao J, Ling H-P, Mendoza G, Hinson JW, Mattsson KI, Strassle BW, Trimmer JS, Rhodes KJ. Modulation of A-type potassium channels by a family of calcium sensors. Nature. 2000;403:553–556. doi: 10.1038/35000592. [DOI] [PubMed] [Google Scholar]
- Atzori M, Lau D, Tansey EP, Chow A, Ozaita A, Rudy B, McBain CJ. H2 histamine receptor-phosphorylation of Kv3. 2 modulates interneuron fast spiking. Nature Neuroscience. 2000;3:791–798. doi: 10.1038/77693. [DOI] [PubMed] [Google Scholar]
- Baranauskas G, Tkatch T, Surmeier DJ. Delayed rectifier currents in rat globus pallidus neurons are attributable to Kv2. 1 and Kv3.1/3.2 K+ channels. Journal of Neuroscience. 1999;19:6394–6404. doi: 10.1523/JNEUROSCI.19-15-06394.1999. [DOI] [PMC free article] [PubMed] [Google Scholar]
- Bekkers JM, Delaney AJ. Modulation of excitability by α-dendrotoxin-sensitive potassium channels in neocortical pyramidal neurons. Journal of Neuroscience. 2001;21:6553–6560. doi: 10.1523/JNEUROSCI.21-17-06553.2001. [DOI] [PMC free article] [PubMed] [Google Scholar]
- Bliss TVP, Collingridge GL. A synaptic model of memory: long-term potentiation in the hippocampus. Nature. 1993;361:31–39. doi: 10.1038/361031a0. [DOI] [PubMed] [Google Scholar]
- Chow A, Erisir A, Farb C, Nadal MS, Ozaita A, Lau D, Welker E, Rudy B. K+ channel expression distinguishes subpopulations of parvalbumin- and somatostatin-containing neocortical neurons. Journal of Neuroscience. 1999;19:9332–9345. doi: 10.1523/JNEUROSCI.19-21-09332.1999. [DOI] [PMC free article] [PubMed] [Google Scholar]
- Cobb SR, Buhl EH, Halasy K, Paulsen O, Somogyi P. Synchronization of neuronal activity in hippocampus by individual GABAergic interneurons. Nature. 1995;378:75–78. doi: 10.1038/378075a0. [DOI] [PubMed] [Google Scholar]
- Coetzee WA, Amarillo Y, Chiu J, Chow A, Lau D, Mccormack T, Moreno H, Nadal MS, Ozaita A, Pountney D, Saganich M, Vega-Saenz de miera E, Rudy B. Molecular diversity of K+ channels. Annals of the New York Academy of Sciences. 1999;868:233–285. doi: 10.1111/j.1749-6632.1999.tb11293.x. [DOI] [PubMed] [Google Scholar]
- Connor JA, Stevens CF. Prediction of repetitive firing behaviour from voltage clamp data on an isolated neurone soma. Journal of Physiology. 1971;213:31–53. doi: 10.1113/jphysiol.1971.sp009366. [DOI] [PMC free article] [PubMed] [Google Scholar]
- Connors BW, Gutnick MJ. Intrinsic firing patterns of diverse neocortical neurons. Trends in Neuroscience. 1990;13:99–104. doi: 10.1016/0166-2236(90)90185-d. [DOI] [PubMed] [Google Scholar]
- Cossart R, Dinocourt C, Hirsch JC, Merchan-Perez A, De Felipe J, Ben-Ari Y, Esclapez M, Bernard C. Dendritic but not somatic GABAergic inhibition is decreased in experimental epilepsy. Nature Neuroscience. 2001;4:52–62. doi: 10.1038/82900. [DOI] [PubMed] [Google Scholar]
- Csicsvari J, Hirase H, Czurkó A, Mamiya A, Buzsuzsákiaacute;ki G. Oscillatory coupling of hippocampal pyramidal cells and interneurons in the behaving rat. Journal of Neuroscience. 1999;19:274–287. doi: 10.1523/JNEUROSCI.19-01-00274.1999. [DOI] [PMC free article] [PubMed] [Google Scholar]
- Du J, Haak LL, Phillips-Tansey E, Russell JT, McBain CJ. Frequency-dependent regulation of rat hippocampal somato-dendritic excitability by the K+ channel subunit Kv2. 1. Journal of Physiology. 2000;522:19–31. doi: 10.1111/j.1469-7793.2000.t01-2-00019.xm. [DOI] [PMC free article] [PubMed] [Google Scholar]
- Du J, Zhang L, Weiser M, Rudy B, McBain CJ. Developmental expression and functional characterization of the potassium-channel subunit Kv3. 1b in parvalbumin-containing interneurons of the rat hippocampus. Journal of Neuroscience. 1996;16:506–518. doi: 10.1523/JNEUROSCI.16-02-00506.1996. [DOI] [PMC free article] [PubMed] [Google Scholar]
- Efron B, Tibshirani RJ. An introduction to the bootstrap. London, UK: Chapman & Hall/CRC; 1998. [Google Scholar]
- Erisir A, Lau D, Rudy B, Leonard CS. Function of specific K+ channels in sustained high-frequency firing of fast-spiking neocortical interneurons. Journal of Neurophysiology. 1999;82:2476–2489. doi: 10.1152/jn.1999.82.5.2476. [DOI] [PubMed] [Google Scholar]
- Freund TF, Buzsuzsákiaacute;ki G. Interneurons of the hippocampus. Hippocampus. 1996;6:347–470. doi: 10.1002/(SICI)1098-1063(1996)6:4<347::AID-HIPO1>3.0.CO;2-I. [DOI] [PubMed] [Google Scholar]
- Galarreta M, Hestrin S. Frequency-dependent synaptic depression and the balance of excitation and inhibition in the neocortex. Nature Neuroscience. 1998;1:587–594. doi: 10.1038/2822. [DOI] [PubMed] [Google Scholar]
- Grissmer S, Nguyen AN, Aiyar J, Hanson DC, Mather RJ, Gutman GA, Karmilowicz MJ, Auperin DD, Chandy KG. Pharmacological characterization of five cloned voltage-gated K+ channels, types Kv1. 1, 1.2, 1.3, 1.5, and 3.1, stably expressed in mammalian cell lines. Molecular Pharmacology. 1994;45:1227–1234. [PubMed] [Google Scholar]
- Han Z-S, Buhl EH, Lörincziouml;rinczi Z, Somogyi P. A high degree of spatial selectivity in the axonal and dendritic domains of physiologically identified local-circuit neurons in the dentate gyrus of the rat hippocampus. European Journal of Neuroscience. 1993;5:395–410. doi: 10.1111/j.1460-9568.1993.tb00507.x. [DOI] [PubMed] [Google Scholar]
- Hernández-Pineda R, Chow A, Amarillo Y, Moreno H, Saganich M, Vega-Saenz de Miera E, Hernernándezaacute;ndez-Cruz A, Rudy B. Kv3. 1-Kv3.2 channels underlie a high-voltage-activating component of the delayed rectifier K+ current in projecting neurons from the globus pallidus. Journal of Neurophysiology. 1999;82:1512–1528. doi: 10.1152/jn.1999.82.3.1512. [DOI] [PubMed] [Google Scholar]
- Hille B. Ionic channels of excitable membranes. Sunderland, MA, USA: Sinauer; 1992. [Google Scholar]
- Katona I, Acscsádyaacute;dy L, Freund TF. Postsynaptic targets of somatostatin-immunoreactive interneurons in the rat hippocampus. Neuroscience. 1999;88:37–55. doi: 10.1016/s0306-4522(98)00302-9. [DOI] [PubMed] [Google Scholar]
- Kawaguchi Y, Kubota Y. GABAergic cell subtypes and their synaptic connections in rat frontal cortex. Cerebral Cortex. 1997;7:476–486. doi: 10.1093/cercor/7.6.476. [DOI] [PubMed] [Google Scholar]
- Kirsch GE, Drewe JA. Gating-dependent mechanism of 4-aminopyridine block in two related potassium channels. Journal of General Physiology. 1993;102:797–816. doi: 10.1085/jgp.102.5.797. [DOI] [PMC free article] [PubMed] [Google Scholar]
- Klemic KG, Kirsch GE, Jones SW. U-type inactivation of Kv3. 1 and Shaker potassium channels. Biophysical Journal. 2001;81:814–826. doi: 10.1016/S0006-3495(01)75743-8. [DOI] [PMC free article] [PubMed] [Google Scholar]
- Kraushaar U, Jonas P. Efficacy and stability of quantal GABA release at a hippocampal interneuron-principal neuron synapse. Journal of Neuroscience. 2000;20:5594–5607. doi: 10.1523/JNEUROSCI.20-15-05594.2000. [DOI] [PMC free article] [PubMed] [Google Scholar]
- Lau D, Vega-Saenz de Miera E, Contreras D, Ozaita A, Harvey M, Chow A, Noebels JL, Paylor R, Morgan JI, Leonard CS, Rudy B. Impaired fast-spiking, suppressed cortical inhibition, and increased susceptibility to seizures in mice lacking Kv3. 2 K+ channel proteins. Journal of Neuroscience. 2000;20:9071–9085. doi: 10.1523/JNEUROSCI.20-24-09071.2000. [DOI] [PMC free article] [PubMed] [Google Scholar]
- Levey AI, Edmunds SM, Koliatsos V, Wiley RG, Heilman CJ. Expression of m1-m4 muscarinic acetylcholine receptor proteins in rat hippocampus and regulation by cholinergic innervation. Journal of Neuroscience. 1995;15:4077–4092. doi: 10.1523/JNEUROSCI.15-05-04077.1995. [DOI] [PMC free article] [PubMed] [Google Scholar]
- Lien C-C, Martina M, Jonas P. Functional identification and modulation of K+ channels in oriens-alveus interneurons of rat hippocampus. Pflügers Archiv. 2001;441:R181. [Google Scholar]
- McBain CJ, Fisahn A. Interneurons unbound. Nature Reviews. Neuroscience. 2001;2:11–23. doi: 10.1038/35049047. [DOI] [PubMed] [Google Scholar]
- Maccaferri G, McBain CJ. Long-term potentiation in distinct subtypes of hippocampal nonpyramidal neurons. Journal of Neuroscience. 1996a;16:5334–5343. doi: 10.1523/JNEUROSCI.16-17-05334.1996. [DOI] [PMC free article] [PubMed] [Google Scholar]
- Maccaferri G, McBain CJ. The hyperpolarization-activated current (Ih) and its contribution to pacemaker activity in rat CA1 hippocampal stratum oriens-alveus interneurones. Journal of Physiology. 1996b;497:119–130. doi: 10.1113/jphysiol.1996.sp021754. [DOI] [PMC free article] [PubMed] [Google Scholar]
- Maccaferri G, Roberts JDB, Szucs P, Cottingham CA, Somogyi P. Cell surface domain specific postsynaptic currents evoked by identified GABAergic neurones in rat hippocampus in vitro. Journal of Physiology. 2000;524:91–116. doi: 10.1111/j.1469-7793.2000.t01-3-00091.x. [DOI] [PMC free article] [PubMed] [Google Scholar]
- Macica CM, Kaczmarek LK. Casein kinase 2 determines the voltage dependence of the Kv3. 1 channel in auditory neurons and transfected cells. Journal of Neuroscience. 2001;21:1160–1168. doi: 10.1523/JNEUROSCI.21-04-01160.2001. [DOI] [PMC free article] [PubMed] [Google Scholar]
- Martina M, Jonas P. Functional differences in Na+ channel gating between fast-spiking interneurones and principal neurones of rat hippocampus. Journal of Physiology. 1997;505:593–603. doi: 10.1111/j.1469-7793.1997.593ba.x. [DOI] [PMC free article] [PubMed] [Google Scholar]
- Martina M, Schultz JH, Ehmke H, Monyer H, Jonas P. Functional and molecular differences between voltage-gated K+ channels of fast-spiking interneurons and pyramidal neurons of rat hippocampus. Journal of Neuroscience. 1998;18:8111–8125. doi: 10.1523/JNEUROSCI.18-20-08111.1998. [DOI] [PMC free article] [PubMed] [Google Scholar]
- Martina M, Vida I, Jonas P. Distal initiation and active propagation of action potentials in interneuron dendrites. Science. 2000;287:295–300. doi: 10.1126/science.287.5451.295. [DOI] [PubMed] [Google Scholar]
- Miles R, Tóth K, Gulyás AI, Hájosaacute;jos N, Freund TF. Differences between somatic and dendritic inhibition in the hippocampus. Neuron. 1996;16:815–823. doi: 10.1016/s0896-6273(00)80101-4. [DOI] [PubMed] [Google Scholar]
- Monyer H, Jonas P. Polymerase chain reaction analysis of ion channel expression in single neurons of brain slices. In: Sakmann B, Neher E, editors. Single-Channel Recording. NY, USA: Plenum Press; 1995. pp. 357–373. [Google Scholar]
- Moreno H, Kentros C, Bueno E, Weiser M, Hernandez A, Vega-Saenz de Miera E, Ponce A, Thornhill W, Rudy B. Thalamocortical projections have a K+ channel that is phosphorylated and modulated by cAMP-dependent protein kinase. Journal of Neuroscience. 1995;15:5486–5501. doi: 10.1523/JNEUROSCI.15-08-05486.1995. [DOI] [PMC free article] [PubMed] [Google Scholar]
- Moreno H, Vega-Saenz de Miera E, Nadal MS, Amarillo Y, Rudy B. Modulation of Kv3 potassium channels expressed in CHO cells by a nitric oxide-activated phosphatase. Journal of Physiology. 2001;530:345–358. doi: 10.1111/j.1469-7793.2001.0345k.x. [DOI] [PMC free article] [PubMed] [Google Scholar]
- Nicoll RA. The coupling of neurotransmitter receptors to ion channels in the brain. Science. 1988;241:545–551. doi: 10.1126/science.2456612. [DOI] [PubMed] [Google Scholar]
- Rettig J, Wunder F, Stocker M, Lichtinghagen R, Mastiaux F, Beckh S, Kues W, Pedarzani P, Schrchröterouml;ter KH, Ruppersberg JP, Veh R, Pongs O. Characterization of a Shaw-related potassium channel family in rat brain. EMBO Journal. 1992;11:2473–2486. doi: 10.1002/j.1460-2075.1992.tb05312.x. [DOI] [PMC free article] [PubMed] [Google Scholar]
- Rudy B, McBain CJ. Kv3 channels: voltage-gated K+ channels designed for high-frequency repetitive firing. Trends in Neurosciences. 2001;24:517–526. doi: 10.1016/s0166-2236(00)01892-0. [DOI] [PubMed] [Google Scholar]
- Ruppersberg JP, Schrchröterouml;ter KH, Sakmann B, Stocker M, Sewing S, Pongs O. Heteromultimeric channels formed by rat brain potassium-channel proteins. Nature. 1990;345:535–537. doi: 10.1038/345535a0. [DOI] [PubMed] [Google Scholar]
- Sererôdioocirc;dio P, Rudy B. Differential expression of Kv4 K+ channel subunits mediating subthreshold transient K+ (A-type) currents in rat brain. Journal of Neurophysiology. 1998;79:1081–1091. doi: 10.1152/jn.1998.79.2.1081. [DOI] [PubMed] [Google Scholar]
- Sik A, Penttonen M, Ylinen A, Buzsuzsákiaacute;ki G. Hippocampal CA1 interneurons: an in vivo intracellular labeling study. Journal of Neuroscience. 1995;15:6651–6665. doi: 10.1523/JNEUROSCI.15-10-06651.1995. [DOI] [PMC free article] [PubMed] [Google Scholar]
- Southan AP, Robertson B. Electrophysiological characterization of voltage-gated K+ currents in cerebellar basket and Purkinje cells: Kv1 and Kv3 channel subfamilies are present in basket cell nerve terminals. Journal of Neuroscience. 2000;20:114–122. doi: 10.1523/JNEUROSCI.20-01-00114.2000. [DOI] [PMC free article] [PubMed] [Google Scholar]
- Storm JF. Potassium currents in hippocampal pyramidal cells. Progress in Brain Research. 1990;83:161–187. doi: 10.1016/s0079-6123(08)61248-0. [DOI] [PubMed] [Google Scholar]
- Stuart GJ, Dodt H-U, Sakmann B. Patch-clamp recordings from the soma and dendrites of neurons in brain slices using infrared video microscopy. Pflügers Archiv. 1993;423:511–518. doi: 10.1007/BF00374949. [DOI] [PubMed] [Google Scholar]
- Wang L-Y, Gan L, Forsythe ID, Kaczmarek LK. Contribution of the Kv3. 1 potassium channel to high-frequency firing in mouse auditory neurones. Journal of Physiology. 1998;509:183–194. doi: 10.1111/j.1469-7793.1998.183bo.x. [DOI] [PMC free article] [PubMed] [Google Scholar]
- Weiser M, Bueno E, Sekirnjak C, Martone ME, Baker H, Hillman D, Chen S, Thornhill W, Ellisman M, Rudy B. The potassium channel subunit KV3. 1b is localized to somatic and axonal membranes of specific populations of CNS neurons. Journal of Neuroscience. 1995;15:4298–4314. doi: 10.1523/JNEUROSCI.15-06-04298.1995. [DOI] [PMC free article] [PubMed] [Google Scholar]
- Wigmore MA, Lacey MG. A Kv3-like persistent, outwardly rectifying, Cs+-permeable, K+ current in rat subthalamic nucleus neurons. Journal of Physiology. 2000;527:493–506. doi: 10.1111/j.1469-7793.2000.t01-1-00493.x. [DOI] [PMC free article] [PubMed] [Google Scholar]
- Zhang L, McBain CJ. Voltage-gated potassium currents in stratum oriens-alveus inhibitory neurones of the rat CA1 hippocampus. Journal of Physiology. 1995a;488:647–660. doi: 10.1113/jphysiol.1995.sp020997. [DOI] [PMC free article] [PubMed] [Google Scholar]
- Zhang L, McBain CJ. Potassium conductances underlying repolarization and afterhyperpolarization in rat CA1 hippocampal interneurones. Journal of Physiology. 1995b;488:661–672. doi: 10.1113/jphysiol.1995.sp020998. [DOI] [PMC free article] [PubMed] [Google Scholar]


