

Abstract
Retinal ganglion cells (RGCs) are the output neurons of the retina, sending their signals via the optic nerve to many different targets in the thalamus and brainstem. These cells are divisible into more than a dozen types, differing in receptive field properties and morphology. Light responses of individual RGCs are in large part determined by the exact nature of the retinal synaptic network in which they participate. Synaptic inputs, however, are greatly influenced by the intrinsic membrane properties of each cell. While it has been demonstrated clearly that RGCs vary in their intrinsic properties, it remains unclear whether this variation is systematically related to RGC type. To learn whether membrane properties contribute to the functional differentiation of RGC types, we made whole-cell current clamp recordings of RGC responses to injected current of identified cat RGCs. The data collected demonstrated that RGC types clearly differed from one another in their intrinsic properties. One of the most striking differences we observed was that individual cell types had membrane time constants that varied widely from approximately 4 ms (alpha cells) to more than 80 ms (zeta cells). Perhaps not surprisingly, we also observed that RGCs varied greatly in their maximum spike frequencies (kappa cells 48 Hz-alpha cells 262 Hz) and sustained spike frequencies (kappa cells 23 Hz-alpha cells 67 Hz). Interestingly, however, most RGC types exhibited similar amounts of spike frequency adaptation. Finally, RGC types also differed in their responses to injection of hyperpolarizing current. Most cell types exhibited anomalous rectification in response to sufficiently strong hyperpolarization, although alpha and beta RGCs showed only minimal, if any, rectification under similar conditions. The differences we observed in RGC intrinsic properties were striking and robust. Such differences are certain to affect how each type responds to synaptic input and may help tune each cell type appropriately for their individual roles in visual processing.
Current theories of visual processing suggest that our rich and varied perception of the visual world is mediated through several parallel processing pathways. Each pathway is thought to process different attributes of a visual scene. Consider the image of a brilliant red cardinal expertly manoeuvring through a copse of white birch trees. While one pathway of visual information may be concerned with processing the redness of the cardinal or the texture of the birch bark, another pathway encodes the swift movement of the cardinal, permitting the viewer to track the bird through the trees.
Such parallel representations begin to diverge from one another within the retina itself and are relayed to particular brain nuclei by specific types of retinal ganglion cells (RGCs). Ganglion cell types can be differentiated from one another on the basis of morphological and physiological criteria (for review see Cook, 1997; see also Rowe & Stone, 1977; Rodieck & Brening, 1983; Stone, 1983; Wässle & Boycott, 1991; Rodieck, 1998; Dacey, 1999). Studies in the cat retina suggest there may be as many as 20 such RGC types (Enroth-Cugell & Robson, 1966; Boycott & Wässle, 1974; Cleland & Levick, 1974a,b; Stone & Fukuda, 1974; Leventhal et al. 1980; Kolb et al. 1981; Dacey, 1989; Wässle & Boycott, 1991; Pu et al. 1994; Berson et al. 1997, 1998, 1999a, 1999b; Isayama et al. 1999, 2000).
Past attempts to understand the mechanisms responsible for the functional differences among RGC types have emphasized differences in their synaptic inputs. For example, RGC types with ‘complex’ receptive field features appear to receive larger proportions of their synaptic input from amacrine cells than do RGCs with ‘simple’ response properties (West & Dowling, 1972; Watanabe et al. 1985; McGuire et al. 1986; Freed & Sterling, 1988; Weber et al. 1991). Differences among RGC types in receptive field size are correlated with differences in the horizontal extent of their dendritic profile and thus in the spatial convergence of bipolar cell input (e.g. Peichl & Wässle, 1983; Freed & Sterling, 1988; Yang & Masland, 1992). Likewise, differences in centre type are attributable to different levels of dendritic stratification in the inner plexiform layer (IPL) (Famiglietti & Kolb, 1976). Stratification also constrains which of about 10 bipolar cell types and more than 20 amacrine types may synaptically engage a RGC type (Kolb et al. 1981; McGuire et al. 1984; Pourcho & Goebel, 1987; Cohen & Sterling, 1990; Vaney, 1990; Wässle & Boycott, 1991; Euler & Wässle, 1995; MacNeil & Masland, 1998; MacNeil et al. 1999).
Although differences in synaptic networks clearly contribute to the functional differentiation among RGC types, intrinsic electrical properties may also play a significant role. There is ample evidence for heterogeneity among RGCs in intrinsic membrane properties (Lipton & Tauck, 1987; Ishida, 1991; Sucher & Lipton, 1992; Wang et al. 1997; Robinson & Wang, 1998). For example, RGCs exhibit marked variability in the number, density and kinetics of voltage-activated Na+ currents (INa) (Kaneda & Kaneko, 1991; Skaliora et al. 1993, 1995; Guenther et al. 1999); voltage- and/or calcium-activated K+ currents (IK, IA, IB, IK(Ca), ILeak) (Lukasiewicz & Werblin, 1988; Ishida, 1991; Skaliora et al. 1993, 1995; Tabata & Ishida, 1996; Wang et al. 1998, 1999; Guenther et al. 1999); the hyperpolarization-activated cation current (Ih) (Tabata & Ishida, 1996); and voltage-activated Ca2+ currents (ICa) (Kaneda & Kaneko, 1991; Huang & Robinson, 1998; Schmid & Guenther, 1998; Guenther et al. 1999). Because such differences in membrane properties undoubtedly shape ganglion cell responses to synaptic input, they may help to explain the functional differences among RGC types. There is little direct evidence on this issue, however, because most studies of RGC intrinsic physiology have been conducted in retinal slices or dissociated cells, in which morphological and receptive field types are difficult to identify.
New methods for whole-cell recording in intact retina (for example, see Taylor & Wässle, 1995; Robinson & Chalupa, 1997) provide a means of directly correlating intrinsic electrical behaviour and cell morphology. We have applied these methods to RGCs in cat retina, in which the identities and receptive field properties of a large number of morphological types have been established (see citations above and Cleland et al. 1975; Peichl & Wässle, 1981; Saito, 1983; Fukuda et al. 1984; Stanford, 1987a,b; Pu et al. 1994; O'Brien et al. 1999). Our results demonstrate that there are significant differences among morphological types of RGCs in intrinsic membrane properties.
Some of these data have been presented previously in abstract form (O'Brien et al. 1998).
METHODS
Data were obtained from 43 pigmented domestic cats ranging in age from 4 months to adulthood. Methods conformed with NIH guidelines and were approved by Brown University's Institutional Animal Care and Use Committee. Animals were sedated with a mixture of acepromazine (2.5 mg i.m.) and atropine sulfate (0.14 mg i.m.), and deeply anaesthetized with Nembutal (50 mg i.v., supplemented as necessary). Animals were killed after eye removal by Nembutal overdose (> 100 mg i.v.) and decapitation. After hemisecting the eyes behind the ora serrata, we removed the vitreous body and cut each eyecup into four to six pieces. We typically removed the sclera and left the retina affixed to the pigment epithelium and choroid, although in early experiments we isolated the retina from the other layers of the globe. In either case, the tissue was mounted, ganglion cell layer up, on a coverslip coated with poly-L-lysine (1 mg ml−1, ∼185 kDa, Sigma, cat. no. P-1399). The coverslip served as the floor of a perfusion chamber (RC-26GLP, Warner, Hamden, CT, USA) through which oxygenated Ames medium (Sigma) was perfused (2–5 ml min−1) at room temperature. The chamber was mounted on the stage of an upright microscope (Olympus, BH-2) equipped with a ×40 water immersion lens (Nikon). The vital dye acridine orange (0.03 % in Ames medium) was added drop-wise to the chamber as needed to assist in visualization by epifluorescence of ganglion cell somata.
To obtain a whole-cell recording, we first made a small hole in the inner limiting membrane and optic fibre layer overlying a ganglion cell (Taylor & Wässle, 1995; Robinson & Chalupa, 1997). To do so, we used the microscope's 100-W halogen light source to trans-illuminate the tissue, advanced the tip of a patch pipette into the optic fibre layer and horizontally moved the pipette, the microscope stage, or both. Recordings were limited to cells exposed during the procedure that had smooth surfaces and agranular cytoplasm. To record primarily from ganglion cells rather than displaced amacrine cells, we avoided the smallest cells of the ganglion cell layer. The great majority of recorded cells lay > 2 mm from both the area centralis and optic disk. Data reported here were obtained during steady retinal illumination at scotopic or low mesopic levels.
For most recordings, the internal solution consisted of (mm): potassium gluconate 125, NaCl 5, KCl 4, EGTA 10, Hepes 10, ATP-Mg 4, phosphocreatine 7, GTP-Tris 0.3; 266 mosmol l−1; pH was adjusted to 7.3 with KOH. Lucifer Yellow (0.1 %) and either Neurobiotin (0.5 %) or biocytin (0.5 %) were included in the internal solution to enable later morphological analysis of cell type. Gluconate and Neurobiotin are known to block various voltage- and/or calcium-gated ion channels (Xi & Xu, 1996; Velumian et al. 1997; Schlosser et al. 1998). Thus, later recordings, primarily of beta and alpha cells, were made with an alternative internal solution consisting of (mm): potassium methane sulfonate (MeSO4) 130, NaCl 5, KCl 4, EGTA 0.5, Hepes 10, ATP-Mg 4, phosphocreatine 7, GTP-Tris 0.3; 280 mosmol l−1; pH 7.3; including Lucifer Yellow (0.1 %) and biocytin (0.5 %). Except where specifically noted, no statistical differences were detected between samples of single cell types recorded with these two pipette solutions; we therefore combined the results.
Physiological data collection and analysis
Whole-cell current clamp recordings from RGCs were obtained by standard procedures (Hamill et al. 1981) using an intracellular amplifier (DR-886, Neurodata/Cygnus Technologies, Delaware Water Gap, PA, USA). Initial pipette resistance ranged between 3 and 7 MΩ. The pipette voltage in the bath was nulled prior to recording. It was also checked immediately after each recording after clearing the pipette tip with a pulse of pressure. If bath potentials before and after recording differed, the latter was taken as ground potential. After obtaining a gigaohm seal and rupturing the cellular membrane, the pipette series resistance was measured and compensated with the bridge balance circuit of the amplifier. Resting potentials were corrected for the change in liquid junction potential that occurs upon break-in and cell dialysis (-13 mV; Neher, 1992). No capacitance compensation was employed. Physiological data were digitized at 10 or 20 kHz (AT-MI0-16E-10, National Instruments; stored in digital format and analysed off-line with custom software developed using Labview 5.0 (National Instruments, Austin, TX, USA).
Cells were excluded from analysis if they exhibited marked instability of resting potential (Vrest) or if their action potentials did not overshoot 0 mV. The great majority of recorded RGCs had resting potentials of at least −60 mV, but cells with slightly more depolarized Vrest were not excluded if other criteria of cellular health were met. We tested each cell with a series of depolarizing and hyperpolarizing current steps. For most cells, the largest depolarizing current step drove the cell into spike block and the largest hyperpolarizing step yielded a membrane potential (Vm) of approximately −110 mV. Spike widths were measured as the full width at half height. Widths for individual cells represent the average of 35–50 such measurements. To minimize the influence of high spiking frequency on spike width, we restricted our analysis to spontaneous spikes or those evoked by just suprathreshold current steps. We calculated the input resistance (RN) for each cell according to Ohm's law (V =IR) from the change in steady-state membrane voltage produced by current injections of known amplitude. We used small-amplitude hyperpolarizing currents (ΔVm ∼5 mV) to avoid triggering action potentials and other non-linear membrane properties. Membrane time constant (τm) was estimated by the method of ‘peeling’ (Johnston & Wu, 1997). Good fits were determined by limiting the root mean square variation of the fit to less than 0.1 ms. If this criterion could not be achieved, the data were excluded from the analysis.
To test whether individual functional measures were statistically related to morphological type, we used (unless otherwise noted) the non-parametric Kruskal-Wallis test for multiple independent samples. When a significant relationship was detected, a post hoc test (Conover, 1980) was applied to determine which pairs of types were significantly different from one another. Error measurements are reported as s.e.m. unless otherwise noted.
Immunocytochemistry and morphological identification
Following recordings, the tissue was removed from the chamber, mounted onto nylon filter paper (cat. no. R02SP04700, Osmonics, Minnetonka, MN, USA) fixed for 2–3 h in buffered 4 % paraformaldehyde, and stored for up to 2 weeks in 0.1 m phosphate buffered saline (PBS; pH 7.4) at 4 °C. In most cases, intracellular staining was revealed by Lucifer Yellow immunohistochemistry (Pu & Berson, 1992). In some experiments, the tissue was processed for Neurobiotin or biocytin by immersion in 0.2 % Triton X-100, 0.5 % streptavidin conjugated to Cy-3 (Jackson Immunoresearch, West Grove, PA, USA) in PBS for 3–4 days at 4 °C. Tissue was washed thoroughly in PBS, mounted in dilute PBS onto unsubbed slides and coverslipped in 60 % glycerol. Cells were examined with transmitted or epifluorescence illumination and selected cells were drawn using a camera lucida.
Cells included in this analysis were ganglion cells rather than displaced amacrine cells. This was immediately apparent for many cells because they had an axon that entered the optic fibre layer. Other cells lacked a discernable axon, presumably having lost it during cell exposure, but were virtually certain to be ganglion cells because their somata were larger than those of amacrine cells, they resembled an established cat RGC type, and they lacked axonal branches in the IPL and other features typical of displaced amacrine cells. Ganglion cells were classified morphologically on the basis of soma size, dendritic field size and structure, dendritic stratification and retinal location (for details, see Berson et al. 1998). The great majority of recorded RGCs could be recognized as members of one of the dozen established types: ON or OFF alpha and ON or OFF beta (Boycott & Wässle, 1974; Kolb et al. 1981); delta (Boycott & Wässle, 1974; Wässle et al. 1987; Dacey, 1989); epsilon (Leventhal et al. 1980; Pu et al. 1994); zeta (Berson et al. 1998); eta (Berson et al. 1999b); theta (Isayama et al. 2000); iota (Berson et al. 1997); kappa (Berson et al. 1999a); or lambda (Isayama et al. 1999). The remaining cells have been excluded from this report.
RESULTS
We recorded from 154 cells belonging to 12 morphological types of RGC. Our sample included alpha (n = 26), beta (n = 51), delta (n = 18) epsilon (n = 6), zeta (n = 3), eta (n = 28), theta (n = 3), iota (n = 5), kappa (n = 2) and lambda cells (n = 9). No significant differences were observed between identified ON and OFF subtypes of alpha cells (ON, n = 10; OFF, n = 7) or ON and OFF beta cells (ON, n = 15; OFF, n = 7) (Student's t test). We therefore grouped these ON and OFF subtypes together for further statistical comparisons with the remaining RGC classes. Drawings of representative recorded cells of each type are presented in Fig. 1, which shows the marked differences among most types in dendritic structure. For example, some cells have wavy, densely branching, extensively overlapping dendrites (beta, theta and iota), while others have sparse dendritic arbors with more regular branching patterns (alpha, delta, epsilon and kappa). Though not evident in Fig. 1, there were also marked differences among types in the laminar stratification of dendrites within the IPL. Some types stratified exclusively in sublamina a (OFF alpha, OFF beta, delta and eta), others only in sublamina b (ON alpha, ON beta, epsilon and kappa) and still others in both sublayers, either by stratifying narrowly at the a-b sublaminar border (zeta and lambda) or through bistratification, with one arbor in each sublayer (theta and iota).
Figure 1. Retinal ganglion cell (RGC) types.
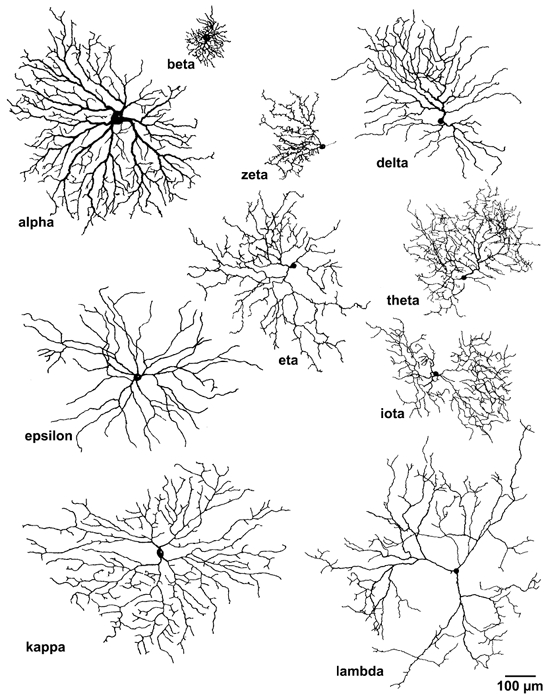
Camera lucida drawings of cat retinal ganglion cells (RGCs) recorded by the whole-cell method. One representative recorded cell of each morphological type is shown as viewed in the wholemount (en face). Scale bar applies to all cells. Recordings from each of these cells appear in Fig. 3.
Resting membrane potential
Resting membrane potential (Vrest) ranged from −57 to −89 mV, values comparable with or lower than those observed in earlier studies of RGCs using similar methods (range, −53 to −62 mV; Lipton & Tauck, 1987; Skaliora et al. 1993; Robinson & Chalupa, 1997; Wang et al. 1997, 1998, 1999; Cohen, 1998; Guenther et al. 1999), although many of these studies did not correct for liquid junction potential. Average Vrest differed among morphological types, ranging from −66 mV for zeta cells to −75 mV for beta cells (Fig. 2A and Table 1). The influence of morphological type on Vrest was statistically significant (Kruskal-Wallis H (9, 122) = 38.605, P < 0.05). According to post hoc statistical analysis (Conover, 1980), the most significant differences in Vrest were those between beta cells and other types, although several other pairwise comparisons reached statistical significance (Table 2).
Figure 2. Statistical analysis of intrinsic membrane properties.
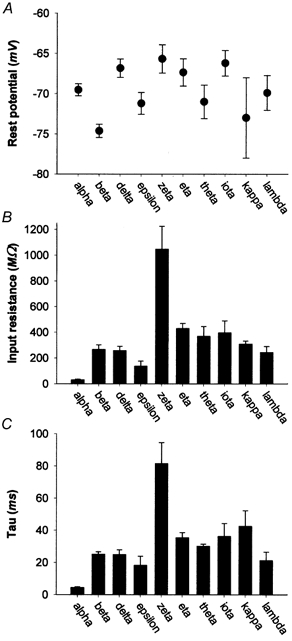
Comparison of morphologically identified types of cat RGCs on three intrinsic membrane properties. A, average resting membrane potential (Vrest). B, average input resistance (RN). C, average membrane time constant (τm). Error bars represent s.e.m. in this and all subsequent figures except as specified.
Table 1.
Physiological properties of cat retinal ganglion cells (RGCs)
| Cell type | Vrest | RN (MΩ) | τm (ms) | Spike width (ms) | Max freq* (Hz) | SS* (Hz) | FA index | Sag (mV) |
|---|---|---|---|---|---|---|---|---|
| alpha | −69.5 ± 0.8 | 31.3 ± 4.8 | 4.5 ± 0.6 | 0.6 ± 0.03 | 262 ± 63.9 | 67 ± 36.9 | 0.77 ± 0.04 | 0.77 ± 0.22 |
| beta | −74.6 ± 0.8 | 267.2 ± 35.3 | 25.2 ± 1.5 | 0.8 ± 0.02 | 152.1 ± 51.9 | 59.7 ± 18.2 | 0.57 ± 0.03 | 0.22 ± 0.08 |
| delta | −66.8 ± 1.2 | 257.8 ± 33.3 | 24.9 ± 3 | 1.34 ± 0.15 | 124.9 ± 60.6 | 43.1 ± 25.4 | 0.65 ± 0.05 | 1.57 ± 0.85 |
| epsilon | −71.2 ± 1.4 | 137.3 ± 39.5 | 18.3 ± 5.8 | 1.36 ± 0.3 | 132.2 ± 64.2 | 41.6 ± 18.7 | 0.69 ± 0.05 | 0.50 ± 0.21 |
| zeta | −65.7 ± 1.8 | 1048 ± 176.7 | 81.6 ± 13 | 3.04 ± 0.42 | 80.5 ± 42.1 | 26.5 ± 10.2 | 0.65 ± 0.03 | 0.50 ± 0.50 |
| eta | −67.4 ± 1.7 | 429.4 ± 40.5 | 35.4 ± 3.2 | 2.12 ± 0.14 | 75.8 ± 38.6 | 30.9 ± 12.7 | 0.58 ± 0.03 | 3.07 ± 0.54 |
| theta | −71 ± 2.1 | 369.3 ± 75.9 | 30.2 ± 1.3 | 2.42 ± 0.43 | 99.3 ± 35.1 | 28.4 ± 2.7 | 0.75 ± 0.07 | 6.99 ± 0.50 |
| iota | −66.2 ± 1.6 | 396.2 ± 92 | 36.3 ± 8.1 | 2.39 ± 0.48 | 76.7 ± 22.3 | 25.5 ± 3.1 | 0.56 ± 0.06 | 5.98 ± 2.54 |
| kappa | −73 ± 5 | 308.5 ± 24.5 | 42.6 ± 9.7 | 3.2 ± 0.15 | 48 ± 4.7 | 22.6 ± 3.6 | 0.53 ± 0.03 | 4.96 ± 0.16 |
| lambda | −69.9 ± 2.2 | 243.8 ± 46.1 | 21.3 ± 5.3 | 1.81 ± 0.42 | 108.6 ± 39.1 | 33.1 ± 14.5 | 0.62 ± 0.05 | 1.68 ± 0.75 |
Values are means ±s.e.m. except those marked
which are means ±s.d. Vrest, resting membrane potential. RN, input resistance. τm, membrane time constant. SS, steady state. FA, frequency adaptation. See text forfurther details.
Table 2.
Pairwise statistical comparison of cell types on various measures of intrinsic behaviour
| Alpha | |||||||||
| Beta | V R t W A X G | Beta | |||||||
| Delta | V R t W A X S | V W A X S G | Delta | ||||||
| Epsilon | R t W X S | W S | V R | Epsilon | |||||
| Zeta | R t W X S | V R t W X S | R t W V | R t W X | Zeta | ||||
| Eta | R t W A X S G | V R t W X S G | R t W X S | R t W X G | R t | Eta | |||
| Theta | R t W X S G | R W A X S G | W G | R t W G | R t G | A G | Theta | ||
| Iota | R t W A X S G | V R t W X S G | R t W X S V | R t W X G S | Rt | — | A | Iota | |
| Kappa | R t W A X S G | t W X S G | t W X S | R t W X G S | R G | — | A | — | Kappa |
| Lambda | R t W A X S | V W X S G | — | — | R t W | R t W X | t W G | t | W X |
Intrinsic electrical properties on which pairs of morphological RGC types differed from one another statistically (P < 0.05; Kruskal-Wallis; pairwise comparisons; Conover, 1980). Each letter represents an intrinsic measure as follows: V, resting membrane potential (Vrest); R, input resistance (RN); t, time constant (τm); W, spike width; A, spike frequency adaptation index; X, maximum spike frequency; S, steady-state spike frequency; G, sag amplitude.
Input resistance
For most cell types, RN averaged between about 200 and 400 MΩ (Fig. 2B, Table 1). Within-type variability was substantial, and most pairs of cell types did not differ significantly from one another in RN. There were, however, two prominent exceptions. Input resistance was unusually high among zeta cells (mean = 1048 MΩ) and extremely low among alpha cells (mean = 31.3 MΩ). These two cell types differed statistically from each other on this measure as well as from all other types. Epsilon cells also had significantly lower input resistance than most other cell types (Table 2).
Time constant
The histogram plotting mean membrane time constant (τm) as a function of cell type (Fig. 2C) very closely resembled that of input resistance (Fig. 2B). For most RGC types, τm was between 20 and 50 ms, but zeta cells had much slower time constants while alpha cells had much faster ones (Table 1). The average τm of alpha cells is probably somewhat overestimated, because some alpha cells with extremely fast time constants had to be excluded from the data analysis due to poor fits with a single exponential (see Methods).
Spike width
We observed marked differences among cell types in the duration of action potentials. These differences were noticeable even in raw voltage records (Fig. 3, left column) and are quantified more clearly in the bar graph of Fig. 4A. Alpha, beta, delta and epsilon cells all exhibited relatively fast spikes (∼1 ms duration or less) and little or no increase in duration during high-frequency spike trains (Table 1). In contrast, the remaining cell types had broader spikes (∼2 ms or greater), which typically became even broader during repetitive firing.
Figure 3. RGC spiking behaviour.
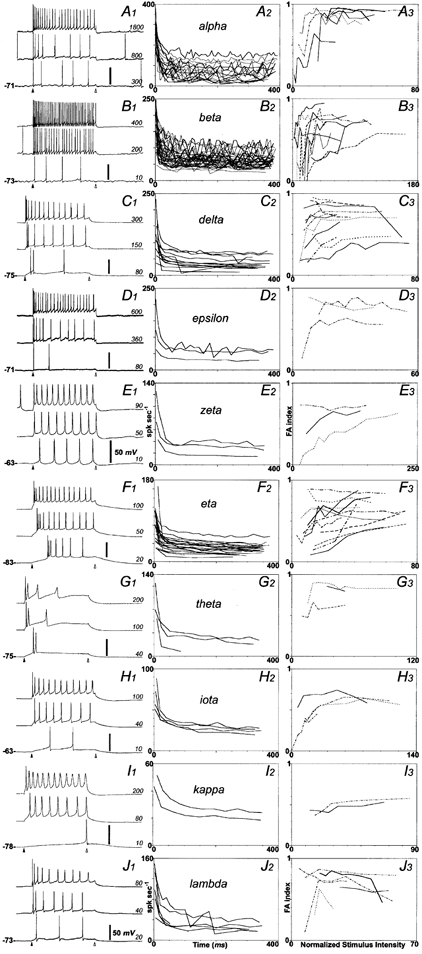
Properties of action potentials and spike trains evoked in cat RGCs by depolarizing current injection. Data in each row are drawn from a single cell type. A, alpha; B, beta; C, delta; D, epsilon; E, zeta; F, eta; G, theta; H, iota; I, kappa; J, lambda. Left column, voltage responses to depolarizing current steps for a single representative cell of each morphological type. Camera lucida drawings of these cells are shown in Fig. 1. For each cell, responses are shown for three different current intensities, identified in picoamps at the right of each trace and spanning the range from near threshold (bottom) to maximal (top). Arrowheads mark pulse onset (filled) and termination (open); pulse duration, 400 ms. Numbers at bottom left in each panel indicate Vrest. Voltage scale, 50 mV. Middle column, plots of instantaneous spike frequency over time for the strongest current intensity tested that did not produce depolarization block. Panels plot data for all cells of each morphological type. Right column, plots of an index of frequency adaptation (FA index; defined in the text) as a function of normalized stimulus intensity (see text for details). For non-alpha, non-beta cells, data are shown for every cell of each type. For alpha (A3) and beta cells (B3), we plotted data for a subset of cells chosen to reflect the range of patterns evident in the entire sample; data from the selected cells are indicated in A2 and B2 by heavier lines.
Figure 4. Statistical comparison of RGC spiking behaviour.
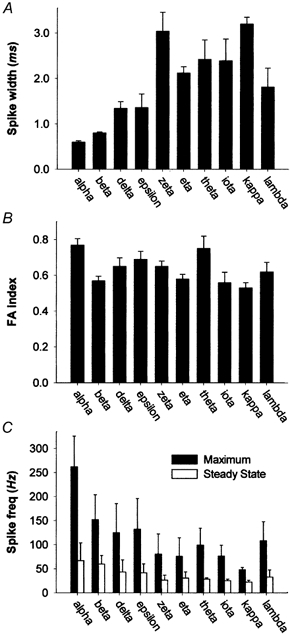
Bar graphs summarizing population data on average spiking behaviour of cat RGC types. A, spike width (full width at half height). B, frequency adaptation (FA) index. C, maximum (filled bars) and steady-state (open bars) evoked spike frequency. Data in B and C were derived from responses to the strongest depolarizing current step tested that did not induce spike block. Maximum frequency corresponds to the reciprocal of the first interspike interval. Steady-state frequency is the reciprocal of the mean of the last three interspike intervals during the pulse. Error bars represent s.e.m. in A and B and s.d. in C.
There were also subtler differences in spike width among the types with relatively fast action potentials (alpha, beta, delta and epsilon cells; Kruskal-Wallis H (9, 118) = 92.4, P < 0.05; Fig. 4A). Delta and epsilon cells had spike widths nearly twice those of alpha and beta cells. In addition, alpha cell spikes were significantly faster than those of beta cells. The magnitude of the difference in spike width between alpha cells and other types may actually be slightly underestimated here. Many of the alpha cell recordings were made with the MeSO4-based internal solution, and these yielded spikes significantly broader (mean = 0.69 ± 0.05 ms; n = 7) than those recorded using the gluconate internal solution (mean = 0.55 ± 0.03 ms; n = 12; Student's t test, t(18) = −2.467, P < 0.05). Except for beta cells, very few cells of the other types were recorded with the MeSO4 internal solution. Among beta cells, spikes tended to be slightly broader using gluconate than with MeSO4, but the difference was not significant (Student's t test, t(36) = 0.53, P > 0.05).
Peak firing rates and adaptation
Nearly all recorded RGCs were capable of repetitive spiking throughout a depolarizing current pulse. Of the few not capable of such repetitive spiking, none were alpha or beta cells, but otherwise there was no clear relationship to morphological type. However, there were substantial differences among RGC types in maximum spike rate and spike frequency adaptation during depolarizing current injections. The three traces in each of the left-most panels of Fig. 3 cover the range of spike frequencies observed for a representative cell of each type: the bottom trace in each panel shows the response to a just-suprathreshold step, and the top trace the response to the strongest current step tested that did not produce spike block. For the theta cell illustrated (Fig. 3G1), all suprathreshold current pulses elicited spike failure. Among alpha, beta and epsilon cells, we rarely observed such spike failure, even with the strongest current pulses used.
Cell types differed sharply in their highest steady-state firing frequency. This is evident in the middle panels of Fig. 3, which plot instantaneous spike rates over time during maximal depolarizing current steps. Average steady-state firing rates for each type are plotted in the bar graph of Fig. 4C (white bars). Most alpha, beta and epsilon cells were capable of maintaining firing rates well above 50 spikes s−1 (Table 1). By contrast, such high steady-state firing was less common among delta cells and virtually absent among the remaining cell types, which usually entered spike block for strong depolarizing pulses.
Cell types also differed in their peak spike frequency (Fig. 4C, filled bars), measured at the beginning of the response to maximal depolarizing steps (Fig. 4C and Table 1). These differences largely paralleled those in steady-state firing frequency. Alpha cells had maximum firing frequencies that dwarfed those of the remaining cell types (Kruskal-Wallis H (9, 113) = 66.5, P < 0.01), and beta, delta and epsilon cells exhibited higher peak rates on average than did the remaining types. These data may underestimate the peak and maintained spike rates of alpha and beta cells, which were almost never driven to spike block.
All RGCs tested showed some spike frequency adaptation during depolarizing current steps (Fig. 3, middle panels). To permit quantitative comparisons among types, an index of spike frequency adaptation (the FA index) was calculated for each cell using the formula:
where Finit is the initial spike frequency and Fss is the steady-state frequency, operationally defined as the average frequency calculated from the last three interspike intervals during the 400 ms pulse. Using this formula, a cell exhibiting no frequency adaptation (Finit = Fss) would have an FA index of zero while one showing very strong adaptation (Finit >> Fss) would have an FA index near 1.
The panels in the right column of Fig. 3 plot the FA index as a function of stimulus intensity for each cell type. To facilitate comparisons among cells, we normalized for input resistance (RN) by multiplying applied current by RN, yielding a metric of stimulus intensity with units in volts. Each line plots data for a single cell and, in general, all cells of each type are shown. For alpha and beta cells, however, so many cells were recorded that for clarity we have plotted data for a subset of cells selected to reflect the full range of profiles among the entire sample. Data from the alpha and beta cells included in this subset are indicated by the bold curves in Figs 3A2 and B2.
For the majority of cells, spike frequency adaptation increased with stimulus intensity. However, the slope of the relationship varied markedly from cell to cell, and for some cells it was essentially flat. There appeared to be differences among at least some types in the forms of these curves. For example, in beta cells, adaptation was typically small or absent for weak pulses, increased sharply as stimulus intensity rose, and rapidly reached a plateau. In eta cells, by contrast, even the weakest stimuli elicited some spike frequency adaptation, and adaptation increased gradually and modestly with stimulus amplitude.
For nearly all cells, the FA index reached an asymptote for strong current pulses. To compare these asymptotic values among cell types, we averaged the FA indices derived from responses to the two strongest stimuli for each cell and plotted the mean values (Table 1) for each type in the bar graph of Fig. 4B. There was a statistically significant relationship between cell type and FA index (Kruskal- Wallis H (9, 111) = 26.3, P < 0.05; Table 2). Alpha cells exhibited the highest mean FA indices, and were statistically different on this measure from all other types except epsilon, zeta and theta cells. By contrast, beta cells showed among the weakest adaptation, with FA indices significantly lower than alpha, delta and theta cells.
Alpha and beta cells recorded with MeSO4-based internal solutions had significantly lower peak and steady-state firing frequencies than those recorded with gluconate. Mean MeSO4/gluconate rates in hertz for alpha cells were: peak = 205.3/295.1 (t(17) = 4.007; P < 0.05); steady-state = 45.0/79.9 (t(17) = 2.193; P < 0.05). Mean MeSO4/gluconate rates in hertz for beta cells were: peak = 136.8/176.9 (t(31) = 2.339; P < 0.05); steady-state = 50.9/75.2 (t(31) = 5.128; P < 0.05). Because nearly all of the cells recorded with the MeSO4 internal solution were alpha or beta cells, our data may slightly underestimate the degree to which alpha and beta cells have higher spike rates than the other cell types. Both peak and steady-state firing rates were depressed under MeSO4, so the FA index was not significantly different under these recording conditions from when using gluconate for either cell type. Mean MeSO4/gluconate FA indices were for alpha cells, 0.73/0.79 (t(17) = 0.798; P > 0.05); and for beta cells, 0.54/0.58 (t(31) = −0.814; P > 0.05).
Anomalous rectification
Anomalous rectification is characterized by a gradual decay or ‘sag’ in the membrane hyperpolarization evoked by negative current injection and an overshoot of the resting potential at the end of the current pulse (reviewed in Pape, 1996). Ganglion cell types differed in the degree to which they exhibited anomalous rectification, as shown for the representative cells in Fig. 5. For example, the alpha cell (Fig. 5A) exhibited no sag at all in the current-evoked hyperpolarization, whereas the iota cell (Fig. 5H) exhibited a sag of fully 20 mV for strong hyperpolarizations.
Figure 5. RGC responses to hyperpolarizing current pulses.
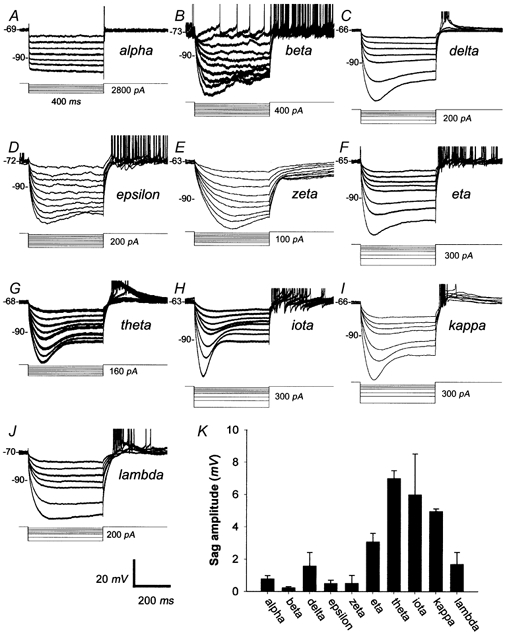
A-J, voltage responses of one cell of each morphological type to hyperpolarizing current steps (400 ms). Cells were chosen to be representative of the amount of sag typical for cells of that type. Each trace is the average of at least two individual trials. Cell type is indicated to the right of each set of traces. Voltage and time scale below panel J applies to all panels A-J. Values to the right of current pulses correspond to the maximum current step. Spikes have been clipped. K, bar graph comparing cell types on the average amplitude of sag observed when hyperpolarizing cells beyond −90 mV.
To compare quantitatively the magnitude of this phenomenon among cell types, we determined how far the membrane potential sagged back towards Vrest after reaching a peak hyperpolarization of −93 mV, a membrane voltage sufficiently negative to evoke the phenomenon in our cells and many other neurons (see Pape, 1996 for review). This assessment usually required linear interpolation of the relationships between current strength and peak and steady-state hyperpolarization. The bar graph of Fig. 5K shows the marked differences in sag amplitude among cell types, which reached statistical significance (Kruskal-Wallis H (9, 103) = 40.5, P < 0.05). Sag was negligible among alpha, beta, epsilon and zeta cells but very pronounced for eta, theta, iota and kappa cells. Delta and lambda cells were intermediate on this measure. The distinctions among types in anomalous rectification may consist in part of differences in its activation threshold. Several of the cells in Fig. 5 (beta, epsilon and zeta) that exhibited no sag for peak hyperpolarizations near −93 mV did exhibit this behaviour at more negative potentials.
Ramping
A small minority of recorded cells (n = 11, 7 %) exhibited a marked delay in the return to Vrest following strong hyperpolarizing current pulses. Examples of this phenomenon are shown for two zeta cells (Figs. 5E and 6A and B) and one eta cell (Fig. 6C and D). Low-amplitude current pulses that did not drive the membrane potential below −73 mV were followed by a passive discharge of the membrane (Fig. 5E and Fig. 6C, top traces). Termination of stronger hyperpolarizing pulses, however, led to a slow decay or ‘ramp’ of the potential back to its resting value (Fig. 5E and Fig. 6A and C). Depending on the amplitude of the hyperpolarizing current pulse, this ramping could last from several hundred milliseconds (Fig. 6A and C) to well over 1 s (data not shown). The duration of the repolarization phase appeared to increase with the magnitude of the hyperpolarization from −70 mV to saturation at about −100 mV.
Figure 6. Ramping behaviour of zeta- and eta-type RGCs.
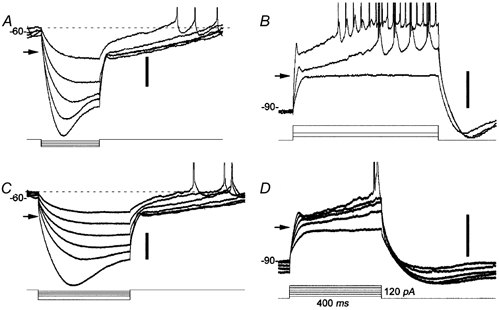
Ramping behaviour illustrated in representative raw voltage records from one zeta cell (A and B) and one eta cell (C and D). A and C, response to hyperpolarizing current steps. Note the delayed return to resting potential (dotted line) upon termination of negative current pulses driving the membrane potential below −73 mV (arrows). B and D, response to depolarizing current steps during sustained negative current injection hyperpolarizing the membrane to approximately −90 mV. Note that current steps that depolarized the membrane beyond −73 mV (arrows) triggered a depolarizing ramp leading to spiking. Time and current scales are the same in all panels; current value in D (120 pA) refers to the largest pulse in that panel. The voltage scale to the right of each set of traces equals 20 mV. Spikes have been clipped in all panels.
To investigate further the activation threshold of this phenomenon, we drove the membrane potential to about −90 mV with constant negative current and then tested the cell's response to superimposed depolarizing current steps (Fig. 6B and D). Small positive current pulses, depolarizing the membrane to potentials more negative than −73 mV (arrows), appeared to charge the membrane passively (bottom trace in both Fig. 6B and D). In contrast, larger depolarizing currents evoked a slow depolarizing ramp that could trigger action potentials (top traces in Fig. 6B and D). Increasing current intensity increased the slope of the ramp and decreased the latency to the first spike (Fig. 6B).
Only two morphological types of ganglion cells exhibited such ramping behaviour. Of the 11 cells that exhibited ramping, three were zeta cells, five were eta cells, and three could not be identified due to poor intracellular staining. Cells exhibiting ramping include all of the zeta cells in our sample, but only about a fifth of all recorded eta cells.
DISCUSSION
The major finding of this study was that morphologically defined types of cat RGCs exhibited marked differences in intrinsic physiological properties. Because these properties constrain the cellular response to synaptic currents, they may be an important factor in the differentiation among cell types in light-evoked behaviour.
Methodological limitations
Recording conditions may have distorted the physiological behaviour of these cells in several ways. For instance, the recordings were made at room temperature (approximately 22 °C) and channel kinetics and dynamic electrical behaviour are likely to have been slower than at normal physiological temperature. The magnitude of these effects is unknown since we have characterized neither the specific ion channels involved nor their Q10 values (Thompson et al. 1985). However, at least with respect to spiking behaviour, the effects may be relatively modest, judging from in vivo extracellular recordings of RGCs or their axons (see Spike frequency and Spike width, below). Further, the ruptured patch whole-cell recording method results in cellular dialysis with the internal solution. This process will probably affect measurements of Vrest and may also result in washout of intracellular constituents necessary for normal cellular function. However, light responses under our recording conditions have been shown to be remarkably normal (O'Brien et al. 1999), further suggesting that the intrinsic electrical characteristics of these cells were not dramatically altered by our recording procedures. Synaptic conductances were not blocked in these studies and may have also influenced such static membrane parameters as RN and τm. Whatever the responsible mechanisms, the observed differences in RN and τm imply significant distinctions among cell types in background physiological state and hence in their response to light-evoked synaptic currents.
Although there were marked differences in intrinsic behaviour among different types, we also observed substantial within-type variability. Some of this variation is undoubtedly real. For example, somatic and dendritic diameter increases systematically for individual types with retinal eccentricity (for example, see Wässle & Boycott, 1991). These data would predict a parallel eccentricity dependence of RN and τm and, hence, substantial within-type variability on these parameters when data are pooled across eccentricities. As many cell types were encountered only rarely, we were not able to systematically account for the effects of eccentricity across cell types. On the other hand, some of the within-type variation presumably results from technical problems such as undetected cellular damage or errors in morphological categorization. Because such variability obscures systematic differences among cell types, these distinctions may actually be more marked and extensive than indicated by our data. In what follows, we review the differences observed and consider their possible biophysical bases and functional implications.
Input resistance and time constant
Input resistance (RN) is an important determinant of a cell's voltage response to synaptic currents. The differences in RN we observed among cell types presumably arise, in part, from differences in cell size. For example, alpha cells (mean RN = 31 MΩ) have the largest somata, thickest dendrites and largest dendritic arbors of all cat RGCs, whereas zeta cells (RN > 1 GΩ) have among the smallest somas and dendritic arbors (Berson et al. 1998). Data were drawn almost entirely from sites where within-type eccentricity dependence of somatic and dendritic field size is weak (> 2 mm from the area centralis; Berson et al. 1998). Thus, observed differences among types in RN and τm cannot have arisen spuriously from mismatches in topographic sampling.
Our data on RN fall within the range of those previously reported for mammalian RGCs (range 10–3000 MΩ) (Lipton & Tauck, 1987; Sucher & Lipton, 1992; Robinson & Chalupa, 1997; Wang et al. 1997; Cohen, 1998; Guenther et al. 1999; Rothe et al. 1999; Velte & Masland, 1999; Weber, 2000). Although the RN values for alpha cells were remarkably low, we do not think they were artifactual. Second, others using comparable methods have obtained similar values in cat alpha cells and their probable primate homologues (primate parasol cells, Weber, 2000; cat alpha cells, Cohen, 2001; but see Robinson & Chalupa, 1997). Further, cells in our sample appeared healthy by both morphological and physiological criteria, including smooth, well-stained dendrites, stable resting potentials, large amplitude spikes and, in many cells, robust light responses.
The membrane time constant (τm) is also important in determining how a neuron responds to synaptic input. Very long time constants (such as those of zeta cells) permit substantial temporal summation of synaptic inputs at the expense of temporal resolution. The reverse is true of cells with short time constants, such as alpha cells. In fact, we have probably somewhat overestimated the mean alpha cell τm because we excluded data from some cells in which τm was so short that the charging curve of the membrane was indistinguishable from that of the pipette. The fast time constants of alpha cells might increase both the accuracy with which they can encode the timing of visual events and the range of temporal frequencies to which they can respond. Indeed, alpha (Y) cells have been reported to have higher temporal cut-off frequencies than do beta (X) cells (Fukada & Saito, 1971; Frishman et al. 1987); but see also Lennie (1980). However, this difference between the two types in temporal bandpass is much smaller than the difference in τm. Thus, temporal filtering by synaptic networks may be relatively more important than passive electrical properties in shaping the frequency response of these cells. Superficially, our results appear to be in conflict with the report of Robinson & Chalupa (1997) that alpha and beta cells have similar frequency bandpass when tested with sinusoidal current injection. In that study, however, current amplitude was adjusted to maintain a standard voltage excursion for all cells and stimulus frequencies. This approach effectively excludes contributions of passive membrane characteristics (RN, τm) to the voltage response, so it probes mainly the frequency response of the spike-generating mechanism. It does not directly address the issue of whether alpha and beta cells differ in the bandpass of their response to light-evoked synaptic current partly as a result of differences in passive electrical properties. Still, Robinson & Chalupa (1997) did not observe the difference in τm between alpha and beta cells that we found here. While their estimate of τm in beta cells (22.5 ms) is very close to ours (25.1 ms), that for alphas (34.2 ms) is much longer than obtained here (< 4.5 ms) or by others (E. Cohen, personal communication; see also Weber, 2000, for data on primate parasol cells).
Spike frequency
In all ganglion cells examined, depolarizing current injections evoked action potentials. The frequency and duration of evoked action potentials, however, differed greatly among the cell types. For example, maximum spike frequencies were highest in alpha cells, intermediate in beta cells, and lowest in the remaining cell types. This spectrum parallels the well-established differences in maximum light-evoked spike frequency for Y, X and W cells recorded in vivo and is central to the distinction between brisk and sluggish ganglion cells (Cleland & Levick, 1974a,b; Stone & Fukuda, 1974). Our data may actually underestimate the differences among cell types in peak spike frequency. Nearly all recordings of non-alpha, non-beta RGCs were made with a gluconate-based internal solution, which tended to yield higher spike frequencies than did the MeSO4-based internal used for about half of the alpha and beta cell recordings.
The differences in spike frequency among RGC types may be traceable in part to sodium channel kinetics. According to Kaneda & Kaneko (1991), relatively large cat RGCs (probably mainly X/beta cells) exhibit more rapid sodium channel de-inactivation that do smaller (presumed W) cells. A positive correlation between soma size and peak spike frequency has also been noted in rat RGCs (Barres et al. 1988).
Although all RGC types exhibited spike frequency adaptation, this was virtually never pronounced enough to preclude repetitive firing, as it is in some kitten (Skaliora et al. 1993) and salamander (Mobbs et al. 1992) RGCs. In salamander, differences among RGCs in spike frequency adaptation may shape response kinetics, with strong frequency adaptation yielding phasic light responses and weak adaptation permitting more tonic responses (Mobbs et al. 1992). In cat retina, one can find some evidence for such a correlation. For example, alpha cells, which respond more transiently to light than do beta cells, also exhibit more spike frequency adaptation. On the whole, however, the modest differences in frequency adaptation among cat RGC types are not consistently related to the time course of the light response. For instance, although delta cells have more sustained light responses than eta cells (O'Brien et al. 1999), they nonetheless exhibit greater spike frequency adaptation. Thus, intrinsic firing properties may contribute relatively little to the temporal profile of light responses in cat RGCs.
Spike width
Large differences were observed in spike width among RGC types. Confirming data from extracellular recordings (Cleland & Levick, 1974a; Fukuda & Stone, 1974; Stone & Fukuda, 1974), our data demonstrate that alpha cells had the fastest action potentials, beta cells were nearly as fast, and the remaining cell types had markedly broader spikes. These differences account for the characteristic sounds made by these types when their spikes are monitored on a loudspeaker: ‘clacking’ for alpha (Y) and beta (X) cells, ‘ploppy’ for other (‘sluggish’) types (Cleland & Levick, 1974a). In addition, our data reveal a substantial type-specific variation in spike width among non-alpha/non-beta RGC types (Fig. 4), with the broadest (those of kappa cells) averaging more than twice the duration of the narrowest (delta cells).
These differences among cell types in spike width may be linked to differences in peak spike frequency. Calcium-activated K+ (KCa) channels are thought to mediate much of the spike frequency adaptation observed in neurons (Hille, 1992). These channels have been detected in ferret RGCs (Wang et al. 1998, 1999). Ganglion cells with broader spikes could allow more Ca2+ to enter the cell through L- and T-type voltage-activated Ca2+ channels, both of which have been observed in cat RGCs (Kaneda & Kaneko, 1991; Huang & Robinson, 1998). This larger influx of Ca2+ could, in turn, produce greater activation of KCa channels and reduce spike frequency. Thus, it may be that the mechanisms responsible for the broad action potentials of non-alpha/non-beta ganglion cells are also indirectly responsible for their lower spike frequencies. Of course, this is but one of many possible consequences of elevated intracellular free Ca2+.
The ionic bases for differences in spike width among RGC types are unknown, though available evidence favours differences in voltage-activated potassium currents (IK(v)). Despite their marked differences in spike width, X and W cells of the cat retina do not differ significantly in the density of voltage-activated sodium (INa) or calcium (ICa) currents (Kaneda & Kaneko, 1991). In ferret RGCs, blockers of both the big and small conductance calcium-activated K+ current (IK(Ca)) had no significant effect on spike width (Wang et al. 1998). These negative findings leave the large collection of voltage-activated K+ currents as the most likely ionic mechanism for the observed differences in spike width among RGC types. Interestingly, one such conductance (IK(A)) is present in only half of postnatal cat RGCs (Skaliora et al. 1995). While this current is usually associated with modulating repetitive spiking, it has been demonstrated to affect action potential shape in some systems (Connor & Stevens, 1971; Belluzzi et al. 1985; Storm, 1987).
Anomalous rectification
Anomalous rectification or ‘sag’, first described in motor neurons (Araki et al. 1962; Ito & Oshima, 1965), has been identified in numerous cell types including ganglion cells and other retinal neurons (see Pape, 1996, for review). The ionic current mediating anomalous rectification has been variously termed If, Iq, IAR and IA but in neurons is most commonly referred to as Ih (hyperpolarization-activated current). This current generally activates at potentials between Vrest and potassium equilibrium potential (EK), and is carried by both Na+ and K+ ions.
The anomalous rectification we observed in cat RGCs is similar to that previously observed in RGCs (Eng et al. 1990; Tabata & Ishida, 1996), appearing slowly over tens to hundreds of milliseconds and persisting throughout the current pulse. It was typically elicited at potentials more negative than rest but more positive than EK (-87 mV for our internal solutions) and increased in speed and amplitude with increasing current intensity (e.g. Fig. 5H). At the end of hyperpolarizing current pulses eliciting sag, Vm overshot the resting potential, usually triggering action potentials. Voltage clamp and pharmacological experiments will be needed to identify unambiguously the current underlying sag, but our data are consistent with mediation by Ih.
The role of Ih in shaping RGC light responses is unclear and may depend on cell type. Tabata & Ishida (1996) suggested that in cat X cells, Ih may account for the sag seen in the hyperpolarization elicited by a visual stimulus of a contrast opposite that preferred by the centre mechanism (Nelson et al. 1978; Saito, 1983). We believe this is unlikely because we detected no anomalous rectification in beta cells in the relevant voltage range. Moreover, extracellular application of CsCl (2 mm), which blocks Ih (Tabata & Ishida, 1996), did not eliminate the sag in the light-evoked hyperpolarizations of beta cells (n = 2; data not shown). Their relatively linear electrical behaviour, exemplified by the absence of anomalous rectification or ramping (see below), presumably permits beta cells to follow more closely their bipolar input drive and may relate to the linearity with which their receptive fields summate luminance information (Enroth-Cugell & Robson, 1966; Hochstein & Shapley, 1976). It may also be that beta cells do express Ih but that its activation threshold is shifted to more hyperpolarized potentials relative to other types. It has been demonstrated previously that Ih is under neuromodulatory control in photoreceptors (Akopian & Witkovsky, 1996). In addition, RGCs may express different isoforms of Ih that are known through heterologous expression systems to differ in their kinetics, voltage dependence and sensitivity to neuromodulators (Santoro & Tibbs, 1999).
Ramping
The ramping phenomenon exhibited by some cat eta and zeta cells has also been observed in RGCs of salamander (Lukasiewicz & Werblin, 1988) and rat (Barres et al. 1988). It is probably mediated by a slowly inactivating K+ current termed IB described first in salamander RGCs (Lukasiewicz & Werblin, 1988) and more recently in rat and mouse (Sucher & Lipton, 1992; Rothe et al. 1999). This current activates rapidly at voltages subthreshold for spike generation and inactivates very slowly over hundreds of milliseconds. It is similar to another K+ current (ID), originally described in hippocampal cells (Storm, 1988), although activation and inactivation are triggered at more depolarized potentials for IB than for ID. In addition, these two currents may be differentiated by their sensitivity to pharmacological agents such as 4-aminopyridine and Ba2+ (see Sucher & Lipton, 1992). The activation threshold for ramping in cat RGCs (near −70 mV) is closer to that of ID (Storm, 1988) than of IB (Sucher & Lipton, 1992). By contrast, Sucher & Lipton (1992) found that IB in rat RGCs more closely resembled IB in salamander RGCs (Lukasiewicz & Werblin, 1988) than ID in rat hippocampus (Storm, 1988). Voltage-clamp and pharmacological experiments will be required to determine which, if either, of these two currents underlies the ramping phenomenon in cat RGCs.
The incidence of mammalian RGCs exhibiting ramping, IB or ID, varies widely across studies. In apparent conflict with our data, Skaliora et al. (1995) observed this current in none of the > 200 cat RGCs they recorded, even though many of these were back-filled from the superior colliculus, a major target of zeta and eta cells (Berson et al. 1998, 1999b). The disparity with our results may reflect their use of dissociated RGCs or immature animals. This current (IB or ID) has been shown to be upregulated during development of mouse and rat RGCs (Guenther et al. 1999; Rothe et al. 1999). Sucher & Lipton (1992) identified IB in 92 % of rat RGCs, whereas only 7 % (11/154) of cat RGCs exhibited ramping. While this discrepancy might reflect either species differences or the methods used to detect the current, this seems to be contradicted by the data of Rothe et al. (1999), who detected the current in only 15 % of mouse RGCs. Another possibility is that the isolation procedure used by Sucher & Lipton (1992) selected against cells lacking IB. For example, cat alpha cells, which do not exhibit ramping, rarely survive isolation procedures (Kaneda & Kaneko, 1991). Finally, it is possible that our testing protocols masked the presence of this conductance in some RGCs. For the cells that exhibited ramping, the resting potential was presumably more positive than both the activation and inactivation thresholds of the responsible voltage-activated conductance. Hyperpolarizing pulses de-inactivated the conductance and the termination of those pulses triggered fast activation and slow inactivation. Note, however, that hyperpolarizing pulses would not trigger such a conductance in cells with resting potentials slightly more negative than the activation threshold. In such circumstances, even depolarizing pulses might fail to evoke a detectable activation of the current, because resting membrane potentials near the activation thresholds would probably produce continuous, profound inactivation (IB ∼80 %, ID ∼95 %; Lukasiewicz & Werblin, 1988). Testing a variety of cell types with biphasic (hyperpolarizing-depolarizing) pulses or under voltage clamp would resolve this uncertainty.
Acknowledgments
We would like to thank Rowland Taylor, David Robinson, Norberto Grzywacz, Lyle Borg-Graham, Michael Beierlein and Jay Gibson for advice on whole-cell technique and Barry Connors for helpful comments on the manuscript. This work was supported by NIH R01 EY06108, R01 EY12793 and Training Grant T32 MH19118.
REFERENCES
- Akopian A, Witkovsky P. D2 dopamine receptor-mediated inhibition of a hyperpolarization-activated current in rod photoreceptors. Journal of Neurophysiology. 1996;76:1828–1835. doi: 10.1152/jn.1996.76.3.1828. [DOI] [PubMed] [Google Scholar]
- Araki T, Ito M, Oshima T. Potential changes produced by application of current steps in motoneurones. Nature. 1962;191:1104–1105. doi: 10.1038/1911104a0. [DOI] [PubMed] [Google Scholar]
- Barres BA, Silverstein BE, Corey DP, Chun LL. Immunological, morphological, and electrophysiological variation among retinal ganglion cells purified by panning. Neuron. 1988;1:791–803. doi: 10.1016/0896-6273(88)90127-4. [DOI] [PubMed] [Google Scholar]
- Belluzzi O, Sacchi O, Wanke E. A fast transient outward current in the rat sympathetic neurone studied under voltage-clamp conditions. Journal of Physiology. 1985;358:91–108. doi: 10.1113/jphysiol.1985.sp015542. [DOI] [PMC free article] [PubMed] [Google Scholar]
- Berson DM, Isayama T, O'Brien BJ, Pu M. The kappa ganglion cell type of cat and ferret retina. Investigative Ophthalmology and Visual Science. 1999a;40:S813. [Google Scholar]
- Berson DM, Isayama T, Pu M. Morphology of presumed ON-OFF direction selective ganglion cell of cat retina. Society for Neuroscience Abstracts. 1997;23:730. [Google Scholar]
- Berson DM, Isayama T, Pu M. The eta ganglion cell type of cat retina. Journal of Comparative Neurology. 1999b;408:204–219. [PubMed] [Google Scholar]
- Berson DM, Pu M, Famiglietti EV. The zeta cell: A new ganglion cell type in cat retina. Journal of Comparative Neurology. 1998;399:269–288. doi: 10.1002/(sici)1096-9861(19980921)399:2<269::aid-cne9>3.0.co;2-z. [DOI] [PubMed] [Google Scholar]
- Boycott BB, WÄSSLEauml;ssle H. The morphological types of ganglion cells of the domestic cat's retina. Journal of Physiology. 1974;240:397–419. doi: 10.1113/jphysiol.1974.sp010616. [DOI] [PMC free article] [PubMed] [Google Scholar]
- Cleland BG, Levick WR. Brisk and sluggish concentrically organized ganglion cells in the cat's retina. Journal of Physiology. 1974a;240:421–456. doi: 10.1113/jphysiol.1974.sp010617. [DOI] [PMC free article] [PubMed] [Google Scholar]
- Cleland BG, Levick WR. Properties of rarely encountered types of ganglion cells in the cat's retina and an overall classification. Journal of Physiology. 1974b;240:457–492. doi: 10.1113/jphysiol.1974.sp010618. [DOI] [PMC free article] [PubMed] [Google Scholar]
- Cleland BG, Levick WR, WÄSSLEauml;ssle H. Physiological identification of a morphological class of cat retinal ganglion cells. Journal of Physiology. 1975;248:151–171. doi: 10.1113/jphysiol.1975.sp010967. [DOI] [PMC free article] [PubMed] [Google Scholar]
- Cohen ED. Interactions of inhibition and excitation in the light-evoked currents of X type retinal ganglion cells. Journal of Neurophysiology. 1998;80:2975–2990. doi: 10.1152/jn.1998.80.6.2975. [DOI] [PubMed] [Google Scholar]
- Cohen ED. Synaptic mechanisms shaping the light-response in retinal ganglion cells. Progress in Brain Research. 2001;131:215–228. doi: 10.1016/s0079-6123(01)31018-x. [DOI] [PubMed] [Google Scholar]
- Cohen E, Sterling P. Demonstration of cell types among cone bipolar neurons of cat retina. Philosophical Transactions of the Royal Society B. 1990;330:305–321. doi: 10.1098/rstb.1990.0201. [DOI] [PubMed] [Google Scholar]
- Connor JA, Stevens CF. Voltage clamp studies of a transient outward membrane current in gastropod neural somata. Journal of Physiology. 1971;213:21–30. doi: 10.1113/jphysiol.1971.sp009365. [DOI] [PMC free article] [PubMed] [Google Scholar]
- Conover WJ. Practical Nonparametric Statistics. 2. New York: Wiley; 1980. [Google Scholar]
- Cook JE. Getting to grips with neuronal diversity: What is a neuronal type. In: Chalupa LM, Finlay BL, editors. Development and Organization of the Retina: From Molecules to Function. New York: Plenum Press; 1997. pp. 91–120. [Google Scholar]
- Dacey DM. Monoamine-accumulating ganglion cell type of the cat's retina. Journal of Comparative Neurology. 1989;288:59–80. doi: 10.1002/cne.902880106. [DOI] [PubMed] [Google Scholar]
- Dacey DM. Primate retina: Cell types, circuits and color opponency. Progress in Retinal and Eye Research. 1999;18:737–763. doi: 10.1016/s1350-9462(98)00013-5. [DOI] [PubMed] [Google Scholar]
- Eng DL, Gordon TR, Kocsis JD, Waxman SG. Current-clamp analysis of a time-dependent rectification in rat optic nerve. Journal of Physiology. 1990;421:185–202. doi: 10.1113/jphysiol.1990.sp017940. [DOI] [PMC free article] [PubMed] [Google Scholar]
- Enroth-Cugell C, Robson JG. The contrast sensitivity of retinal ganglion cells of the cat. Journal of Physiology. 1966;187:517–552. doi: 10.1113/jphysiol.1966.sp008107. [DOI] [PMC free article] [PubMed] [Google Scholar]
- Euler T, WÄSSLEauml;ssle H. Immunocytochemical identification of cone bipolar cells in the rat retina. Journal of Comparative Neurology. 1995;361:461–478. doi: 10.1002/cne.903610310. [DOI] [PubMed] [Google Scholar]
- Famiglietti EV, Jr, Kolb H. Structural basis for ON- and OFF-center responses in retinal ganglion cells. Science. 1976;194:193–195. doi: 10.1126/science.959847. [DOI] [PubMed] [Google Scholar]
- Freed MA, Sterling P. The ON-alpha ganglion cell of the cat retina and its presynaptic cell types. Journal of Neuroscience. 1988;8:2303–2320. doi: 10.1523/JNEUROSCI.08-07-02303.1988. [DOI] [PMC free article] [PubMed] [Google Scholar]
- Frishman LJ, Freeman AW, Troy JB, Schweitzer-Tong DE, Enroth-Cugell C. Spatiotemporal frequency responses of cat retinal ganglion cells. Journal of General Physiology. 1987;89:599–628. doi: 10.1085/jgp.89.4.599. [DOI] [PMC free article] [PubMed] [Google Scholar]
- Fukuda Y, Hsiao CF, Watanabe M, Ito H. Morphological correlates of physiologically identified Y-, X-, and W-cells in cat retina. Journal of Neurophysiology. 1984;52:999–1013. doi: 10.1152/jn.1984.52.6.999. [DOI] [PubMed] [Google Scholar]
- Fukada Y, Saito H. The relationship between response characteristics to flicker stimulation and receptive field organization in the cat's optic nerve fibers. Vision Research. 1971;11:227–240. doi: 10.1016/0042-6989(71)90187-8. [DOI] [PubMed] [Google Scholar]
- Fukuda Y, Stone J. Retinal distribution and central projections of Y-, X-, and W-cells of the cat's retina. Journal of Neurophysiology. 1974;37:749–772. doi: 10.1152/jn.1974.37.4.749. [DOI] [PubMed] [Google Scholar]
- Guenther E, Schmid S, Reiff D, Zrenner E. Maturation of intrinsic membrane properties in rat retinal ganglion cells. Vision Research. 1999;39:2477–2484. doi: 10.1016/s0042-6989(99)00004-8. [DOI] [PubMed] [Google Scholar]
- Hamill OP, Marty A, Neher E, Sakmann B, Sigworth FJ. Improved patch-clamp techniques for high-resolution current recording from cells and cell-free membrane patches. Pflügers Archiv. 1981;391:85–100. doi: 10.1007/BF00656997. [DOI] [PubMed] [Google Scholar]
- Hille B. Ionic Channels of Excitable Membranes. 2. Sunderland, MA, USA: Sinauer Associates; 1992. [Google Scholar]
- Hochstein S, Shapley RM. Quantitative analysis of retinal ganglion cell classifications. Journal of Physiology. 1976;262:237–264. doi: 10.1113/jphysiol.1976.sp011594. [DOI] [PMC free article] [PubMed] [Google Scholar]
- Huang SJ, Robinson DW. Activation and inactivation properties of voltage-gated calcium currents in developing cat retinal ganglion cells. Neuroscience. 1998;85:239–247. doi: 10.1016/s0306-4522(97)00351-5. [DOI] [PubMed] [Google Scholar]
- Isayama T, Berson DM, O'Brien BJ, Pu M. The lambda ganglion cell type of cat and ferret retina. Investigative Ophthalmology and Visual Science. 1999;40:S813. [Google Scholar]
- Isayama T, Berson DM, Pu M. Theta ganglion cell type of cat retina. Journal of Comparative Neurology. 2000;417:32–48. doi: 10.1002/(sici)1096-9861(20000131)417:1<32::aid-cne3>3.0.co;2-s. [DOI] [PubMed] [Google Scholar]
- Ishida AT. Ion channel components of retinal ganglion cells. Progress in Retinal and Eye Research. 1991;15:261–280. [Google Scholar]
- Ito M, Oshima T. Electrical behaviour of the motoneurone membrane during intracellularly applied current steps. Journal of Physiology. 1965;180:607–635. doi: 10.1113/jphysiol.1965.sp007720. [DOI] [PMC free article] [PubMed] [Google Scholar]
- Johnston D, Wu S. Foundations of Cellular Neurophysiology. Cambridge, MA, USA: MIT Press; 1997. [Google Scholar]
- Kaneda M, Kaneko A. Voltage-gated sodium currents in isolated retinal ganglion cells of the cat: Relation between the inactivation kinetics and the cell type. Neuroscience Research. 1991;11:261–275. doi: 10.1016/0168-0102(91)90009-n. [DOI] [PubMed] [Google Scholar]
- Kolb H, Nelson R, Mariani A. Amacrine cells, bipolar cells and ganglion cells of the cat retina: A Golgi study. Vision Research. 1981;21:1081–1114. doi: 10.1016/0042-6989(81)90013-4. [DOI] [PubMed] [Google Scholar]
- Lennie P. Parallel visual pathways: A review. Vision Research. 1980;20:561–594. doi: 10.1016/0042-6989(80)90115-7. [DOI] [PubMed] [Google Scholar]
- Leventhal AG, Keens J, Tork I. The afferent ganglion cells and cortical projections of the retinal recipient zone (RRZ) of the cat's pulvinar complex. Journal of Comparative Neurology. 1980;194:535–554. doi: 10.1002/cne.901940305. [DOI] [PubMed] [Google Scholar]
- Lipton SA, Tauck DL. Voltage-dependent conductances of solitary ganglion cells dissociated from the rat retina. Journal of Physiology. 1987;385:361–391. doi: 10.1113/jphysiol.1987.sp016497. [DOI] [PMC free article] [PubMed] [Google Scholar]
- Lukasiewicz P, Werblin F. A slowly inactivating potassium current truncates spike activity in ganglion cells of the tiger salamander retina. Journal of Neuroscience. 1988;8:4470–4481. doi: 10.1523/JNEUROSCI.08-12-04470.1988. [DOI] [PMC free article] [PubMed] [Google Scholar]
- McGuire BA, Stevens JK, Sterling P. Microcircuitry of bipolar cells in cat retina. Journal of Neuroscience. 1984;4:2920–2938. doi: 10.1523/JNEUROSCI.04-12-02920.1984. [DOI] [PMC free article] [PubMed] [Google Scholar]
- McGuire BA, Stevens JK, Sterling P. Microcircuitry of beta ganglion cells in cat retina. Journal of Neuroscience. 1986;6:907–918. doi: 10.1523/JNEUROSCI.06-04-00907.1986. [DOI] [PMC free article] [PubMed] [Google Scholar]
- MacNeil MA, Heussy JK, Dacheux RF, Raviola E, Masland RH. The shapes and numbers of amacrine cells: Matching of photofilled with Golgi-stained cells in the rabbit retina and comparison with other mammalian species. Journal of Comparative Neurology. 1999;413:305–326. [PubMed] [Google Scholar]
- MacNeil MA, Masland RH. Extreme diversity among amacrine cells: Implications for function. Neuron. 1998;20:971–982. doi: 10.1016/s0896-6273(00)80478-x. [DOI] [PubMed] [Google Scholar]
- Mobbs P, Everett K, Cook A. Signal shaping by voltage-gated currents in retinal ganglion cells. Brain Research. 1992;574:217–223. doi: 10.1016/0006-8993(92)90819-u. [DOI] [PubMed] [Google Scholar]
- Neher E. Correction for liquid junction potentials in patch clamp experiments. Methods in Enzymology. 1992;207:123–131. doi: 10.1016/0076-6879(92)07008-c. [DOI] [PubMed] [Google Scholar]
- Nelson R, Famiglietti EV, Jr, Kolb H. Intracellular staining reveals different levels of stratification for on- and off-center ganglion cells in cat retina. Journal of Neurophysiology. 1978;41:472–483. doi: 10.1152/jn.1978.41.2.472. [DOI] [PubMed] [Google Scholar]
- O'Brien BJ, Isayama T, Berson DM. Intrinsic membrane characteristics of morphologically identified cat retinal ganglion cells. Society for Neuroscience Abstracts. 1998;24:1027. [Google Scholar]
- O'Brien BJ, Isayama T, Berson DM. Light responses of morphologically identified cat ganglion cells. Investigative Ophthalmology and Visual Science. 1999;40:S815. [Google Scholar]
- Pape HC. Queer current and pacemaker: The hyperpolarization-activated cation current in neurons. Annual Review of Physiology. 1996;58:299–327. doi: 10.1146/annurev.ph.58.030196.001503. [DOI] [PubMed] [Google Scholar]
- Peichl L, WÄSSLEauml;ssle H. Morphological identification of on- and off-centre brisk transient (Y) cells in the cat retina. Proceedings of the Royal Society B. 1981;212:139–153. doi: 10.1098/rspb.1981.0030. [DOI] [PubMed] [Google Scholar]
- Peichl L, WÄSSLEauml;ssle H. The structural correlate of the receptive field centre of alpha ganglion cells in the cat retina. Journal of Physiology. 1983;341:309–324. doi: 10.1113/jphysiol.1983.sp014807. [DOI] [PMC free article] [PubMed] [Google Scholar]
- Pourcho RG, Goebel DJ. A combined Golgi and autoradiographic study of 3H-glycine-accumulating cone bipolar cells in the cat retina. Journal of Neuroscience. 1987;7:1178–1188. doi: 10.1523/JNEUROSCI.07-04-01178.1987. [DOI] [PMC free article] [PubMed] [Google Scholar]
- Pu M, Berson DM. A method for reliable and permanent intracellular staining of retinal ganglion cells. Journal of Neuroscience Methods. 1992;41:45–51. doi: 10.1016/0165-0270(92)90122-t. [DOI] [PubMed] [Google Scholar]
- Pu M, Berson DM, Pan T. Structure and function of retinal ganglion cells innervating the cat's geniculate wing: an in vitro study. Journal of Neuroscience. 1994;14:4338–4358. doi: 10.1523/JNEUROSCI.14-07-04338.1994. [DOI] [PMC free article] [PubMed] [Google Scholar]
- Robinson DW, Chalupa LM. The intrinsic temporal properties of alpha and beta retinal ganglion cells are equivalent. Current Biology. 1997;7:366–374. doi: 10.1016/s0960-9822(06)00184-9. [DOI] [PubMed] [Google Scholar]
- Robinson DW, Wang GY. Development of intrinsic membrane properties in mammalian retinal ganglion cells. Seminars in Cell and Developmental Biology. 1998;9:301–310. doi: 10.1006/scdb.1998.0229. [DOI] [PubMed] [Google Scholar]
- Rodieck RW. The First Steps in Seeing. Sunderland, MA, USA: Sinauer Associates; 1998. [Google Scholar]
- Rodieck RW, Brening RK. Retinal ganglion cells: Properties, types, genera, pathways and trans-species comparisons. Brain Behavior and Evolution. 1983;23:121–164. doi: 10.1159/000121492. [DOI] [PubMed] [Google Scholar]
- Rothe T, Juttner R, Bahring R, Grantyn R. Ion conductances related to development of repetitive firing in mouse retinal ganglion neurons in situ. Journal of Neurobiology. 1999;38:191–206. [PubMed] [Google Scholar]
- Rowe MH, Stone J. Naming of neurones. Classification and naming of cat retinal ganglion cells. Brain Behavior and Evolution. 1977;14:185–216. doi: 10.1159/000125660. [DOI] [PubMed] [Google Scholar]
- Saito HA. Morphology of physiologically identified X-, Y-, and W-type retinal ganglion cells of the cat. Journal of Comparative Neurology. 1983;221:279–288. doi: 10.1002/cne.902210304. [DOI] [PubMed] [Google Scholar]
- Santoro B, Tibbs GR. The HCN gene family: Molecular basis of the hyperpolarization-activated pacemaker channels. Annals of the New York Academy of Sciences. 1999;868:741–764. doi: 10.1111/j.1749-6632.1999.tb11353.x. [DOI] [PubMed] [Google Scholar]
- Schlosser B, Ten Bruggencate G, Sutor B. The intracellular tracer Neurobiotin alters electrophysiological properties of rat neostriatal neurons. Neuroscience Letters. 1998;249:13–16. doi: 10.1016/s0304-3940(98)00366-8. [DOI] [PubMed] [Google Scholar]
- Schmid S, Guenther E. Alterations in channel density and kinetic properties of the sodium current in retinal ganglion cells of the rat during in vivo differentiation. Neuroscience. 1998;85:249–258. doi: 10.1016/s0306-4522(97)00644-1. [DOI] [PubMed] [Google Scholar]
- Skaliora I, Robinson DW, Scobey RP, Chalupa LM. Properties of K+ conductances in cat retinal ganglion cells during the period of activity-mediated refinements in retinofugal pathways. European Journal of Neuroscience. 1995;7:1558–1568. doi: 10.1111/j.1460-9568.1995.tb01151.x. [DOI] [PubMed] [Google Scholar]
- Skaliora I, Scobey RP, Chalupa LM. Prenatal development of excitability in cat retinal ganglion cells: Action potentials and sodium currents. Journal of Neuroscience. 1993;13:313–323. doi: 10.1523/JNEUROSCI.13-01-00313.1993. [DOI] [PMC free article] [PubMed] [Google Scholar]
- Stanford LR. W-cells in the cat retina: Correlated morphological and physiological evidence for two distinct classes. Journal of Neurophysiology. 1987a;57:218–244. doi: 10.1152/jn.1987.57.1.218. [DOI] [PubMed] [Google Scholar]
- Stanford LR. X-cells in the cat retina: Relationships between the morphology and physiology of a class of cat retinal ganglion cells. Journal of Neurophysiology. 1987b;58:940–964. doi: 10.1152/jn.1987.58.5.940. [DOI] [PubMed] [Google Scholar]
- Stone J. Parallel Processing in the Visual System: The Classification of Retinal Ganglion Cells and its Impact on the Neurobiology of Vision. New York: Plenum Press; 1983. [Google Scholar]
- Stone J, Fukuda Y. Properties of cat retinal ganglion cells: A comparison of W-cells with X- and Y-cells. Journal of Neurophysiology. 1974;37:722–748. doi: 10.1152/jn.1974.37.4.722. [DOI] [PubMed] [Google Scholar]
- Storm JF. Action potential repolarization and a fast after-hyperpolarization in rat hippocampal pyramidal cells. Journal of Physiology. 1987;385:733–759. doi: 10.1113/jphysiol.1987.sp016517. [DOI] [PMC free article] [PubMed] [Google Scholar]
- Storm JF. Temporal integration by a slowly inactivating K+ current in hippocampal neurons. Nature. 1988;336:379–381. doi: 10.1038/336379a0. [DOI] [PubMed] [Google Scholar]
- Sucher NJ, Lipton SA. A slowly inactivating K+ current in retinal ganglion cells from postnatal rat. Visual Neuroscience. 1992;8:171–176. doi: 10.1017/s0952523800009330. [DOI] [PubMed] [Google Scholar]
- Tabata T, Ishida AT. Transient and sustained depolarization of retinal ganglion cells by Ih. Journal of Neurophysiology. 1996;75:1932–1943. doi: 10.1152/jn.1996.75.5.1932. [DOI] [PubMed] [Google Scholar]
- Taylor WR, WÄSSLEauml;ssle H. Receptive field properties of starburst cholinergic amacrine cells in the rabbit retina. European Journal of Neuroscience. 1995;7:2308–2321. doi: 10.1111/j.1460-9568.1995.tb00652.x. [DOI] [PubMed] [Google Scholar]
- Thompson SM, Masukawa LM, Prince DA. Temperature dependence of intrinsic membrane properties and synaptic potentials in hippocampal CA1 neurons in vitro. Journal of Neuroscience. 1985;5:817–824. doi: 10.1523/JNEUROSCI.05-03-00817.1985. [DOI] [PMC free article] [PubMed] [Google Scholar]
- Vaney DI. The mosaic of amacrine cells in the mammalian retina. In: Osborne JJ, Chader G, editors. Progress in Retinal Research. Vol. 9. Oxford: Pergamon; 1990. pp. 49–100. [Google Scholar]
- Velte TJ, Masland RH. Action potentials in the dendrites of retinal ganglion cells. Journal of Neurophysiology. 1999;81:1412–1417. doi: 10.1152/jn.1999.81.3.1412. [DOI] [PubMed] [Google Scholar]
- Velumian AA, Zhang L, Pennefather P, Carlen PL. Reversible inhibition of IK, IAHP, Ih and ICa currents by internally applied gluconate in rat hippocampal pyramidal neurones. Pflügers Archiv. 1997;433:343–350. doi: 10.1007/s004240050286. [DOI] [PubMed] [Google Scholar]
- Wang GY, Olshausen BA, Chalupa LM. Differential effects of apamin- and charybdotoxin-sensitive K+ conductances on spontaneous discharge patterns of developing retinal ganglion cells. Journal of Neuroscience. 1999;19:2609–2618. doi: 10.1523/JNEUROSCI.19-07-02609.1999. [DOI] [PMC free article] [PubMed] [Google Scholar]
- Wang GY, Ratto G, Bisti S, Chalupa LM. Functional development of intrinsic properties in ganglion cells of the mammalian retina. Journal of Neurophysiology. 1997;78:2895–2903. doi: 10.1152/jn.1997.78.6.2895. [DOI] [PubMed] [Google Scholar]
- Wang GY, Robinson DW, Chalupa LM. Calcium-activated potassium conductances in retinal ganglion cells of the ferret. Journal of Neurophysiology. 1998;79:151–158. doi: 10.1152/jn.1998.79.1.151. [DOI] [PubMed] [Google Scholar]
- Wässle H, Boycott BB. Functional architecture of the mammalian retina. Physiological Reviews. 1991;71:447–480. doi: 10.1152/physrev.1991.71.2.447. [DOI] [PubMed] [Google Scholar]
- Wässle H, Voigt T, Patel B. Morphological and immunocytochemical identification of indoleamine-accumulating neurons in the cat retina. Journal of Neuroscience. 1987;7:1574–1585. doi: 10.1523/JNEUROSCI.07-05-01574.1987. [DOI] [PMC free article] [PubMed] [Google Scholar]
- Watanabe M, Fukuda Y, Hsiao CF, Ito H. Electron microscopic analysis of amacrine and bipolar cell inputs on Y-, X-, and W-cells in the cat retina. Brain Research. 1985;358:229–240. doi: 10.1016/0006-8993(85)90967-9. [DOI] [PubMed] [Google Scholar]
- Weber AJ. Membrane and visual response properties of parasol cells in the primate retina. Society for Neuroscience Abstracts. 2000;26:136. [Google Scholar]
- Weber AJ, McCall MA, Stanford LR. Synaptic inputs to physiologically identified retinal X-cells in the cat. Journal of Comparative Neurology. 1991;314:350–366. doi: 10.1002/cne.903140210. [DOI] [PubMed] [Google Scholar]
- West RW, Dowling JE. Synapses onto different morphological types of retinal ganglion cells. Science. 1972;178:510–512. doi: 10.1126/science.178.4060.510. [DOI] [PubMed] [Google Scholar]
- Xi XZ, Xu ZC. The effect of neurobiotin on membrane properties and morphology of intracellularly labeled neurons. Journal of Neuroscience Methods. 1996;65:27–32. doi: 10.1016/0165-0270(95)00140-9. [DOI] [PubMed] [Google Scholar]
- Yang G, Masland RH. Direct visualization of the dendritic and receptive fields of directionally selective retinal ganglion cells. Science. 1992;258:1949–1952. doi: 10.1126/science.1470920. [DOI] [PubMed] [Google Scholar]