

Abstract
Whole-cell voltage recordings were obtained from 64 synaptically coupled excitatory layer 4 (L4) spiny neurones and L2/3 pyramidal cells in acute slices of the somatosensory cortex (‘barrel’ cortex) of 17- to 23-days-old rats. Single action potentials (APs) in the L4 spiny neurone evoked single unitary EPSPs in the L2/3 pyramidal cell with a peak amplitude of 0.7 ± 0.6 mV. The average latency was 2.1 ± 0.6 ms, the rise time was 0.8 ± 0.3 ms and the decay time constant was 12.7 ± 3.5 ms. The percentage of failures of an AP in a L4 spiny neurone to evoke a unitary EPSP in the L2/3 pyramidal cell was 4.9 ± 8.8 % and the coefficient of variation (c.v.) of the unitary EPSP amplitude was 0.27 ± 0.13. Both c.v. and percentage of failures decreased with increased average EPSP amplitude. Postsynaptic glutamate receptors (GluRs) in L2/3 pyramidal cells were of the N-methyl-d-aspartate (NMDA) receptor (NMDAR) and the non-NMDAR type. At −60 mV in the presence of extracellular Mg2+ (1 mm), 29 ± 15 % of the EPSP voltage-time integral was blocked by NMDAR antagonists. In 0 Mg2+, the NMDAR/AMPAR ratio of the EPSC was 0.50 ± 0.29, about half the value obtained for L4 spiny neurone connections. Burst stimulation of L4 spiny neurones showed that EPSPs in L2/3 pyramidal cells depressed over a wide range of frequencies (1–100 s−1). However, at higher frequencies (30 s−1) EPSP summation overcame synaptic depression so that the summed EPSP was larger than the first EPSP amplitude in the train. The number of putative synaptic contacts established by the axonal collaterals of the L4 projection neurone with the target neurone in layer 2/3 varied between 4 and 5, with an average of 4.5 ± 0.5 (n = 13 pairs). Synapses were established on basal dendrites of the pyramidal cell. Their mean geometric distance from the pyramidal cell soma was 67 ± 34 μm (range, 16–196 μm). The results suggest that each connected L4 spiny neurone produces a weak but reliable EPSP in the pyramidal cell. Therefore transmission of signals to layer 2/3 is likely to have a high threshold requiring simultaneous activation of many L4 neurons, implying that L4 spiny neurone to L2/3 pyramidal cell synapses act as a gate for the lateral spread of excitation in layer 2/3.
Movement of whiskers at the rodent's muzzle is thought to be represented in the cortex by a pattern of electrical activity in an ensemble of neurones in the corresponding cortical ‘representational area’ (Woolsey & van der Loos, 1970; Jones & Diamond, 1995; Diamond et al. 1999). This pattern of cortical activity depends on the stimulus properties and changes with time after stimulus onset. The number of active neuronal ensembles and their cortical location is time and stimulus dependent (Simons, 1978; Armstrong-James & Fox, 1987; Petersen & Diamond, 2000). The neuronal ensembles comprise neurones in different cortical layers of the cortex that together form a cortical column. In the barrel cortex, a cortical column is taken to be a barrel in layer 4 and the region of the supra- and infragranular layers just above and below it; these are believed to function as a unit in the signal transformation process. However, within a single column the cortical layers are likely to be the smallest processing unit of sensory cortices (Mountcastle, 1957; Mountcastle & Powell, 1959; Hubel & Wiesel, 1962; for review see Mountcastle, 1997; Rockland, 1998). Understanding whisker movement ‘representation’ in terms of neuronal firing within a barrel column of the somatosensory cortex requires knowledge of both the anatomical connections between those neurones responding to the deflection of a whisker and their functional properties. Anatomical properties provide insight into connectivity and direction of signal flow in three dimensions while electrophysiological data from pairs of synaptically connected neurones provide information on the amplitude, time course and reliability of the electrical signals involved. We have combined these two approaches to compare intra- and interlaminar excitatory signalling within the barrel cortex.
Spiny stellate neurones in layer 4 of the barrel field of the somatosensory cortex have a unique morphology that renders them well suited for a predominantly vertical, i.e. columnar signal flow in the neocortex. In particular, their dendrites are confined to a single cortical barrel and their axonal projection is largely columnar (Harris & Woolsey, 1981; Simons & Woolsey, 1984; Lübke et al. 2000; J. Lübke, A. Roth, D. Feldmeyer & B. Sakmann, unpublished observation). We have characterised previously the morphological and functional properties of synaptic connections between spiny neurones within a single barrel in layer 4 (Feldmeyer et al. 1999a; Lübke et al. 2000; Petersen & Sakmann, 2000). The predominantly vertically oriented axonal collaterals of spiny stellate neurones form the major excitatory pathway from layer 4, the main input layer of the cortex. We now report the anatomical and functional determinants of synaptic transmission in the connections between spiny stellate cells in layer 4 and pyramidal cells in layer 2/3 within a single cortical column.
Preliminary data from this study have previously been presented in abstract form (Feldmeyer et al. 1999b).
METHODS
Preparation
All experimental procedures were carried out according to the animal welfare guidelines of the Max-Planck-Gesellschaft. Wistar rats (17- to 23-days-old) were anaesthetised with halothane, decapitated, and slices of somatosensory cortex were cut in cold extracellular solution using a vibrating microslicer (DTK-1000, Dosaka Co. Ltd, Kyoto, Japan). The method described by Agmon & Connors (1991) was used with minor modifications necessary for rat brain. The brain was removed from the skull and placed on a ramp with a 10 deg slope with the anterior face downhill. The midline was adjusted so that it was parallel to the walls of the ramp. Subsequently, a vertical cut at an angle of 50 deg to the midline was made. The tissue rostral to the cut was discarded and the brain was glued with the cut face downward onto the chilled stage of the slicer. Three to four slices (800–1000 μm thick) were cut and discarded and the remaining tissue was sliced at slow speed and high vibration frequency into 300 μm thick ‘semi-coronal’ slices. Slices were collected with a soft brush, and subsequently incubated in an extracellular solution containing 4 mm MgCl to reduce synaptic activity at room temperature (22–24 °C) before recording.
Solutions
Slices were continuously superfused with an extracellular solution containing (mm): 125 NaCl, 2.5 KCl, 25 glucose, 25 NaHCO3, 1.25 NaH2PO4, 2 CaCl2 and 1 MgCl2 bubbled with 95 % O2 and 5 % CO2. In most experiments, 50 μm d-AP5 (d(-)-2-amino-phosphonopentanoic acid) or 20 μm 7-chlorokynurenate (all Tocris Cookson, Bristol, UK) were added to the perfusate to isolate the non-NMDA component of the EPSP. However, because of the negative resting potential of L2/3 pyramidal cells (about −75 to −80 mV), the contribution of the NMDA component of the EPSP was at any rate relatively small. In some experiments aimed at determining the size of the NMDA component of the EPSP/EPSC, 5–10 μm NBQX (2,3-dioxo-6-nitro-1,2,3,4-tetrahydrobenzo[f]quinoxaline-7-sulphonamide; Tocris Cookson, Bristol, UK) was added.
The pipette (intracellular) solution was based either on potassium or caesium gluconate. The composition of these solutions was as follows (mm): 105 potassium gluconate, 30 KCl, 10 Hepes, 10 phosphocreatine, 4 ATP-Mg, 0.3 GTP (adjusted to pH 7.3 with KOH) and 105 caesium gluconate, 30 CsCl, 10 Hepes, 10 phosphocreatine, 4 ATP-Mg, 0.3 GTP (adjusted to pH 7.3 with CsOH). The osmolarity of these solutions was 300 mosmol l−1. Biocytin (Sigma, Munich, Germany) at a concentration of 3 mg ml−1 was routinely added to the internal solution and cells were filled during 1–2 h of recording. The potassium-based internal solution was generally used for current clamp, the caesium-based internal solution for voltage-clamp recordings. Occasionally, 4 mm QX314 was added to the caesium-based internal solution to block Na+ and K+ currents.
Identification of synaptically connected neurones in the barrel cortex
Slices were placed in the recording chamber under an upright microscope (Axioskop, Carl Zeiss, Göttingen, Germany; fitted with × 2.5 plan/0.075 NA and × 40 W/0.80 objectives) with the pial surface pointing forward and the hippocampus to the right. The barrel field was visualised at low magnification under brightfield illumination and can be identified in layer 4 as narrow dark stripes with evenly spaced, light ‘hollows’ (Agmon & Connors, 1991; Feldmeyer et al. 1999a). Barrel structures are present in six or seven slices but a continuous band of barrels is visible only in two or three slices just above the fimbria-fornix and the lateral ventricle (Fig. 2A in Agmon & Connors, 1991). Individual L4 and L2/3 neurones were identified at × 40 magnification using infrared gradient contrast microscopy (Fig. 1).
Figure 1. Pair of spiny stellate and L2/3 pyramidal cells.

A and B, infrared gradient contrast images of a postsynaptic pyramidal cell in layer 2/3 (A) and a presynaptic spiny stellate cell in layer 4 (B). C, layers 4 and 2/3, including pia and pipette locations. The barrel structure at the level of layer 4 is clearly visible. The distances of the somata of pre- and postsynaptic neurones were between 70 and 510 μm.
Electrophysiological recordings
Whole-cell voltage recordings from postsynaptic neurones were made using patch pipettes of 3.5–6 MΩ resistance pulled of thick borosilicate glass capillaries (outer diameter, 2.0 mm; inner diameter, 0.5 mm). Synaptic connections between L4 spiny neurones and L2/3 pyramidal cells were only found in those (2 or 3) slices in which spiny stellate-star pyramid axon collaterals were perpendicular to the slice surface.
After patching the postsynaptic L2/3 pyramidal cell, connected cells were searched for in the cortical barrel (layer 4) directly below the pyramidal cell, fanning out laterally until a connection was established. This procedure may have biased against interbarrel connections. However, we tested later for intercolumnar connections by searching for synaptic connections in barrels that were adjacent to the barrel below in which the L2/3 pyramidal cell was located. We found that intercolumnar connections were extremely rare (see Results).
Searching of synaptic connections was performed in the loose-seal configuration using a ‘searching’ patch pipette of 6–10 MΩ resistance (Feldmeyer et al. 1999a). After establishing a loose seal (i.e. seal resistance < 1 GΩ) on a potential presynaptic L4 spiny neurone, the command potential was set to about −60 mV in current-clamp mode. An AP was elicited by applying a 5 ms current pulse (0.1–1 nA). If an AP was elicited, this was in most cases visible as a small deflection on the voltage trace. When this loose-seal stimulation resulted in EPSPs in the postsynaptic L2/3 pyramidal cell at short latency (i.e. within 5 ms), the ‘searching’ pipette was withdrawn. The presynaptic cell was then repatched with a new recording pipette (5–7 MΩ) filled with biocytin-containing intracellular solution, and APs were elicited in the whole-cell (voltage recording) mode. Pipettes with resistances lower than 5 MΩ were generally found to lead to the destruction of the relatively small L4 spiny neurones (soma diameter, ∼15 μm) during prolonged recording periods. In preliminary experiments the connectivity of the L4-L2/3 connection was found to be relatively high. Therefore, the searching procedure was limited to 30 min after breakthrough into the whole-cell configuration for the postsynaptic cell; if a synaptic connection was not found during that time, a new postsynaptic neurone (located above a different barrel) was patched.
Somatic whole-cell recordings were performed at 34–36 °C. Signals were amplified using an EPC9-2 (HEKA Elektronik, Lambrecht, Germany), for current-clamp recordings filtered at 1–3 kHz and sampled at 2–10 kHz and for voltage-clamp recordings filtered at 5 kHz and sampled at 10 kHz using the program ‘Pulse’ (Version 8.21, HEKA Elektronik, Lambrecht, Germany). Membrane potential fluctuations during current clamp recordings were ∼5 mV (peak to peak). Cell pairs in which a drift in the membrane potential was observed were omitted from the analysis.
Acquired data were stored on the hard disk of a Macintosh computer for off-line analysis (Igor, Wavemetrics, Lake Oswego, OR, USA).
Data analysis
EPSP amplitude, latency and kinetics were determined as described previously (Feldmeyer et al. 1999a). In order to account for the extra variance that resulted from membrane potential fluctuations, EPSP amplitudes were normalised to the mean membrane potential during the recording, assuming a linear AMPAR current-voltage relationship and a near-zero reversal potential. This resulted in a slight reduction of the standard deviation of the EPSP amplitude and thus in a reduced coefficient of variation.
All recordings were inspected visually; failures were defined as events with amplitudes less than 1.5 times the s.d. of the noise. In order to verify that small responses were not misclassified as failures due to a bad signal-to-noise ratio, failures were averaged in experiments with a high failure rate (> 20 %, n = 6 of 64). In all these experiments the failure average was a flat line indicating that misclassification of recordings was negligible.
Histological procedures
Following recording, slices were fixed at 4 °C for at least 24 h in 100 mm phosphate-buffered solution (PBS, pH 7.4), containing either 4 % paraformaldehyde, or 1 % paraformaldehyde and 2.5 % glutaraldehyde. Slices containing biocytin-filled neurones were processed using a modified protocol described previously (Lübke et al. 2000). Prior to incubation in avidin-biotinylated horseradish peroxidase (ABC-Elite, Camon, Wiesbaden, Germany) slices were immersed in liquid nitrogen for a few seconds. For light microscopy 0.1 % Triton X-100 was added to the incubation solution. Slices were then reacted using 3,3-diaminobenzidine as a chromogen under visual control until dendritic and axonal arborisations were clearly visible (usually after 2–4 min). To enhance staining contrast, slices were post-fixed in 0.5 % OsO4 (30–45 min). For light microscopy, slices were mounted on slides and embedded in Mowiol (Hoechst AG, Frankfurt, Germany) and a coverslip was applied. For subsequent electron microscopic analysis, slices were dehydrated and embedded in epoxy resin using a standard embedding protocol.
Morphological reconstructions of biocytin-filled synaptically coupled neurones
Biocytin-labelled pairs of neurones were examined under the light microscope at high magnification to identify putative synaptic contacts. Only pairs for which a complete physiological analysis was made and which displayed no obvious truncation of dendritic and axonal profiles were used for quantitative morphological analysis. Representative pairs were photographed at low magnification to document dendritic and axonal arborisation; potential synaptic contacts were identified as close apposition of a synaptic bouton and the postsynaptic dendrite in the same focal plane at a final magnification of × 1200 (× 100 objective and × 12 eyepiece; Fig. 11). Subsequently, neurones were drawn with the aid of a camera lucida attached to an Olympus BX50 microscope (Olympus, Hamburg, Germany) at a final magnification of × 720. Alternatively, biocytin-labelled pairs of neurones were reconstructed with the Neurolucida software (Microbrightfield, Colchester VT, USA) using a Zeiss Axioplan microscope at a magnification of × 400 or × 1000 (× 40 or × 100 objective and × 10 eyepiece). The reconstructions provided the basis for the quantitative morphological analysis of the following parameters: (1) location of the somata within the slice, (2) number, and (3) dendritic location of putative synaptic contacts. Corrections for shrinkage were not performed. For all data, means ± s.d. are given.
Figure 11. Reconstruction of a synaptically connected pair of a L4 spiny stellate cell and a L2/3 pyramidal cell.

Camera lucida reconstruction of a spiny stellate cell and a L2/3 pyramidal cell. The dendritic configuration of the presynaptic spiny stellate cell is drawn in red, the axon in blue; Note that the axon of the spiny stellate cell is confined to the ‘home’ column in which the somata of the neurones are located. The axonal projection of the pyramidal neurones were seen to project across several columns. The postsynaptic L2/3 pyramidal cell is drawn in black with its axon in green. The grey shaded area represents the L4 barrel in which the spiny stellate neurone was located. Inset, four putative synaptic contacts by the axonal arborisation of the spiny stellate cell with the dendrites of the L2/3 pyramidal cell are marked by blue dots.
Electron microscopy
Electron microscopy (EM) was carried out to confirm putative light-microscopically identified synaptic contacts. Serial ultrathin sections through the dendritic and axonal domain of synaptically coupled L4 spiny neurones and L2/3 pyramidal cells were cut with an ultramicrotome (Leitz UItracut, Hamburg, Germany) and analysed for synaptic contacts using a Zeiss EM 10 electron microscope (Zeiss, Oberkochen, Germany).
RESULTS
For all pairs between L4 spiny neurones and L2/3 pyramidal cells (n = 64), the presynaptic cell was located in the barrel field of the somatosensory cortex and the postsynaptic cell in the region of layer 2/3 directly above the L4 neurone (Fig. 1). The regular firing pattern of each type of neurone allowed their identification as excitatory neurones; this was subsequently confirmed by histological processing. The connectivity between L4 spiny neurones and L2/3 pyramidal cells was found to be remarkably high, despite the large distance between pre- and postsynaptic neurone somata. Before establishing a synaptic connection, 1–30 cells had to be tested. There appeared to be clusters of L4 spiny neurones within which the connectivity was particularly high: in some cases (n = 9) 5–10 L4 spiny neurones (∼50 μm apart) were found to be synaptically coupled to the same L2/3 pyramidal cell, indicating a high degree of convergence. On the other hand, in a few experiments (n = 3) we found that a single L4 spiny neurone was coupled to several L2/3 pyramidal cells, suggesting that divergence exists also within a barrel column (data not shown). Further attempts to study the convergence and divergence of the L4-L2/3 connections were not made due to experimental limitations (recording time, thickness of the slice, possible damage of axons during the searching procedure).
The direct distance between L4 and L2/3 somata ranged from 70 to 510 μm (average 310 ± 100 μm); L2/3 pyramidal neurones were 50–370 μm (average 190 ± 80 μm) away from the L4 border (measured in the horizontal plane). For almost all synaptic L4-L2/3 connections, the L2/3 pyramidal cell was almost directly above the L4 spiny neurones, i.e. within the borders of a single barrel. Only for two of all the pairs analysed, were the pyramidal cells located over the barrel adjacent to that in which the presynaptic L4 spiny neurone was found.
We tested whether the synaptic connection between the L4 spiny neurone and the L2/3 pyramidal cell was reciprocal by somatic current injection in both neurones to generate an AP. In 64 paired recordings an AP in a L2/3 pyramidal cell did not evoke EPSPs in a L4 spiny neurone, indicating that these connections were unidirectional. In a separate set of experiments, L4 spiny neurones were patched first and presynaptic pyramidal neurones were searched in layer 2/3 (n = 20). In none of these experiments was a synaptic connection found, indicating that L2/3-L4 connections were either very rare or non-existent. The unidirectional nature of the L4-L2/3 connection is in marked contrast to intralaminar connections (L5-L5, Markram et al. 1997; L4-L4, Feldmeyer et al. 1999a) that often display reciprocal synaptic coupling.
Functional properties of L4 spiny neurone-L2/3 pyramidal cell synapses
To characterise the L4-L2/3 connections functionally, unitary EPSPs in pyramidal cells were analysed by measuring their latency, rise time, peak amplitude and decay time course in detail. EPSPs were elicited at a frequency of 0.1-0.033 s−1 (every 10–30 s) at a temperature of 35–37 °C. Higher frequencies resulted in a rapid decrease in the synaptic response. However, when returning to lower stimulation rates, it generally recovered.
While pairs of synaptically coupled L4 spiny neurones display a high spontaneous synaptic activity during the paired recordings (Feldmeyer et al. 1999a), this was not the case for the majority of L2/3 pyramidal cells. This facilitated the analysis of EPSPs and the detection of small events.
Latency of unitary EPSPs
Figure 2A illustrates the time course of APs evoked by current injection in the soma of a presynaptic spiny stellate cell (upper trace), which elicited unitary EPSPs in a postsynaptic pyramidal cell (lower trace). Successive APs evoked unitary EPSPs that varied in amplitude and latency between trials. In each individual synaptic connection, the latency of unitary EPSPs varied less than 2-fold during consecutive trials. The latency histogram for one synaptic connection is narrow and has a single peak (Fig. 2B); no significant correlation between latency and EPSP amplitude was observed for an individual connection (data not shown). Thus, unitary EPSPs at the L4 spiny to L2/3 pyramidal cell synapse show less variability in latency than those found in pairs of L5 pyramidal cells (Markram et al. 1997; Feldmeyer & Sakmann, 2000). This may imply that synaptic contacts are less spread out in L2/3 pyramidal cells than in L5 pyramidal cells (see below). The latency ranged from 0.7 to 3.5 ms between different connections and was on average 2.1 ± 0.6 ms with a mean s.d. of 0.4 ± 0.2 ms (temperature, 35–37 °C). There was a tendency towards smaller mean unitary EPSP amplitudes with increasing mean latency (Fig. 2C) which was not significant.
Figure 2. Latency of unitary EPSPs in a L4 spiny neurone-L2/3 pyramidal cell connection.

A, presynaptic AP (top trace) and unitary EPSPs (bottom traces) recorded from a synaptic connection between a L4 spiny neurone and L2/3 pyramidal cell. Note that there is only very little variation in latencies. B, latency distribution of unitary EPSPs, determined between the peak of the presynaptic AP and the onset of the EPSP. Note that the distribution of latencies for a single connection is very narrow. C, plot of mean latencies against the mean unitary EPSP amplitudes. There was a tendency towards longer latencies with decreasing EPSP amplitude. This relationship was, however, not significant. The correlation coefficient is −0.42.
EPSP time course
Figure 3A and B show a presynaptic AP and a unitary EPSP in a L2/3 pyramidal cell on different time scales. The data shown in Fig. 3C indicate that the average latency of EPSPs at L4 spiny-L2/3 pyramidal cell synapses is substantially longer than that of unitary EPSPs at either the L4-L4 spiny neurone connection or the L5-L5 pyramidal cell connection (Table 1; Markram et al. 1997; Feldmeyer et al. 1999a; Feldmeyer & Sakmann, 2000).
Figure 3. Time course and amplitude of EPSPs in L2/3 pyramidal cells of the barrel cortex.
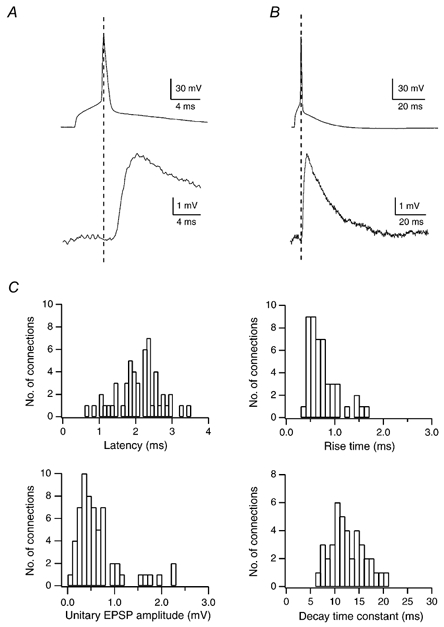
A and B, time course of EPSP rise and decay, respectively, on two different time scales (same recording). Traces represent averages of 20 unitary EPSPs evoked by single APs in a spiny stellate cell. C, histograms of EPSP latencies, 20–80 % rise times, unitary EPSP amplitudes and decay time constants in an L2/3 pyramidal cell. Decay times were obtained by fitting a single exponential to the decay phase of unitary EPSPs recorded in the presence of either d-AP5 or 7-chlorokynurenate to block the NMDAR component of the EPSP. The mean latency of unitary EPSPs was 2.1 ± 0.6 ms, the mean rise time 0.8 ± 0.3 ms, the mean decay time 12.7 ± 3.5 ms and the mean EPSP amplitude 0.7 ± 0.6 mV.
Table 1.
Time course and paired-pulse ratio of EPSPs at the L4 spiny neurone to L2/3 pyramidal cell connection
| Mean | s.d. | n | |
|---|---|---|---|
| Unitary EPSP amplitude (mV) | 0.7 | 0.6 | 64 |
| c.v. | 0.27 | 0.13 | 64 |
| Failure rate (%) | 4.9 | 8.8 | 64 |
| 20–80 % rise time (ms) | 0.8 | 0.3 | 48 |
| Latency (ms) | 2.1 | 0.6 | 64 |
| Decay time constant (ms) (fitted with single exponential) | 12.7 | 3.5 | 41 |
Pooled data from 64 recordings are summarised in Table 1. The EPSP decay time constant measured in the presence of an NMDAR antagonist (12.7 ± 3.5 ms, n = 41; Fig. 3C) was not significantly (Student's paired t test, P = 0.19) different from that in the absence of the antagonist (14.5 ± 3.6 ms, n = 12). The EPSP amplitude for the L4 spiny neurone to L2/3 pyramidal cell connection was on average 0.7 ± 0.6 mV (n = 64). No significant difference between EPSP amplitudes in the absence and presence of an NMDAR antagonist was observed (0.6 ± 0.5 and 0.9 ± 0.9 mV, respectively; Student's paired t test, P = 0.36).
The EPSP latency showed a weak positive correlation with the distance between a pre- and postsynaptic neurone (Fig. 4A). For 19 of 58 connections tested, the distance between pre- and postsynaptic somata was less than 250 μm. The EPSP latency for these connections was on average 1.63 ± 0.52 ms. The majority of connections (n = 39) had somata distances in the range of 250–510 μm; for these connections, the mean EPSP latency was 2.32 ± 0.46 ms (Fig. 4B), a difference that was statistically significant (Student's unpaired t test; P < 0.001). This tendency towards longer latencies with increasing distance between a pre- and postsynaptic neurone possibly reflects a longer axonal pathway.
Figure 4. Relationship between EPSP amplitude and soma distance.
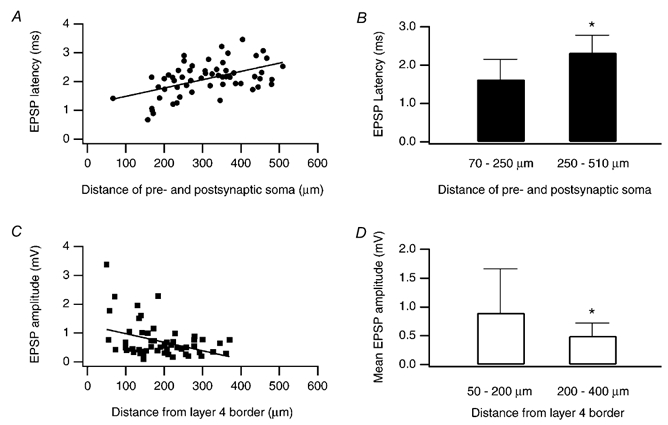
A, distribution of EPSP latency vs. distance between pre- and postsynaptic somata. There was a tendency towards longer EPSP latencies with increased soma distance (correlation coefficient 0.51). B, mean EPSP latency for connections with a L4-L2/3 soma distance of 70–250 and 250–510 μm. * the difference between these two groups was significant (Student's unpaired t test, P > 0.001). C, distribution of EPSP amplitude vs. distance of the layer 2/3 pyramidal cell from the layer 4 border. There was a tendency towards smaller EPSP amplitudes with increased distance of the L2/3 pyramidal cell from the L4 border (correlation coefficient −0.38). D, mean EPSP amplitude for L4-L2/3 connections, for which the L2/3 pyramidal cell was either 50–200 or 200–400 μm away from the L4 border. * the difference between these two groups was statistically significant (Student's unpaired t test, P = 0.02).
A weak negative correlation was found between the unitary EPSP amplitude and the location of the postsynaptic pyramidal cell within layer 2/3 (Fig. 4C). The mean unitary EPSP amplitude of L2/3 pyramidal cells in the lower half of layer 2/3 (i.e. 50–200 μm away from the layer 4 border; n = 31) was 0.9 ± 0.8 mV; that of L2/3 pyramidal cells in the upper half of layer 2/3 (i.e. 200–400 μm away from the layer 4 border) was 0.5 ± 0.2 mV. This difference was statistically significant (Student's unpaired t test; P = 0.02) and could be due to a lower density of axon collaterals of the L4 spiny neurones and hence a reduced probability of forming synaptic contacts (Lübke et al. 2000; see also Fig. 12).
Figure 12. Electron microscopic identification of synaptic contacts between neurones in layer 4 and layer 2/3.

Electron micrographs of the synaptic contacts of the cell pair shown in Fig. 11. All four light microscopically identified synaptic contacts were identified at the electron microscopic level. The synaptic boutons (b) of the spiny stellate axon collaterals are clearly identifiable by their content of transmitter vesicles. Contacts A-C are on dendritic shafts (d) while contact D is on a dendritic spine (s) of the L2/3 pyramidal cell. Scale bar applies to all four panels.
EPSC recordings
The anatomical reconstructions (see below) indicated that some synaptic contacts on pyramidal cell dendrites were located relatively close to the soma. We therefore made voltage-clamp current recordings of unitary EPSCs to measure the size, time course and the different components contributed by AMPAR and NMDAR channels to EPSCs.
Figure 5 shows averaged unitary EPSPs and EPSCs from the same L2/3 pyramidal cell at 36 °C. EPSCs recorded in 12 L4-L2/3 connections had a mean 20–80 % rise time of 0.34 ± 0.12 ms, a mean latency of 1.82 ± 0.40 ms and a mean decay time constant of 1.97 ± 0.70 ms in the presence of an NMDAR antagonist (20 μm 7-chlorokynurenate or 50 μm d-AP5). In the absence of the antagonist, the decay time constant was 2.37 ± 0.67 ms (extracellular Mg2+ 1 mm; n = 8). As for the unitary EPSPs, the differences in the time course of unitary EPSCs in the absence and presence of the antagonist were not significant (Student's unpaired t test, P = 0.20).
Figure 5. Time course of EPSCs in L2/3 pyramidal cells of the barrel cortex.
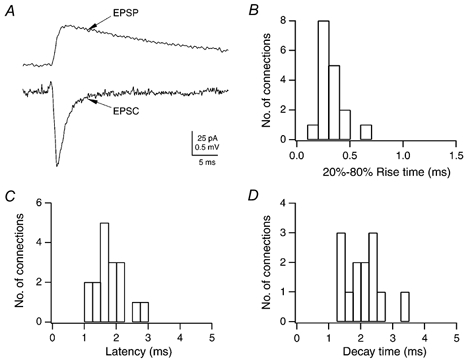
A, time course of an averaged unitary EPSC and unitary EPSP in normal extracellular solution recorded from the same L2/3 pyramidal cell in response to a single AP in the spiny stellate cell. Note that the EPSC is rising and decaying much more rapidly than the EPSP. B-D, histograms of EPSC 20–80 % rise times, latencies and decay time constants in L2/3 pyramidal cells recorded in the presence of d-AP5. The mean 20–80 % rise time of unitary EPSPs was 0.33 ± 0.11 ms, the mean latency 1.86 ± 0.51 ms and the mean decay time constant 1.97 ± 0.70 ms.
The time course of the EPSP was significantly longer (P = 0.01) than the membrane time constant measured at the soma in the same cells. Although the EPSP time course is likely to be mainly shaped by the membrane time constant it may also be slowed by dendritic filtering.
Relative contribution of NMDA receptors to the unitary EPSP
Unitary EPSPs in L2/3 pyramidal cells are mediated by both l-α-amino-3-hydroxy-5-methyl-4-isoxazole-proprionate (AMPA)- and NMDA-type glutamate receptors as the respective antagonists reduced the EPSP amplitude. The relative contribution of NMDAR to the EPSP amplitude was examined by either blocking the NMDAR component with 7-chlorokynurenate (20 μm) or d-AP5 (50 μm) or the AMPAR component with NBQX (10 μm) in the extracellular solution. A contribution of kainate receptors to the unitary EPSP or EPSC was not examined. No glycine was added in these experiments.
The somatic membrane potential of the postsynaptic cells was held at −60 mV. After the addition of d-AP5, 30–100 sweeps were averaged to obtain a mean waveform of the isolated AMPAR component of the EPSP (Fig. 6A). The NMDAR component was then obtained by subtraction of the AMPAR component from the EPSP waveform in control. In the presence of 1 mm Mg2+ in the extracellular solution, the NMDAR EPSP amplitude was 15.9 ± 12.8 % of the control EPSP (n = 11). The integral of the NMDAR-mediated EPSP component was 28.8 ± 15.1 % of the total EPSP integral (Fig. 6B) varying between experiments from a minimal value of 6.8 % to a maximal value of 49.1 %.
Figure 6. NMDAR component of unitary EPSPs and EPSCs in L2/3 pyramidal cells.

A, unitary EPSP measured in a pyramidal cell before (control) and after the addition of 10 μm NBQX to the bath solution (containing 1 mm Mg2+)to isolate the NMDAR mediated component. Traces are averages of 50 sweeps. The membrane potential was set to −60 mV during the recording. The line labelled ‘subtraction’ represents the EPSP component mediated by NMDARs obtained by subtraction of the EPSP in AP5-containing saline from that in control saline. B, histogram of the functional NMDAR mediated EPSP integral expressed as a fraction of the total integral of the unitary EPSP. The mean integral of the NMDAR mediated EPSP was 28.8 ± 15.1 % of that in the absence of the AMPAR antagonist. C, unitary EPSCs measured in a pyramidal cell before (control) and after addition of 50 μm d-AP5 to a ‘0 Mg2+’ bath solution to isolate the NMDAR mediated component. The postsynaptic neurone was held at a membrane potential of −60 mV. The line labelled ‘subtraction’ represents the NMDAR component of the EPSC and was obtained by subtracting the peak current in the presence and absence of d-AP5. D, ratio of peak AMPAR current vs. peak NMDAR current plotted for 12 cell pairs held at −60 mV. The mean NMDAR/AMPAR ratio was 0.50 ± 0.29. The dashed line represents unity, i.e. when the peak AMPAR current is equal to the peak NMDAR current.
NMDA and AMPA receptor-mediated currents
To estimate the relative amplitude of AMPAR and NMDAR currents recorded at the soma the relative size of the two current components was measured in nominally Mg2+-free extracellular solution (Fig. 6C). Unitary excitatory postsynaptic currents (EPSCs) were measured at −60 mV (in order to compare the results with the data obtained for intralaminar connections; Markram et al. 1997; Feldmeyer et al. 1999a) and averaged before and after the addition of either NBQX (5–10 μm) or d-AP5 (50 μm).
At the end of the experiment d-AP5 or NBQX was added to the external solution to determine whether the remaining EPSCs were entirely glutamatergic; in all cases, a complete block was achieved. The peak unitary EPSC amplitude in the absence of any antagonist was on average 65.2 ± 46.8 pA (n = 12). The relative contribution of the NMDAR component to the peak EPSC amplitude varied considerably (between 23 and 74 %) and was on average 41.0 ± 19.0 %. The average NMDAR/AMPAR current ratio (Fig. 6D) was 0.50 ± 0.29 and thus similar to other cortical synapses (e.g. Stern et al. 1992) but smaller than in L4-L4 spiny neurone pairs (Feldmeyer et al. 1999a). It has, however, to be kept in mind that because of the distance of synaptic contacts from the soma and the small diameter of the dendrites, the AMPAR-mediated current component is most likely to be underestimated because of dendritic filtering, particularly when recording close to physiological temperatures when channel kinetics are rapid. Furthermore the mean level of dendritic filtering is likely to vary across cell types.
In six cell pairs, the time course of the NMDAR EPSC was determined. NMDAR EPSCs had a mean 20–80 % rise time of 2.06 ± 0.61 ms (Table 2). A single exponential fit to the decay phase gave a mean decay time constant of 26.0 ± 8.5 ms. Recombinant NMDAR containing the NR-1 and NR-2A subunits have deactivation time constants in the range of 100 ms at room temperature (Monyer et al. 1994). Assuming a Q10 of 3–4 for channel kinetics, the NMDAR EPSC decay time constant at the spiny stellate-L2/3 pyramidal cell synapse is comparable with this value.
Table 2.
Time course of the EPSCs and the AMPAR and NMDAR components of unitary EPSCs at the L4 spiny neurone to L2/3 pyramidal cell connection
| Mean (ms) | s.d. (ms) | n | |
|---|---|---|---|
| Latency of EPSC | 1.84 | 0.52 | 12 |
| Rise of EPSC in 1m Mg2+ | 0.34 | 0.12 | 12 |
| Decay time constant of the EPSC in 1 mm Mg2+ (fitted with single exponential) | 2.37 | 0.67 | 8 |
| Rise of AMPAR component | 0.34 | 0.12 | 12 |
| Decay time constant of AMPAR component (fitted with single exponential) | 1.97 | 0.70 | 12 |
| Rise of NMDAR component* | 2.06 | 0.61 | 6 |
| Decay time constant of NMDAR component* (fitted with single exponential) | 26.0 | 8.5 | 6 |
The time course of the NMDAR component of the EPSC was determined in a nominally Mg2+-free extracellular solution.
Reliability of synaptic transmission
Synaptic transmission between L4 spiny neurones and L2/3 pyramidal cells is very reliable (Fig. 7). About two-thirds of the connections (n = 40 of 64) showed almost no failures (i.e. less than 2 %) and only 13 connections showed a percentage of failures higher than 10 % (Fig. 7D). On average, the failure rate of the L4-L2/3 connections was 4.9 ± 8.8 %.
Figure 7. Reliability of synaptic connections between L4 spiny stellate cells and L2/3 pyramidal cells.

A, examples of ten successive EPSPs (middle traces) in response to a presynaptic AP (top trace); the bottom trace represents the average EPSP waveform. B, fluctuation of EPSP amplitudes in a single experiment. Each • represents the peak amplitude of a unitary EPSP. C, distribution of the c.v.s of unitary EPSPs in 64 L4-L2/3 connections. D, histogram showing the failure rate (in %) in morphologically identified pairs between L4 spiny neurones and L2/3 pyramidal cells. For each connection, the failure rate was determined from 50–300 single AP stimulations (frequency 0.05−0.033 s−1).
In 64 synaptically coupled pairs of neurones the coefficient of variation (c.v.) of unitary EPSPs ranged between 0.06 and 0.71, with a mean of 0.27 ± 0.12 (median, 0.26; Fig. 7C) suggesting a high reliability.
As described for pairs between L5 pyramidal cells and pairs between L4 spiny neurones (Markram et al. 1997; Feldmeyer et al. 1999a), the c.v. was inversely related to the amplitude of the unitary EPSP. In simple binomial models of synaptic transmission these relationships are to be expected when the unitary EPSP amplitude is primarily determined by the release probability.
Calculation of limiting curves assuming a simple binomial model with:
and fixed values for the number of release sites nb and the quantal amplitude qS were not entirely satisfactory, because EPSP amplitudes larger than 2.5 mV were not included. To obtain limits for nb and qS, we assumed that nb was 5 (i.e. close to the mean number of putative synaptic contacts as determined by light microscopic examination). The two limiting curves in Fig. 8A and B were calculated for qS = 0.04 and 0.40 mV. The range of quantal EPSP amplitudes is smaller for the interlaminar L4-L2/3 connections than for the intralaminar L4-L4 and L5-L5 connections (Markram et al. 1997; Feldmeyer et al. 1999a; Feldmeyer & Sakmann, 2000).
Figure 8. Decrease of failure rate and coefficient of variation with increasing EPSP amplitude.

A, percentage of failures plotted as a function of the unitary EPSP peak amplitude in connections between L4 spiny neurones and L2/3 pyramidal cells. B, c.v. plotted as a function of the EPSP peak amplitude in L2/3 pyramidal cell neurones (n = 64). The two dashed lines in A and B represent the predictions of binomial release statistics for the percentage of failures as a function of EPSP amplitude with n = 5 contacts (close to the average number of contacts, Table 3) and quantal amplitudes of 0.04 mV (right) and) 0.4 mV (left).The release probability increases from 0.08 to 0.6 (right) and from 0.05 to 1.0 (left). The pr values refer to the two end-points of each curve.
Short-term plasticity and EPSP summation
To test the frequency dependence of synaptic transmission between L4 spiny neurones and L2/3 pyramidal cells, we recorded bursts of five unitary EPSPs at various frequencies (corresponding to intervals of 10, 30, 100, 300 and 1000 ms; n = 7). Figure 9A shows that EPSP trains in a L2/3 pyramidal cell were depressed at all burst frequencies tested. The EPSP amplitude ratio (i.e. the ratio of the 2nd, 3rd, 4th and 5th EPSP relative to the 1st EPSP) is plotted in Fig. 9B. For the 2nd EPSP the depression was relatively weak (close to unity, i.e. 0.90 ± 0.19 and 0.93 ± 0.25 for the 10 and 30 ms interstimulus intervals, respectively) but became progressively larger for successive EPSPs in the train and was particularly strong for the 5th EPSP in the train (0.25 ± 0.09 and 0.49 ± 0.18 for the 10 and 30 ms interstimulus intervals, respectively). However, for later interstimulus intervals the amplitude ratios converged to a value of ∼0.8.
Figure 9. Short-term plasticity and EPSP summation.
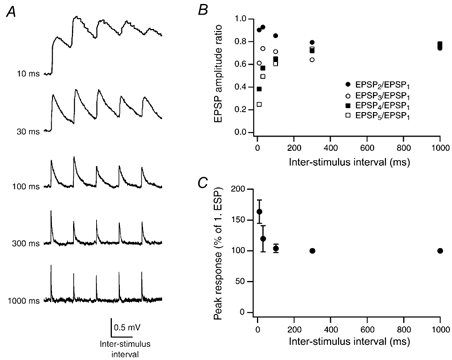
A, train of five EPSPs at different interstimulus intervals (10, 30, 100, 300 and 1000 ms as indicated to the left) with the EPSP rising phase superimposed. EPSP amplitude depression was apparent at all frequencies tested while summation of EPSPs is only apparent at interstimulus intervals of 10 and 30 ms. The horizontal scale bar corresponds to the interstimulus time of each train. B, amplitude ratios plotted as a function of the interstimulus interval. For short interstimulus intervals (10 and 30 ms), the baseline to determine the EPSP amplitudes in the train was obtained by linear extrapolation of the decay phase of the preceding EPSP. C, postsynaptic peak response as a fraction of the amplitude of the first EPSP in a train plotted as a function of the interstimulus interval. Only at interstimulus intervals of 10 and 30 ms was EPSP summation observed.
Despite the paired-pulse depression, EPSP summation was evident at interstimulus intervals of 10 and 30 ms with the peak response being reached during the 2nd to 4th EPSP (Fig. 9A and C). The peak response during the train was 163 ± 19 and 120 ± 21 % of the 1st EPSP at pulse intervals of 10 and 30 ms, respectively.
Morphology of synaptically coupled pairs of L4 spiny neurones and L2/3 pyramidal cells
From the 64 functionally characterised and biocytin-filled cell pairs, 13 pairs were selected for further analysis to determine the number, distribution and the dendritic distances of synaptic contacts. Of the postsynaptic L2/3 pyramidal cells chosen for morphological analysis, one third (n = 4) was located in the lower part of layer 2/3 while the remainder (n = 9) was in the upper part of layer 2/3. Two out of the 13 presynaptic L4 spiny neurones were star pyramidal cells and 11 were spiny stellate neurones (Table 3). While the spiny stellate cells display a clear dendritic asymmetry this was not the case for the star pyramidal cells (Gottlieb & Keller, 1997; Feldmeyer et al. 1999a; Lübke et al. 2000). The dendritic field span of L2/3 pyramidal cells, which were postsynaptic to L4 spiny neurones, was up to 300 μm; no obvious dendritic asymmetry was observed. The axonal field span was up to 2 mm and thus the axon projected into at least two neighbouring cortical columns (Fig. 13; J. Lübke, A. Roth, D. Feldmeyer & B. Sakmann, unpublished observation).
Table 3.
Number and distance from soma of putative synaptic contacts of L4 spiny neurone-L2/3 pyramidal cell pairs
| Pair no. | Presynaptic neurone | Postsynaptic neurone | No. of synaptic contacts | Mean dendritic distance (μm) | s.d. (μm) | Mean EPSP (mV) |
|---|---|---|---|---|---|---|
| 061098A | Spiny stellate cell | L2/3 pyramidal cell | 5 | 108.9 | 63.8 | 0.77 |
| 081098C | Spiny stellate cell | L2/3 pyramidal cell | 5 | 81.8 | 38.5 | 0.58 |
| 221098B | Spiny stellate cell | L2/3 pyramidal cell | 5 | 76.9 | 40.9 | 0.50 |
| 231098A | Spiny stellate cell | L2/3 pyramidal cell | 4 | 59.9 | 25.6 | 0.42 |
| 271098A | Spiny stellate cell | L2/3 pyramidal cell | 4 | 77.2 | 24.8 | 0.44 |
| 041198A | Spiny stellate cell | L2/3 pyramidal cell | 5 | 68.1 | 38.0 | 0.86 |
| 231198B | Star pyramidal cell | L2/3 pyramidal cell | 5 | 53.4 | 22.3 | 0.49 |
| 251198A | Spiny stellate cell | L2/3 pyramidal cell | 5 | 46.3 | 26.7 | 0.43 |
| 251198B | Star pyramidal cell | L2/3 pyramidal cell | 5 | 53.3 | 20.9 | 0.48 |
| 301198B | Spiny stellate cell | L2/3 pyramidal cell | 4 | 51.9 | 23.5 | 0.79 |
| 011000A | Spiny stellate cell | L2/3 pyramidal cell | 4 | 55.1 | 14.5 | 0.25 |
| 011000C | Spiny stellate cell | L2/3 pyramidal cell | 4 | 69.7 | 18.9 | 0.32 |
| 141200C | Spiny stellate cell | L2/3 pyramidal cell | 4 | 74.4 | 25.4 | 0.50 |
| N | 13 | 59.0 | 13.00 | |||
| Average | 4.5 | 67.2 | 0.53 | |||
| s.d. | 0.5 | 33.6 | 0.18 | |||
| s.e.m. | 0.1 | 4.4 | 0.05 | |||
| L4-L4 connections | 3.4 | 68.8 | 1.58 |
Figure 13. Geometric dendrogram of a pair of synaptically connected neurones.
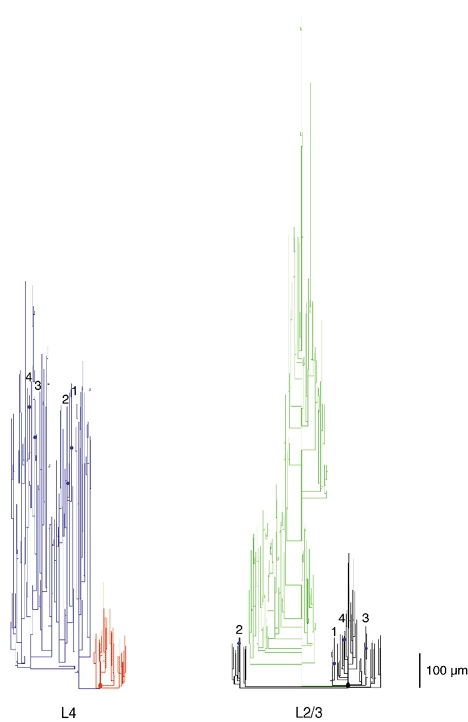
Geometric dendrogram of a L4-L2/3 synaptic connection. Right, dendritic (black) and axonal (green) arborisation of the postsynaptic L2/3 pyramidal cell. The blue circles indicate synaptic contacts. Left, dendritic (red) and axonal (blue) arborisation of the presynaptic L4 spiny stellate cell. Synaptic contacts are indicated by blue dots on both the presynaptic (blue) axon and the postsynaptic (black) dendrites. Numbers identify the axonal collaterals and dendritic branches between which synaptic contacts were established. Note that contacts are made preferentially on the thin basal dendrites.
Location of synaptic contacts
Figure 10A is a photomontage showing the dendritic configuration and axonal arborisation of a pair of L4 and L2/3 cells that were filled with biocytin during recording. Synaptic and autaptic contacts were identified following light microscopic examination as close apposition of postsynaptic dendrites and a presynaptic axon can be seen in Figs 10B–F.
Figure 10. Photomicrograph of a synaptically coupled L4 spiny stallate cell and a L2/3 pyramidal cell.
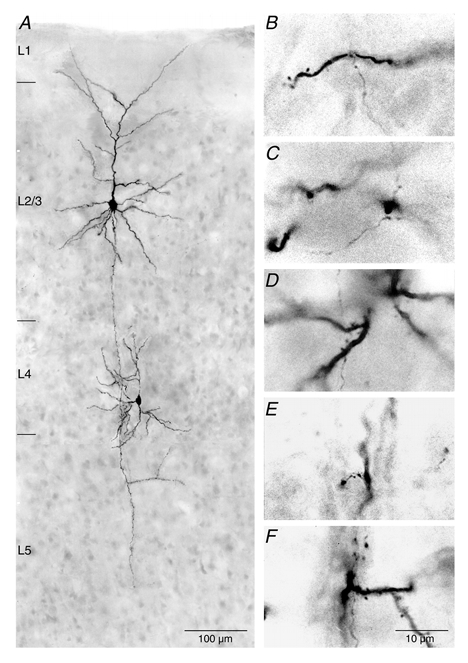
A, low magnification light microscopic image of a synaptically coupled L4 spiny stellate-L2/3 pyramidal cell pair filled with biocytin showing the dendritic configuration of the two neurones. Note the typical asymmetric dendritic configuration of the spiny stellate neurone that is confined to layer 4 whereas the pyramidal cell shows a symmetric basal dendritic field and an apical dendrite with an extensive terminal tuft. B-E, putative synaptic and F, autaptic contacts made by axon collaterals of L4 cells on dendrites of L2/3 pyramidal cells. Contacts were made preferentially on basal dendrites of pyramidal cells.
Figure 11 is a camera lucida reconstruction of the dendritic configuration and axonal projections of a different spiny stellate-L2/3 pyramidal cell pair. The axonal projection, and in particular the dendritic arborisation of the L4 spiny neurone, as well as the dendritic arborisation of the L2/3 pyramidal cell are largely confined to the ‘home’ column (as defined by the border of the barrel in layer 4: Lübke et al. 2000; J. Lübke, A. Roth, D. Feldmeyer & B. Sakmann, unpublished observation). In contrast, the axon of the pyramidal cells in layer 2/3 on the other hand clearly projects across these borders into adjacent columns. The dendritic location and distance of synaptic contacts from the soma was measured from the camera lucida drawings of dendritic and axonal profiles. The inset in Fig. 11 illustrates the location of the four putative synaptic contacts identified at the light microscopic level. Only the dendritic configuration of the target cell (black) is illustrated together with the location of putative synaptic contacts (blue dots). In the cell pair shown here all synaptic contacts were exclusively found on basal dendrites of different order. In general, the majority of synapses (85 %) was located on basal dendrites with only a small fraction found on apical oblique dendrites.
Serial EM analysis was performed to confirm that light microscopically identified contacts were indeed synaptic contacts. In the cell pair shown in Fig. 11, synaptic contacts could be verified at the EM level. Figure 12 shows synaptic boutons of the spiny stellate axon, clearly identifiable by their neurotransmitter vesicles, which are in close apposition with dendritic structures of the L2/3 pyramidal neurone. Synapses were either established directly on dendritic shafts (Fig. 12A–C) or on dendritic spines (Fig. 12D). In addition to the four synaptic contacts one autaptic contact was also found (not shown). In another L4-L2/3 cell pair, five of five synaptic contacts were confirmed at the EM level confirming that the light microscopic predictions were accurate.
The corresponding geometric dendrogram (Fig. 13) that was constructed for a different pair of neurones by three-dimensional computer-aided reconstruction illustrates the short distance of putative synaptic contacts from the soma as well as the long axonal pathway of the presynaptic neurone.
Relation between functional properties and morphology
Between four and five putative synaptic contacts were apparent in the 13 pairs that were reconstructed (4.5 ± 0.5; Table 3, Fig. 14A inset). The mean geometric distance of synaptic contacts on these dendrites from the soma was 67.2 ± 33.6 μm (minimum, 16.2 μm; maximum, 196.2 μm).
Figure 14. Location of synaptic contacts on dendrites.

A, histogram of geometric distances from the somata of visually (i.e. on the light microscopic level) identified putative synaptic contacts in 13 pairs of L4 spiny neurone-L2/3 pyramidal cells. Inset, distribution of number of synaptic contacts per connection. B, relationship between unitary EPSP amplitude in L2/3 pyramidal cells and the number of synaptic contacts per connection. The correlation coefficient r obtained for (B) was 0.434 and the slope was 0.0813 mV contact−1. C, relationship between unitary EPSP amplitude and the dendritic mean geometric distance of synaptic contacts in a connection. The correlation coefficient r was 0.565 and the slope 0.00432 mVμm−1. For both graphs, the correlation was not statistically significant.
As there is little variation in both EPSP amplitude and number of synaptic contacts, it is not possible to judge whether a correlation exists between the number of synaptic contacts per connection and the mean EPSP amplitude (Fig. 14B). Similar to L5 pyramidal cells (but contrary to the finding for L4 spiny neurone pairs), there was no significant positive correlation between EPSP amplitude and the geometric distance of synaptic contacts from the soma (Fig. 14C). The large differences in the mean amplitude of unitary EPSPs between different L4 connections may therefore be determined to a significant degree by differences in the functional properties of the projection and the target cell, rather than by differences in their morphology, as has been suggested previously for connections between L5 pyramidal cells and L4 spiny neurones (Markram et al. 1997; Feldmeyer et al. 1999a).
DISCUSSION
We have used paired recordings and reconstruction techniques to characterise the functional and anatomical properties of excitatory synaptic connections made by L4 spiny neurone axonal collaterals with dendrites of L2/3 pyramidal cells in the barrel cortex of the rat. We find that L4-L2/3 connections are unidirectional, have small unitary EPSP amplitude (0.7 mV), a low c.v. (0.27), and are mediated by only four or five synaptic contacts which are predominantly located on the basal dendrites of the pyramidal cells.
At low stimulation frequencies (e.g. 1 s−1) 45–50 L4 spiny neurones need to be active almost simultaneously in order to generate an AP in the L2/3 pyramidal cell (given a resting potential of −75 to −80 mV, a mean unitary EPSP of 0.7 mV and an amplitude ratio of 0.8 during repetitive activation). The number of active L4 neurones necessary to fire a L2/3 pyramidal cell is higher the weaker their activity is correlated in time. However, if L4 spiny neurones fire in high frequency bursts, summation will override synaptic depression and a lower number (20–30) of L4 spiny neurones is required to fire the L2/3 pyramidal cell. Moreover, the time window for the summation of L4 activity is broader under this condition. Although the absolute number of active connections required may differ under in vivo conditions our estimates suggest that interlaminar signalling occurs only when a relatively large number of L4 neurones is active. The low variability of unitary EPSPs, which are mediated by four or five synaptic contacts located close to the soma, and their rather uniform latencies suggests that the L2/3 pyramidal cell may be well placed to report the activity of the granular layer within the column once it is above threshold level. Furthermore, the long-range axonal projection of L2/3 pyramidal cells is able to distribute such information to neighbouring barrels. This contrasts with L4-L4 connections where reciprocal excitation and a relatively low threshold (Feldmeyer et al. 1999a) is likely to boost thalamic excitation (Stratford et al. 1996; Feldmeyer et al. 1999a; Tarczy-Hornoch et al. 1999; Petersen & Sakmann, 2000).
Connectivity within a cortical column
The present results together with those of the axonal morphology of L4 spiny neurones (Lübke et al. 2000, 2001) provide the cellular basis for a largely columnar spread of excitation between layers 4 and 2/3. They are supported by deoxyglucose and intrinsic imaging studies (McCasland & Woolsey, 1988; Woolsey et al. 1996) demonstrating that in the barrel cortex, suprathreshold excitation following stimulation of a single principal whisker, is mainly confined to a cortical column. Using voltage-sensitive dye imaging in the thalamocortical slice, Laaris et al. (2000) showed that following thalamic stimulation excitation remained within a single barrel; no spread to supragranular layers was observed. However, this rather localised spread of excitation contrasts sharply with recent receptive field studies showing that even at the level of layer 4 (and more so at the level of layer 2/3) excitatory neurones of a barrel have multi-vibrissae receptive fields, both at the suprathreshold (Ito, 1985; Chapin, 1986; Armstrong-James & Fox, 1987; Armstrong-James et al. 1992) and the subthreshold level (Moore & Nelson, 1998; Zhu & Connors, 1999; Brecht & Sakmann, 2000; for a review see Moore et al. 1999). In addition, the representational area of a single whisker in the somatosensory cortex is larger than the dimensions of a single barrel column as shown by imaging studies (Orbach et al. 1985; Grinvald et al. 1986; Masino et al. 1993; Masino & Frostig, 1996, Kleinfeld & Delaney, 1996). Masino & Frostig (1996) reported that the spatial extent of the functional whisker representation was about 10 times the size of the respective cortical barrel. Furthermore, recent results by Petersen & Diamond (2000) using multi-electrode arrays suggest that single-whisker deflections are represented in a multi-columnar region (2–11 barrel columns). This discrepancy may to some extent be due to the different whisker to cortex pathways with four different trigeminal relay nuclei and two thalamic nuclei (ventroposterior medial nucleus and posteriormedial nucleus; Koralek et al. 1988; Chmielowska et al. 1989; Lu & Lin, 1993; Ahissar et al. 2000). There may also be some intracortical contribution, via the long-range axonal collaterals of L2/3 pyramidal cells (Fig. 14; Gilbert & Wiesel, 1979; 1983; Rockland & Lund, 1982) that may be the anatomical correlate for the time-dependent intracortical signal transformation (see below). In addition, a separate neural network in the septa between barrels and from L5 and L6 pyramidal cells (that receive also thalamic input; White & Keller, 1987; Lu & Lin, 1993; Gottlieb & Keller, 1997) as reported for the visual cortex (McGuire et al. 1984; Ahmed et al. 1994; Schubert et al. 2000; Briggs & Callaway, 2001; for review see Callaway, 1998) may play a part in shaping the representation of the sensory signal.
NMDAR/AMPAR ratio
In the different connections made by L4 spiny neurones with excitatory neurones, i.e. with other L4 spiny neurones and supragranular L2/3 pyramidal cells, synaptic transmission is mediated by both AMPAR and NMDAR channels (Fleidervish et al. 1998; Feldmeyer et al. 1999a). The average peak amplitudes of EPSCs in L4 and in L2/3 neurones were significantly different, the value in L4 spiny stellate cells being 34 pA, that in L2/3 pyramidal cells being 65 pA. The ratio of NMDAR to AMPAR currents derived from unitary EPSCs in the L4-L2/3 synapses varied considerably between different unitary connections (from 0.24 to 1.17) and was on average 0.50 ± 0.29 (n = 12). It has been suggested that the NMDA component of synaptic transmission in layer 4 has a low Mg2+ sensitivity (Fleidervish et al. 1998); however, even in nominally Mg2+-free solution the NMDAR/AMPAR ratios of the EPSC were clearly smaller for the L4-L2/3 connections than for the L4-L4 connections.
The NMDAR/AMPAR ratio of the EPSC at the L4-L2/3 connection is about one half of the value determined for unitary EPSCs in L4-L4 synapses (0.94; Feldmeyer et al. 1999a). One could argue that what is functionally important is the relative contribution that NMDA and AMPA channels make to the EPSP recorded at the soma (close to the site of AP generation; Stuart et al. 1997) in these two cell types. Our data show that at −60 mV only 16 % of the EPSP amplitude and 29 % of the EPSP integral is contributed by NMDARs in the L2/3 pyramidal cell. This contrasts with L4-L4 connections where the NMDA component constitutes 39 % of the EPSP amplitude and 43 % of the EPSP integral (Feldmeyer et al. 1999a). One may speculate that the larger NMDA component of the EPSP in L4 spiny neurones as compared to L2/3 pyramidal cells is important in mediating the different functions of the two connections: amplification of thalamic activity in layer 4 and an activity-dependent ‘gate’ to layer 2/3.
Comparison with previous work
Among the different unitary excitatory connections between neurones in the same and in different layers in a column of the somatosensory cortex (specifically L4-L4: Feldmeyer et al. 1999a; L4-L2/3: This work; L2/3-L2/3 and L2/3-L5: Thomson & Bannister, 1998; Reyes & Sakmann, 1999 and L5-L5: Thomson et al. 1993; Markram et al. 1997; Thomson & Bannister, 1998) synaptic connections between cells within the input layer (L4) and within the output layer of a column (L5) have the highest efficacy (mean unitary EPSP of 1.6 and 1.3–1.7 mV, respectively, vs. 0.7 mV for the L4-L2/3 connection). The number of synaptic contacts found for the L4-L2/3 connection (4.5; see Table 3) was intermediate between that of neighbouring synaptically coupled L5 pyramidal cells (5.5; Table 3 and Fig. 7 in Markram et al. 1997) and that of synaptically coupled L4 spiny neurones (3.4, Table 2 and Fig. 16 in Feldmeyer et al. 1999a). However, the distance of synaptic contacts from the soma was similar for the L4-L2/3 and the L4-L4 connections but much shorter than in L5-L5 pyramidal cell connections (L4-L2/3, 67 μm; L4-L4, 69 μm; L5-L5, 147 μm). At the input layer 4, the high efficacy of the L4-L4 connections is one factor in amplifying the thalamic input, a step necessary for the vertical signal flow within a column (Feldmeyer et al. 1999a) as has also been suggested for the visual cortex (McGuire et al. 1984; Douglas & Martin, 1991; Hirsch, 1995; Stratford et al. 1996). When the network of L4 spiny neurones is not sufficiently activated, the low efficacy of L4-L2/3 connections may result in failure of further transmission in layer 2/3. This interpretation fits to some extent with in vivo recordings by Brumberg and co-workers (1999) who showed that sparse stimuli had a weaker effect in layer 2/3 than in layer 4. In contrast, strong stimuli activated neurones throughout all cortical laminae (Brumberg et al. 1999; Zhu & Connors, 1999).
A noteworthy feature of the excitatory intracortical connections investigated in paired recording studies so far appears to be their comparatively high reliability (c.v. between 0.27 and 0.52) even when their efficacy (i.e. the mean unitary EPSP amplitude) is small (this study; Thomson et al. 1993; Thomson & West, 1993; Stratford et al. 1996; Markram et al. 1997; Thomson & Bannister, 1998; Feldmeyer et al. 1999a; Reyes & Sakmann, 1999). A higher c.v. of 0.80 was only reported by Deuchars et al. (1994); however, in this case the number of putative synaptic contacts was reported to be only 2. Thus, intracortical connections are markedly more reliable than hippocampal CA3-CA1 connections which exhibit a high percentage of failures (e.g. Stevens & Wang, 1994). Synaptic connections with a very high reliability are thalamocortical inputs to layer 4 (Stratford et al. 1996; Gil et al. 1999) although some cortical connections, in particular the L4-L2/3 connection described here, appear almost as reliable.
Conclusion
In summary, we have characterised the functional and anatomical properties of unitary L4-L2/3 connections using paired recordings from acute slices of rat barrel cortex. Our results show that synaptic connections between L4 spiny neurones and L2/3 pyramidal cells are unidirectional, very reliable but have a low efficacy. These synaptic characteristics may therefore be tuned to report the network activity of excitatory spiny neurones in layer 4, the targets of thalamic afferents, once it rises above a threshold level. In turn, once the AP threshold has been reached in the postsynaptic L2/3 pyramidal cell, excitation spreads horizontally in layer 2/3.
Acknowledgments
We thank Drs Helmchen and Petersen for comments on the manuscript. The technical assistance of M. Kaiser, S. Nestel, B. Joch, M. Werner and I. Dehof is gratefully acknowledged. The work was supported by the Max-Planck Society, the Wellcome Trust (R.A.S.) and the Deutsche Forschungsgemeinschaft (SFB488 Project D1, D. F. and B. S.).
REFERENCES
- Agmon A, Connors BW. Thalamocortical responses of mouse somatosensory (barrel) cortex in vitro. Neuroscience. 1991;41:365–380. doi: 10.1016/0306-4522(91)90333-j. [DOI] [PubMed] [Google Scholar]
- Ahissar E, Sosnik R, Haidarliu S. Transformation from temporal to rate coding in a somatosensory thalamocortical pathway. Nature. 2000;406:302–306. doi: 10.1038/35018568. [DOI] [PubMed] [Google Scholar]
- Ahmed B, Anderson JC, Douglas RJ, Martin KAC, Nelson JC. Polyneuronal innervation of spiny stellate neurons in cat visual cortex. Journal of Comparative Neurology. 1994;341:39–49. doi: 10.1002/cne.903410105. [DOI] [PubMed] [Google Scholar]
- Armstrong-James M, Fox K. Spatiotemporal convergence and divergence in the rat S1 ‘barrel’ cortex. Journal of Comparative Neurology. 1987;263:265–281. doi: 10.1002/cne.902630209. [DOI] [PubMed] [Google Scholar]
- Armstrong-James M, Fox K, Das-Gupta A. Flow of excitation within rat barrel cortex on striking a single vibrissa. Journal of Neurophysiology. 1992;68:1345–1358. doi: 10.1152/jn.1992.68.4.1345. [DOI] [PubMed] [Google Scholar]
- Brecht M, Sakmann B. Receptive fields of identified excitatory neurones in layer IV of rat barrel cortex. Proceedings of the XX Annual General Meeting of the Society for Neurosciences. 2000;22106:788.7. [Google Scholar]
- Briggs F, Callaway EM. Layer-specific input to distinct cell types in layer 6 of monkey primary visual cortex. Journal of Neuroscience. 2001;21:3600–3608. doi: 10.1523/JNEUROSCI.21-10-03600.2001. [DOI] [PMC free article] [PubMed] [Google Scholar]
- Brumberg JC, Pinto DJ, Simons DJ. Cortical columnar processing in the rat whisker-to-barrel system. Journal of Neurophysiology. 1999;82:1808–1817. doi: 10.1152/jn.1999.82.4.1808. [DOI] [PubMed] [Google Scholar]
- Callaway EM. Local circuits in primary visual cortex of the macaque monkey. Annual Review of Neuroscience. 1998;21:47–74. doi: 10.1146/annurev.neuro.21.1.47. [DOI] [PubMed] [Google Scholar]
- Chapin JK. Laminar differences in shape, size and response profiles of cutaneous receptive fields in rat SI cortex. Experimental Brain Research. 1986;91:502–523. doi: 10.1007/BF00236033. [DOI] [PubMed] [Google Scholar]
- Chmielowska J, Carvell GE, Simons DJ. Spatial organization of thalamocortical and corticothalamic projection systems in the rat SmI barrel cortex. Journal of Comparative Neurology. 1989;285:325–338. doi: 10.1002/cne.902850304. [DOI] [PubMed] [Google Scholar]
- Deuchars J, West DC, Thomson AM. Relationships between morphology and physiology of pyramid-pyramid single axon connections in rat neocortex in vitro. Journal of Physiology. 1994;478:423–435. doi: 10.1113/jphysiol.1994.sp020262. [DOI] [PMC free article] [PubMed] [Google Scholar]
- Diamond ME, Petersen RS, Harris JA. Learning through maps: functional significance of topographic organization in primary sensory cortex. Journal of Neurobiology. 1999;41:64–68. [PubMed] [Google Scholar]
- Douglas RJ, Martin KAC. A functional microcircuit for cat visual cortex. Journal of Physiology. 1991;440:735–769. doi: 10.1113/jphysiol.1991.sp018733. [DOI] [PMC free article] [PubMed] [Google Scholar]
- Feldmeyer D, Egger V, Lübke J, Sakmann B. Synaptic connections between excitatory layer 4 neurones in the ‘barrel field’ of rat somatosensory cortex. Journal of Physiology. 1999a;521:169–190. doi: 10.1111/j.1469-7793.1999.00169.x. [DOI] [PMC free article] [PubMed] [Google Scholar]
- Feldmeyer D, Sakmann B. Synaptic efficacy and reliability of excitatory connections between the principal neurones of the input (layer 4) and output layer (layer 5) of the neocortex. Journal of Physiology. 2000;525:31–39. doi: 10.1111/j.1469-7793.2000.00031.x. [DOI] [PMC free article] [PubMed] [Google Scholar]
- Feldmeyer D, Silver RA, Lübke J, Sakmann B. Synaptic connections between spiny layer 4 neurones and layer 2/3 pyramidal cells of rat barrel cortex. Journal of Physiology. 1999b;518:141–142P. [Google Scholar]
- Fleidervish IA, Binshtok AM, Gutnick MJ. Functionally distinct NMDA receptors mediate horizontal connectivity within layer 4 of mouse barrel cortex. Neuron. 1998;21:1055–11065. doi: 10.1016/s0896-6273(00)80623-6. [DOI] [PubMed] [Google Scholar]
- Gil Z, Connors BW, Amitai Y. Efficacy of thalamocortical and intracortical synaptic connections: quanta, innervation, and reliability. Neuron. 1999;23:385–397. doi: 10.1016/s0896-6273(00)80788-6. [DOI] [PubMed] [Google Scholar]
- Gilbert CD, Wiesel TN. Morphology and intracortical projections of functionally characterised neurones in the cat visual cortex. Nature. 1979;280:120–125. doi: 10.1038/280120a0. [DOI] [PubMed] [Google Scholar]
- Gilbert CD, Wiesel TN. Clustered intrinsic connections in cat visual cortex. Journal of Neuroscience. 1983;3:1116–1133. doi: 10.1523/JNEUROSCI.03-05-01116.1983. [DOI] [PMC free article] [PubMed] [Google Scholar]
- Gottlieb JP, Keller A. Intrinsic circuitry and physiological properties of pyramidal neurons in rat barrel cortex. Experimental Brain Research. 1997;115:47–60. doi: 10.1007/pl00005684. [DOI] [PubMed] [Google Scholar]
- Grinvald A, Lieke E, Frostig RD, Gilbert CD, Wiesel TN. Functional architecture of cortex revealed by optical imaging of intrinsic signals. Nature. 1986;324:361–364. doi: 10.1038/324361a0. [DOI] [PubMed] [Google Scholar]
- Harris RM, Woolsey TA. Dendritic plasticity in mouse barrel cortex following postnatal vibrissa follicle damage. Journal of Comparative Neurology. 1981;196:357–376. doi: 10.1002/cne.901960302. [DOI] [PubMed] [Google Scholar]
- Hirsch JA. Synaptic integration in layer 4 of the ferret striate cortex. Journal of Physiology. 1995;483:183–199. doi: 10.1113/jphysiol.1995.sp020577. [DOI] [PMC free article] [PubMed] [Google Scholar]
- Hubel DH, Wiesel TN. Receptive fields, binocular interaction and functional architecture in the cat's visual cortex. Journal of Physiology. 1962;160:106–154. doi: 10.1113/jphysiol.1962.sp006837. [DOI] [PMC free article] [PubMed] [Google Scholar]
- Ito M. Processing of vibrissa sensory information within the rat neocortex. Journal of Neurophysiology. 1985;54:479–490. doi: 10.1152/jn.1985.54.3.479. [DOI] [PubMed] [Google Scholar]
- Jones EG, Diamond IT. The Barrel Cortex of Rodents. New York: Plenum Press; 1995. [Google Scholar]
- Kleinfeld D, Delaney KR. Distributed representation of vibrissa movement in the upper layers of somatosensory cortex revealed with voltage-sensitive dyes. Journal of Comparative Neurology. 1996;375:89–108. doi: 10.1002/(SICI)1096-9861(19961104)375:1<89::AID-CNE6>3.0.CO;2-K. [DOI] [PubMed] [Google Scholar]
- Koralek KA, Jensen KF, Killackey HP. Evidence for two complementary patterns of thalamic input to the somatosensory cortex. Brain Research. 1988;463:346–351. doi: 10.1016/0006-8993(88)90408-8. [DOI] [PubMed] [Google Scholar]
- Laaris N, Carlson GC, Keller A. Thalamic-evoked synaptic interactions in barrel cortex revealed by optical imaging. Journal of Neuroscience. 2000;20:1529–1537. doi: 10.1523/JNEUROSCI.20-04-01529.2000. [DOI] [PMC free article] [PubMed] [Google Scholar]
- Lu SM, Lin RC. Thalamic afferents of the rat barrel cortex: a light- and electron-microscopic study using Phaseolus vulgaris leucoagglutinin as an anterograde tracer. Somatosensory and Motor Research. 1993;10:1–16. doi: 10.3109/08990229309028819. [DOI] [PubMed] [Google Scholar]
- Lübke J, Egger V, Sakmann B, Feldmeyer D. Morphology of synaptically coupled spiny stellate and star pyramidal neurons in the barrel field in layer 4 of the rat somato-sensory cortex. Journal of Neuroscience. 2000;20:5300–5311. doi: 10.1523/JNEUROSCI.20-14-05300.2000. [DOI] [PMC free article] [PubMed] [Google Scholar]
- McCasland JS, Woolsey TA. High resolution 2-deoxyglucose mapping of functional cortical columns in mouse barrel cortex. Journal of Comparative Neurology. 1988;278:555–569. doi: 10.1002/cne.902780407. [DOI] [PubMed] [Google Scholar]
- McGuire BA, Hornung JP, Gilbert CD, Wiesel TN. Patterns of synaptic input to layer 4 of cat striate cortex. Journal of Neuroscience. 1984;4:3021–3033. doi: 10.1523/JNEUROSCI.04-12-03021.1984. [DOI] [PMC free article] [PubMed] [Google Scholar]
- Markram H, Lübke J, Frotscher M, Roth A, Sakmann B. Physiology and anatomy of synaptic connections between thick-tufted pyramidal neurones in the developing rat neocortex. Journal of Physiology. 1997;500:409–440. doi: 10.1113/jphysiol.1997.sp022031. [DOI] [PMC free article] [PubMed] [Google Scholar]
- Masino SA, Frostig RD. Quantitative long-term imaging of the functional representation of a whisker in rat barrel cortex. Proceedings of the National Academy of Sciences of the USA. 1996;93:4942–4947. doi: 10.1073/pnas.93.10.4942. [DOI] [PMC free article] [PubMed] [Google Scholar]
- Masino SA, Kwon MC, Dory Y, Frostig RD. Characterization of functional organization within rat barrel cortex using intrinsic signal optical imaging through a thinned skull. Proceedings of the National Academy of Sciences of the USA. 1993;90:9998–10002. doi: 10.1073/pnas.90.21.9998. [DOI] [PMC free article] [PubMed] [Google Scholar]
- Monyer H, Burnashev N, Laurie DJ, Sakmann B, Seeburg PH. Developmental and regional expression in the rat brain and functional properties of four NMDA receptors. Neuron. 1994;12:529–540. doi: 10.1016/0896-6273(94)90210-0. [DOI] [PubMed] [Google Scholar]
- Moore CI, Nelson SB. Spatio-temporal subthreshold receptive fields in the vibrissa representation of rat primary somatosensory cortex. Journal of Neurophysiology. 1998;80:2882–2892. doi: 10.1152/jn.1998.80.6.2882. [DOI] [PubMed] [Google Scholar]
- Moore CI, Nelson SB, Sur M. Dynamics of neuronal processing in rat somatosensory cortex. Trends in Neurosciences. 1999;22:513–520. doi: 10.1016/s0166-2236(99)01452-6. [DOI] [PubMed] [Google Scholar]
- Mountcastle VB. Modality and topographic properties of single neurons of cat's somatosensory cortex. Journal of Neurophysiology. 1957;20:408–434. doi: 10.1152/jn.1957.20.4.408. [DOI] [PubMed] [Google Scholar]
- Mountcastle VB. The columnar organization of the neocortex. Brain. 1997;120:701–722. doi: 10.1093/brain/120.4.701. [DOI] [PubMed] [Google Scholar]
- Mountcastle VB, Powell TPS. Neural mechanisms subserving cutaneous sensibility, with special reference to the role of afferent inhibition in sensory perception and discrimination. Bulletins of Johns Hospital. 1959;105:201–232. [PubMed] [Google Scholar]
- Orbach HS, Chen LB, Grinvald A. Optical mapping of electrical activity in rat somatosensory and visual cortex. Journal of Neuroscience. 1985;5:1886–1895. doi: 10.1523/JNEUROSCI.05-07-01886.1985. [DOI] [PMC free article] [PubMed] [Google Scholar]
- Petersen CH, Sakmann B. The excitatory network of rat layer 4 barrel cortex. Journal of Neuroscience. 2000;20:7579–7586. doi: 10.1523/JNEUROSCI.20-20-07579.2000. [DOI] [PMC free article] [PubMed] [Google Scholar]
- Petersen RS, Diamond ME. Spatial-temporal distribution of whisker-evoked activity in rat somatosensory cortex and the coding of stimulus location. Journal of Neuroscience. 2000;20:6135–6143. doi: 10.1523/JNEUROSCI.20-16-06135.2000. [DOI] [PMC free article] [PubMed] [Google Scholar]
- Reyes A, Lujan R, Rozov A, Burnashev N, Somogyi P, Sakmann B. Target-cell-specific facilitation and depression in neocortical circuits. Nature Neuroscience. 1998;1:279–285. doi: 10.1038/1092. [DOI] [PubMed] [Google Scholar]
- Reyes A, Sakmann B. Developmental switch in the short-term modification of unitary EPSPs evoked in layer 2/3 and layer 5 pyramidal neurones of rat neocortex. Journal of Neuroscience. 1999;19:3827–3835. doi: 10.1523/JNEUROSCI.19-10-03827.1999. [DOI] [PMC free article] [PubMed] [Google Scholar]
- Rockland KS. Complex microstructures of sensory cortical connections. Current Opinion in Neurobiology. 1998;8:545–551. doi: 10.1016/s0959-4388(98)80044-5. [DOI] [PubMed] [Google Scholar]
- Rockland KS, Lund JS. Widespread periodic intrinsic connections in the tree shrew visual cortex. Science. 1982;215:1532–1534. doi: 10.1126/science.7063863. [DOI] [PubMed] [Google Scholar]
- Schubert D, Staiger JF, Cho N, KÖtter R, Zilles K, Luhmann HJ. Layer-specific intracolumnar and transcolumnar functional connectivity of layer V pyramidal cells in rat barrel cortex. Journal of Neuroscience. 2001;21:3580–3592. doi: 10.1523/JNEUROSCI.21-10-03580.2001. [DOI] [PMC free article] [PubMed] [Google Scholar]
- Simons DJ. Response properties of vibrissa units in rat SI somatosensory neocortex. Journal of Neurophysiology. 1978;41:798–820. doi: 10.1152/jn.1978.41.3.798. [DOI] [PubMed] [Google Scholar]
- Simons DJ, Woolsey TA. Morphology of Golgi-Cox impregnated barrel neurons in rat Sm1 cortex. Journal of Comparative Neurology. 1984;230:119–132. doi: 10.1002/cne.902300111. [DOI] [PubMed] [Google Scholar]
- Stern P, Edwards F, Sakmann B. Fast and slow components of unitary EPSCs on stellate cells elicited by focal stimulation in slices of rat visual cortex. Journal of Physiology. 1992;449:247–278. doi: 10.1113/jphysiol.1992.sp019085. [DOI] [PMC free article] [PubMed] [Google Scholar]
- Stevens CF, Wang Y. Changes in reliability of synaptic function as a mechanism for plasticity. Nature. 1994;371:704–707. doi: 10.1038/371704a0. [DOI] [PubMed] [Google Scholar]
- Stratford KJ, Tarczy-Hornoch K, Martin KAC, Bannister NJ, Jack JJ. Excitatory synaptic inputs to spiny stellate cells in cat visual cortex. Nature. 1996;382:258–261. doi: 10.1038/382258a0. [DOI] [PubMed] [Google Scholar]
- Stuart G, Schiller J, Sakmann B. Action potential initiation and propagation in rat neocortical pyramidal neurons. Journal of Physiology. 1997;505:617–632. doi: 10.1111/j.1469-7793.1997.617ba.x. [DOI] [PMC free article] [PubMed] [Google Scholar]
- Tarczy-Hornoch K, Martin KAC, Stratford KJ, Jack JJB. Intracortical excitation of spiny neurons in layer 4 of cat striate cortex in vitro. Cerebral Cortex. 1999;9:833–843. doi: 10.1093/cercor/9.8.833. [DOI] [PubMed] [Google Scholar]
- Thomson AM, Bannister AP. Postsynaptic pyramidal target selction by descending layer III pyramidal axons: dual intracellular recordings and biocytin filling in slices of rat neocortex. Neuroscience. 1998;84:669–683. doi: 10.1016/s0306-4522(97)00557-5. [DOI] [PubMed] [Google Scholar]
- Thomson AM, Deuchars J, West DC. Large, deep-layer pyramid-pyramid single axon EPSPs in slices of rat motor cortex display paired pulse and frequency-dependent depression, mediated presynaptically and self-facilitation, mediated postsynaptically. Journal of Neurophysiology. 1993;70:2354–2369. doi: 10.1152/jn.1993.70.6.2354. [DOI] [PubMed] [Google Scholar]
- Thomson AM, West DC. Fluctuations in pyramid-pyramid excitatory postsynaptic potentials modified by postsynaptic firing pattern and postsynaptic membrane potential using paired intracellular recordings in rat neocortex. Neuroscience. 1993;54:329–346. doi: 10.1016/0306-4522(93)90256-f. [DOI] [PubMed] [Google Scholar]
- White EL, Keller A. Intrinsic circuitry involving the local axon collaterals of corticothalamic projection cells in mouse SmI cortex. Journal of Comparative Neurology. 1997;262:13–26. doi: 10.1002/cne.902620103. [DOI] [PubMed] [Google Scholar]
- Woolsey TA, Rovainen CM, Cox SB, Henegar MH, Liang GE, Liu D, Moskalenko YE, Sui J, Wei L. Neuronal units linked to microvascular modules in cerebral cortex: response elements for imaging the brain. Cerebral Cortex. 1996;6:647–660. doi: 10.1093/cercor/6.5.647. [DOI] [PubMed] [Google Scholar]
- Woolsey TA, VanDerLoos H. The structural organization of layer IV in the somatosensory region (SI) of mouse cerebral cortex: the description of a cortical field composed of discrete cytoarchitectonic units. Brain Research. 1970;17:205–242. doi: 10.1016/0006-8993(70)90079-x. [DOI] [PubMed] [Google Scholar]
- Zhu JJ, Connors BW. Intrinsic firing patterns and whisker-evoked synaptic responses of neurons in rat barrel cortex. Journal of Neurophysiology. 1999;81:1171–1183. doi: 10.1152/jn.1999.81.3.1171. [DOI] [PubMed] [Google Scholar]