

Abstract
We undertook this study to determine whether low intensity exercise (55 % V̇O2,max) would significantly alter the metabolic and ventilatory responses observed during 10 min of subsequent moderate intensity exercise (75 % V̇O2,max). By executing this work, we hoped to further our understanding of the mechanisms that limit mitochondrial ATP production at the onset of exercise. Seven healthy human subjects performed 10 min of moderate intensity exercise in the presence and absence of 10 min of low intensity exercise, which preceded the moderate intensity exercise by 3 min. Muscle biopsy samples were obtained from the vastus lateralis at pre-determined time points and oxygen consumption kinetics were determined at rest and during low and moderate intensity exercise. Following low intensity exercise and 3 min of passive recovery, muscle lactate and acetylcarnitine concentrations were elevated above basal levels, but V̇O2 had returned to the resting rate. When moderate intensity exercise was preceded by low intensity exercise, there was a significant sparing of phosphocreatine (PCr, ∼25 %, P < 0.05) and reductions in glucose 6-phosphate (G-6-P, ∼50 %, P < 0.05) and lactate (∼50 %, P < 0.05) accumulation during the first minute of moderate intensity exercise. No differences were observed after 10 min of moderate intensity exercise. The V̇O2 on-kinetic response over the first minute of moderate intensity exercise was accelerated when preceded by low intensity exercise. Collectively, our results suggest the lag in the oxidative ATP delivery at the onset of moderate intensity exercise can be overcome by prior low intensity exercise. Furthermore, our findings support the view that this lag is at least in part attributable to a limitation in acetyl group delivery/availability at the onset of exercise, rather than delayed oxygen supply.
Adenosine triphosphate (ATP) turnover during exercise is maintained by both oxidative (mitochondrial) and non-oxidative (PCr and glycolytic) resynthesis pathways. At the onset of sub-maximal exercise a lag exists in mitochondrial ATP provision, resulting in the concomitant activation of non-oxidative ATP delivery. It is generally accepted that this lag in oxidative ATP delivery resides at the level of muscle oxygen delivery. Indeed, several studies have been published recently supporting the existence of an oxygen transport limitation to exercising muscle at the onset of exercise (Knight et al. 1993; Richardson et al. 1995, 1999; MacDonald et al. 1997). However, in contrast to these studies, there is an increasing amount of evidence becoming available to suggest that neither muscle O2 supply (via blood flow delivery) nor capillary diffusion limits muscle oxygen utilisation at the onset of exercise (Yoshida et al. 1995; Grassi et al. 1998a,b). The findings of these investigators support the contention that inertia in mitochondrial ATP delivery limits V̇O2 on-kinetics, rather than O2 availability per se.
Previous work of our own (Timmons et al. 1998a,b) and of others (Howlett et al. 1998, 1999) has focused on the role of the pyruvate dehydrogenase complex (PDC) in the rest-to-exercise transition period. In particular, investigations in our laboratory using dichloroacetate (DCA; a potent inhibitor of PDC kinase and therefore a PDC activator) have shown improvements in muscle contractile function that were preceded by reductions in PCr degradation and glycolysis during the rest to exercise transition period, suggesting a faster onset of oxidative ATP delivery during this period following DCA (Timmons et al. 1998a,b). From these investigations, it was concluded that flux through the PDC, and therefore acetyl-CoA availability, may limit mitochondrial ATP production at the onset of exercise and that ‘priming’ of mitochondria with acetyl groups by administering DCA prior to exercise could significantly increase the overall contribution of oxidative pathways at the onset of exercise.
Low intensity exercise has been shown to have a range of physiological and biochemical effects during a subsequent bout of exercise (Martin et al. 1975; Essen & Kaijser, 1978; Genovely & Stamford 1982; Robergs et al. 1991). However, in the light of our previous investigations using DCA (Timmons et al. 1998a,b), we hypothesised that low intensity exercise would result in muscle acetyl group accumulation and thereby would accelerate mitochondrial ATP production (and reduce ATP production from non-oxidative routes) during a subsequent bout of moderate intensity exercise. In accordance with these changes, we also hypothesised that the V̇O2 on-kinetics during moderate intensity exercise would be accelerated when preceded by low intensity exercise. By executing this work, we hoped to further advance our understanding of the mechanisms that limit mitochondrial ATP production at the onset of exercise.
METHODS
Subjects
Seven males (age 23 ± 2 years; height 181 ± 3 cm; body mass 76 ± 5 kg) of an average fitness level (V̇O2,max 55.5 ± 1.3 ml (kg body mass)−1 min−1) volunteered to participate in these investigations. All subjects were physically active in recreational sporting activities, but were not involved in formal physical training for a designated sport. Subjects were advised of the rationale for the investigation and were aware that they were free to withdraw from the study at any time. All associated risks of procedures used in the study were discussed with each subject and written consent was obtained before commencement of the study. This study was approved by the Ethics Committee of the University of Nottingham Medical School and conformed with the Declaration of Helsinki.
V̇O2,max determination
Subjects initially visited the laboratory on two occasions. During these visits subjects were familiarised with the procedures to be used throughout the trials, and their V̇O2,max was assessed on both occasions to test the validity of the measurement. The V̇O2,max test used involved a continuous incremental exercise protocol on a bicycle ergometer at a pedalling rate of approximately 80 r.p.m. All determinations of expired gas composition and volume during this test, and during the subsequent experimental visits, were performed using a breath-by-breath online computer-based analysis system (SensorMedics, Anaheim, CA, USA).
Exercise protocols
On four occasions (separated by at least 4 and no more than 7 days) subjects arrived at the laboratory at the same time of day, having abstained from food for at least 5 h. Subjects were then prepared for muscle needle biopsies whilst resting in a supine position. This involved subjects receiving three (trial A), two (trial B) or one (trials C and D) incisions through the skin superficial to the vastus lateralis under local anaesthesia (lignocaine, Antigen Pharmaceuticals, Ireland). Following this, subjects then performed one of four experimental trials (A–D) in a randomised order. A summary of the exercise protocol and the relative timing of muscle biopsy sampling is outlined in Fig. 1. It was felt that this protocol would enable the experimental aims to be achieved whilst minimising the total number of muscle biopsy samples per subject to a tolerable number (n = 7).
Figure 1. Diagrammatic representation of experimental protocols A–D.
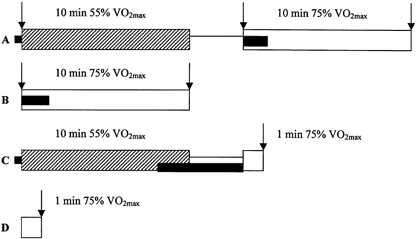
The diagrams outline the two exercise regimes ( , low intensity; □, moderate intensity), the passive rest periods (—), the timing of the biopsies relative to the exercise periods (↓) and the collection of ventilatory data (▪). Note that trials A and C, as well as B and D, differed only in the duration of the moderate exercise bout. Following V̇O2,max determination, all subjects were assigned trial visits in random order. The protocols are explained in detail in the text.
In trial A, subjects cycled for 10 min at 55 % of their calculated V̇O2,max (low intensity exercise), then rested passively for 3 min whilst seated on the bike, after which they cycled for 10 min at 75 % V̇O2,max (moderate intensity exercise). Muscle needle biopsy samples (Bergstrom & Hultman, 1966) were taken at rest and immediately prior to and following the second exercise bout. In trial B, subjects cycled for 10 min at 75 % V̇O2,max and muscle biopsies were taken immediately prior to and following exercise. This exercise protocol differed from trial A by not including a period of prior low intensity exercise. In trial C, subjects cycled for 10 min at 55 % V̇O2,max, then rested passively for 3 min, after which they cycled for 1 min at 75 % V̇O2,max. A single biopsy sample was taken immediately following exercise at 75 % V̇O2,max. This exercise protocol differed from trial A only in the duration of exercise at 75 % V̇O2,max. In trial D, subjects cycled for 1 min at 75 % V̇O2,max and a single muscle biopsy sample was obtained immediately following exercise. This exercise protocol differed from trial B only in the duration of exercise at 75 % V̇O2,max.
These trials were designed to elicit specific responses. The intensity and duration of the low intensity exercise was designed to increase PDC activity by a sufficient magnitude to accumulate acetyl groups. The 3 min recovery period between exercise bouts was determined from previous work in our laboratory (authors' unpublished observations), being the duration of recovery required for femoral artery blood flow to return to pre-exercise levels following low intensity exercise.
After removal from the limb, all biopsies were immediately frozen in liquid nitrogen (in less than 5 s), after which they were removed from the needle whilst still frozen and stored in liquid nitrogen until all samples were gathered.
O2 consumption and CO2 production were determined on a breath-by-breath basis at rest prior to low intensity cycling in trials A and C, during the initial 1.5 min of moderate intensity exercise in trials A and B and during the final 2 min of exercise and subsequent 3 min of passive recovery in trial C (Fig. 1).
Muscle analyses
All frozen muscle biopsy samples were freeze-dried, powdered (removing all non-muscle components) and stored at −80 °C. A proportion of powdered sample was extracted in 0.5 m perchloric acid (containing 1 mm EDTA) and neutralised with 2.2 m KHCO3. The supernatant was then used for spectrophotometric determination of ATP, phosphocreatine (PCr), creatine (Cr) and glucose 6-phosphate (G-6-P; Harris et al. 1974). Fluorometry was used for the determination of lactate (Bergmeyer, 1984), while acetylcarnitine and free carnitine were determined using [14C]oxaloacetate as a substrate (Cederblad et al. 1990). Another aliquot of powdered muscle was extracted in 0.1 m NaOH and was used for the spectrophotometric determination of glucosyl units after digestion of muscle glycogen with α-amyloglucosidase (Harris et al. 1974).
Calculation of pulmonary V̇O2 kinetics and muscle ATP production via non-oxygen dependent routes
Breath-by-breath data of V̇O2 for six of the seven subjects were linearly interpolated between breaths to determine values at 1 s intervals. The two experimental tests were then time aligned and a five point filter was used to eliminate aberrant breaths from the average response. The V̇O2 responses were then averaged over 10 s intervals to give a mean value for each interval during exercise for each subject. The V̇O2 response to exercise at 75 % V̇O2,max was modelled as a single exponential curve from baseline to a new steady state:
In this model, V̇O2(t) is the V̇O2 at time t, V̇O2,b is the resting baseline value of V̇O2 (ml (kg body mass)−1 min−1) before exercise, A1 (ml (kg body mass)−1 min−1) is the difference between the baseline value and the new steady state, and τ (s) is defined as the rate of increase in V̇O2 on the exercise response curve, equal to the time (s) to 63 % of the change in the V̇O2 from baseline to new steady state, which is equal in a mono-exponential relationship to the mean response time (MRT) for the exercise bout. All averaged data from time zero to the end of the collection period were included in the fitting process. The oxygen deficit was calculated as equal to the τ multiplied by the steady state V̇O2 for the overall time of breath collection:
ATP production via non-oxygen dependent routes was calculated from:
where Δ is the difference between immediately before and after moderate intensity exercise.
Statistical analysis
Muscle metabolic data were analysed with a single factor ANOVA. Ventilatory data were analysed using Student's paired t test for equal variance. Statistical significance for all the analyses was accepted as P < 0.05 and significant interactions were analysed further with Student-Newman-Keuls post hoc test. All data are expressed as means ± s.e.m.
RESULTS
Muscle metabolites
Table 1 shows that there were no differences in resting muscle metabolite contents between trials A and B. Furthermore, following low intensity exercise and 3 min of passive recovery, muscle ATP, PCr, G-6-P and glycogen contents were not different from rest. However, muscle acetylcarnitine and lactate contents were 2-fold (P < 0.05) and 3-fold (P < 0.05) higher, respectively, at this time point compared with rest.
Table 1.
Skeletal muscle metabolite concentrations in the vastus lateralis at rest (1) and (2), following 10 min of low intensity exercise (55% of V̇O2,max) followed by 3 min of passive recovery and following 1 min and 10 min of moderate intensity exercise (75% of V̇O2,max)
| With prior low intensity exercise | Without prior low intensity exercise | ||||||
|---|---|---|---|---|---|---|---|
| Rest (1) | Post LI | 1 min | 10 min | Rest (2) | 1 min | 10 min | |
| ATP | 26.4 ± 0.7 | 26 ± 0.9 | 25.7 ± 0.7 | 24.0 ± 0.9 | 26.9 ± 0.8 | 27.4 ± 0.8 | 25.6 ± 0.7 |
| PCr | 84.2 ± 1.5 | 82.7 ± 2.3 | 47.7 ± 7.1†‡ | 29.1 ± 4.8† | 85.0 ± 1.2 | 35.9 ± 4.7*† | 32.7 ± 6.6† |
| G-6-P | 1.2 ± 0.3 | 1.3 ± 0.3 | 2.9 ± 0.5†‡ | 5.4 ± 0.7† | 0.9 ± 0.3 | 5.5 ± 1.2*† | 4.1 ± 0.7† |
| Lactate | 2.5 ± 0.5 | 7.4 ± 2.4† | 17.2 ± 5.8†‡ | 88.9 ± 17.5† | 1.7 ± 0.3 | 33.1 ± 9.4*† | 72.6 ± 19.4† |
| Acetylcarn | 3.7 ± 0.6 | 7.8 ± 1.1† | 7.9 ± 1.8†‡ | 11.5 ± 1.8† | 4.3 ± 1 | 6.4 ± 1.2 | 13.1 ± 0.8† |
| Glycogen | 333 ± 42 | 291 ± 35 | 265 ± 39 | 200 ± 33† | 341 ± 58 | 297 ± 45 | 231 ± 47† |
All data are presented as means ±s.e.m. for seven subjects. Post LI, biopsies taken post-low intensity exercise and 3 min of recovery, i.e. immediately prior to moderate intensity exercise. 1 min and 10 min, biopsies taken after 1 min and 10 min of moderate intensity exercise. ATP, glucose 6-phosphate (G-6-P), lactate, acetylcarnitine (Acetylcarn) and glycogen contents are expressed as mmol (kg dry weight of muscle)−1.
Significant difference between experimental groups (P < 0.05) at corresponding time points during moderate intensity exercise
significant difference within each experimental group (P < 0.05) when compared with Rest
significant difference (P < 0.05) between post-low intensity exercise and 1 min moderate intensity exercise.
Changes after 1 min of moderate intensity (75 % V̇O2,max) exercise
One minute of moderate intensity exercise had no effect on muscle ATP concentration, irrespective of whether it was preceded by low intensity exercise or not. Moderate intensity exercise resulted in a significant decrease in muscle PCr concentration and increases in G-6-P and lactate concentrations, when compared with resting and post-low intensity exercise values (Table 1). When moderate intensity exercise was preceded by low intensity exercise, no change in acetylcarnitine concentration was observed during the first minute of moderate intensity exercise, which contrasted with the ∼50 % increase in acetylcarnitine accumulation in the absence of low intensity exercise (Table 1).
Comparison of muscle metabolites following 1 min of moderate intensity exercise shows there was significant sparing of PCr (∼25 %, P < 0.05; Fig. 2) and a reduction in G-6-P (∼48 %, P < 0.05; Table 1) and lactate accumulation (∼47 %, P < 0.05; Fig. 2) when moderate intensity exercise was preceded by low intensity exercise. Consequently, Fig. 3 shows that ATP production from non-oxygen dependent routes over the first minute of moderate intensity exercise was also markedly reduced (by ∼45 %, P < 0.05) when moderate intensity exercise was preceded by low intensity exercise.
Figure 2. PCr degradation and lactate accumulation in skeletal muscle.
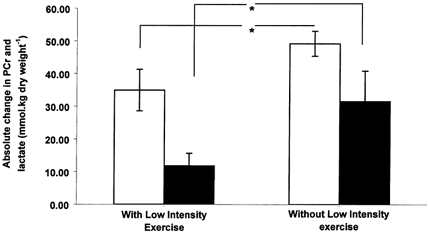
Skeletal muscle PCr degradation (open bars) and lactate accumulation (black bars; means ± s.e.m.) after 1 min of moderate intensity exercise (75 % of V̇O2,max) that was preceded by either 10 min of low intensity exercise (55 % of V̇O2,max) and 3 min of passive recovery or no low intensity exercise. * Significant difference between treatments (P < 0.05).
Figure 3. Non-oxygen dependent ATP production in skeletal muscle.
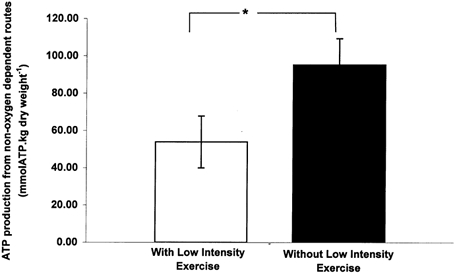
Skeletal muscle ATP production from non-oxygen dependent routes following 1 min of moderate intensity exercise (75 % of V̇O2,max) that was preceded by either 10 min of low intensity exercise (55 % of V̇O2,max) and 3 min of passive recovery (open bars) or no low intensity exercise (black bars). *, Significant difference between treatments (P < 0.05).
Changes after 10 min of moderate intensity exercise
Irrespective of the exercise conditions, 10 min of moderate intensity exercise had no effect on muscle ATP concentration, but did decrease PCr and glycogen concentrations and increase G-6-P, lactate and acetylcarnitine concentrations, compared with resting levels (Table 1). Differences in metabolite concentrations between conditions evident at 1 min were no longer present after 10 min, such that no differences were found when comparing metabolite concentrations after 10 min of exercise in the presence and absence of low intensity exercise. Thus, ATP production via non-oxygen dependent routes was markedly greater from 1–10 min of moderate intensity exercise when preceded by low intensity exercise compared with the same value in the absence of low intensity exercise (137 ± 37 vs. 68 ± 26 mmol (kg dry muscle)−1). It was not surprising to find that ATP production via non-oxygen dependent routes from 0–10 min was also the same between groups, i.e. 188 ± 31 vs. 163 ± 29 mmol (kg dry muscle)−1 with and without low intensity exercise, respectively.
Ventilatory kinetics
Resting V̇O2 values were comparable between the two experimental interventions (5.0 ± 0.7 with vs. 4.2 ± 0.5 ml (kg body mass)−1 min−1 without low intensity exercise). Similarly, V̇O2 following low intensity exercise and 3 min of passive recovery (i.e. immediately prior to moderate intensity exercise) was not significantly different from the resting rate (5.4 ± 0.1 with vs. 5.3 ± 0.6 ml (kg body mass)−1 min−1 without low intensity exercise). The overall V̇O2 kinetic responses during moderate intensity exercise were assessed as a mono-exponential association. An accelerated V̇O2 on-kinetic response was observed in all subjects (n = 6) during moderate intensity exercise that was preceded by low intensity exercise, as determined from the associated time constant (τ) or MRT (Fig. 4 and Table 2). The amplitude of the change in V̇O2 from baseline to steady state was not significantly different between experimental trials. The calculated oxygen deficit (O2,def = τΔV̇O2,ss-bl) during moderate intensity exercise was significantly less following low intensity exercise (Table 2).
Figure 4. Mean response times.
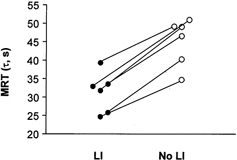
Mean response time (MRT, τ; s) of each subject (n = 6) during 1.5 min of moderate intensity exercise (75 % of V̇O2,max) that was preceded by either 10 min of low intensity exercise (55 % of V̇O2,max) and 3 min passive recovery (LI) or no low intensity cycling exercise (No LI). The figure illustrates a reduction in the MRT in all subjects when moderate intensity exercise was preceded by low intensity exercise. * Significant difference between treatments (P < 0.05).
Table 2.
Ventilatory parameters estimated from a single exponential model fit of the V̇O2 responses at the onset of moderate intensity exercise (75% of V̇O2,max) in the absence and presence of prior low intensity exercise (55 % of V̇O2,max)
| Without low intensity exercise | With low intensity exercise | |
|---|---|---|
| Baseline V̇O2 (ml (kg body mass)−1 min−1) | 4.2 ± 0.5 | 5.0 ± 0.7 |
| Steady state V̇O2 (ml (kg body mass)−1 min−1) | 39.8 ± 2.4 | 37.7 ± 1.1 |
| MRT (τ) (s) | 45.1 ± 2.8 | 31.3 ± 2.4* |
| O2,def (l) | 2.3 ± 0.3 | 1.5 ± 0.2* |
All data are presented as means ±s.e.m. for six male subjects. MRT represents mean response time; O2,def represents oxygen deficit.
Significant difference (P < 0.05) between experimental groups.
DISCUSSION
This study was undertaken to determine whether low intensity exercise would significantly alter the metabolic and ventilatory responses to a subsequent bout of moderate intensity exercise. Low intensity exercise and a subsequent 3 min period of passive recovery was shown to have no effect on muscle ATP, PCr, G-6-P and glycogen concentrations, but did result in the elevation of lactate and acetylcarnitine concentrations above basal levels. Of greatest significance was the finding that following 1 min of moderate intensity exercise that was preceded by low intensity exercise, there were reductions in PCr degradation (by ∼25 %) and G-6-P and lactate accumulation (by ∼48 % and ∼47 %, respectively) when compared with moderate intensity exercise alone. As a result of low intensity exercise, there was a ∼43 % reduction in ATP production from non-oxygen dependent routes after 1 min of moderate intensity exercise. In line with this finding, an acceleration of the V̇O2 on-kinetics was observed when low intensity exercise preceded moderate intensity exercise. Collectively, these findings demonstrate that low intensity exercise can reduce the apparent inertia in mitochondrial flux at the onset of subsequent more intense exercise and, as a result, there is an acceleration of V̇O2 on-kinetics and a reduced reliance on energy delivery via non-oxygen dependent routes.
One proposed mechanism to explain the lag in oxidative flux at the onset of exercise is the potential delay that exists in skeletal muscle blood flow and, therefore, oxygen delivery during the rest-to-exercise transition. While this proposed mechanism has its merits, there are a number of technical difficulties associated with quantifying V̇O2 on-kinetics at the muscle level in human subjects, whilst also monitoring factors such as muscle blood flow. In a study by Grassi and co-workers (1998a,b), the authors sought to resolve these problems by utilising an isolated canine gastrocnemius muscle model. In using this model, they were able to eliminate or instigate any desired delay in muscle oxygen delivery during the rest-to-contraction transition by manipulating blood flow. In addition, they were able to accurately measure O2 delivery and muscle V̇O2 kinetics during contraction. From these investigations, it was shown that the elimination of the delay in oxygen delivery during the rest-to-contraction transition did not affect muscle V̇O2 kinetics. These findings led the investigators to conclude that muscle O2 kinetics are mainly set by intrinsic inertia of mitochondrial oxidation, rather than delays in muscle blood flow. While in our investigations muscle blood flow was not measured, it should be noted that the 3 min of passive rest following the 10 min of low intensity exercise would be expected to be sufficient time for muscle blood flow to have approached pre-exercise levels (Shoemaker et al. 1996). Therefore, in accordance with the findings of Grassi et al. (1998a,b) we propose that we have demonstrated, through both metabolic and ventilatory changes, that inertia in mitochondrial oxidation significantly contributes to the lag in V̇O2 on-kinetics at the onset of exercise and, in line with our previous work (Timmons et al. 1998a,b), this lag resides at the level of acetyl group availability and/or delivery.
The extent of ATP production from non-oxygen dependent routes at the onset of exercise depends on the intensity of the exercise performed (i.e. the rate of ATP degradation and therefore of accumulation of ADP and AMP, both of which are potent activators of PCr degradation and glycogenolysis) and the time taken for oxidative pathways to provide the energy requirements of contraction, i.e. the time taken to reach a steady state (Hultman et al. 1967; Howlett et al. 1998). This time lag in mitochondrial ATP provision is often referred to as the oxygen deficit as a result of its historical association with the delay in muscle oxygen delivery at the onset of exercise (Margaria et al. 1965), and the close quantitative association between the extent of ATP production from non-oxygen dependent routes and the calculation of the oxygen deficit based on ventilatory responses (Bangsbo et al. 1990). In the present investigation, we determined the extent of ATP production from non-oxygen dependent routes during 10 min of moderate intensity exercise in the presence and absence of a preceding bout of low intensity exercise. The low intensity exercise in this investigation was aimed at increasing the activity of PDC sufficiently to stockpile acetyl groups, and indeed, following low intensity exercise and 3 min of passive recovery, muscle acetylcarnitine concentration was elevated 2-fold above basal levels. Our findings showed an unambiguous decrease (∼43 %) in ATP production from non-oxygen dependent routes during that first minute of moderate intensity exercise, when preceded by low intensity exercise, indicating that a low intensity exercise-induced increase in acetyl group availability could have accelerated the rate of mitochondrial ATP production during this period. This observation is directly in line with our previous work showing that stockpiling of acetyl groups at rest prior to contraction, by pharmacological activation of PDC using DCA, can markedly reduce ATP production from non-oxygen dependent routes during the rest-to-exercise transition period (Timmons et al. 1998a).
The present study also aimed to examine whether changes in the metabolic profile of muscle as a result of low intensity exercise extended to steady-state moderate intensity exercise. To do this, we examined muscle metabolites following 10 min of moderate intensity exercise. Overall, we found no significant differences between the two trials in ATP, PCr, G-6-P, lactate, acetylcarnitine and glycogen concentrations at the end of 10 min of moderate intensity exercise. However, following the first minute of moderate intensity exercise, i.e. from 1 to 10 min, ATP production from non-oxygen dependent routes was found to be greatest when preceded by low intensity exercise, such that overall (0–10 min) ATP production from non-oxygen dependent routes was similar between groups. As the workload demands were identical over the 10 min of moderate intensity exercise in the two trials, the decreased reliance on ATP production from non-oxygen dependent routes during the first minute of moderate intensity exercise, when preceded by low intensity exercise, must have been accompanied by an acceleration in mitochondrial ATP production. However, over the entire 10 min period, the contribution of both routes to ATP production was identical between treatments. This suggests that low intensity exercise can ‘prime’ mitochondria prior to a subsequent bout of more intense exercise, thereby removing some of the inertia in mitochondrial ATP production at the onset of exercise.
The contribution of oxidative flux to ATP resynthesis during rest to steady-state exercise may be calculated by measuring the relative accumulation of acetyl groups in the form of acetylcarnitine since the rate of acetyl-CoA accumulation is 400 times lower than that of acetylcarnitine (Constantin-Teodosiu et al. 1991). Table 1 shows that little, if any, acetylcarnitine accumulated during the first minute of moderate intensity exercise when preceded by low intensity exercise (0.1 mmol (kg dry muscle)−1), but 2.1 mmol (kg dry muscle)−1 accumulated during the same period when low intensity exercise was not performed. Assuming PDC flux was the same during the first minute of exercise in the two experimental treatments, this means ∼2 mmol (kg dry muscle)−1 more acetyl groups were oxidised by the tricarboxylic acid (TCA) cycle during moderate intensity exercise that was preceded by low intensity exercise, which equates to 24 mmol (kg dry muscle)−1 of ATP. It is interesting to note therefore, that this is quantitatively similar in magnitude to the decline in ATP production from non-oxygen dependent routes that was observed during the first minute of moderate intensity exercise when preceded by low intensity exercise (Fig. 3), implying that low intensity exercise mediated its effect on substrate utilisation by increasing acetyl group availability. Irrespective of this observation, the difference in acetyl group accumulation between experimental treatments during the first minute of moderate intensity exercise points to the existence of two possible scenarios, which may not necessarily have been operating in isolation. Firstly, as outline above, the increased availability of acetyl groups prior to moderate intensity cycling exercise, as a consequence of low intensity cycling exercise, facilitated acetyl group utilisation by the TCA cycle, and in turn, increased ATP production via oxidative pathways during the first minute of moderate intensity exercise. Secondly, differences in the PDC activity and/or flux existed between the two experimental groups during that first minute of moderate intensity exercise to allow for the increased utilisation of acetyl groups and therefore less acetyl group accumulation that was observed during this period when moderate intensity exercise was preceded by low intensity exercise. Whatever the case, our findings suggest that low intensity exercise resulted in a better matching of acetyl group production and acetyl group utilisation by the TCA cycle during the first minute of moderate intensity exercise, which must also have been accompanied by an overall increase in mitochondrial ATP production. Therefore, we can conclude overall that the lag in the mitochondrial ATP production in the first minute of exercise is, at least in part, the result of an intrinsic mitochondrial lag rather than just an oxygen supply determinant.
In addition to measurements of the skeletal muscle metabolites, we examined pulmonary ventilation over the first 1.5 min of moderate intensity exercise to determine the influence of low intensity exercise on ventilatory indexes during a subsequent bout of more intense exercise. In these investigations, we utilised a mono-exponential fit of the V̇O2 responses over the first 1.5 min of exercise and calculated the mean response time (MRT) or time constant (τ), the amplitude change in V̇O2 and the relative oxygen deficit over the first 1.5 min of moderate intensity exercise (Table 2). What we observed was firstly, in accordance with our muscle metabolic data, that there was no difference in the baseline to steady-state change in V̇O2 between the two experimental groups. Secondly, the relative MRT during moderate intensity exercise was greater in each subject in the absence of low intensity exercise (Fig. 4). The MRT represents the time taken to reach 63 % of the asymptotic change in V̇O2 from baseline to steady state, hence the shorter the duration of the MRT the faster the acceleration in the V̇O2 on-kinetic response to the exercise. The acceleration of V̇O2 on-kinetics in this way is widely accepted to reflect a faster induction of mitochondrial ATP production during exercise (Whipp et al. 1982). Lastly, and in accordance with the other ventilatory parameters, the oxygen deficit (calculated from the time constant and the change from baseline to steady state V̇O2) was lower when moderate intensity exercise was preceded by low intensity exercise (Table 2), which fits with the reduction in ATP production from non-oxygen dependent routes observed in this group (Fig. 5). Taken together, the metabolic and ventilatory measurements clearly indicate that a lag in oxidative ATP delivery occurs at the onset of moderate intensity exercise, which can be overcome by prior low intensity exercise. Furthermore, the apparent inertia to mitochondrial flux at the onset of exercise is governed not only by oxygen supply to muscle, but also by substrate delivery and/or availability in the form of acetyl groups within mitochondria.
Figure 5. Non-oxygen dependent ATP production and calculated oxygen deficits.
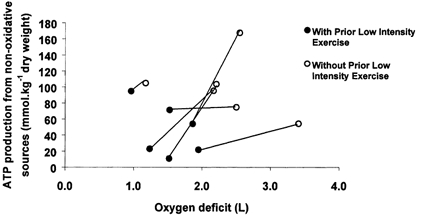
Skeletal muscle ATP production from non-oxygen dependent routes following 1 min of moderate intensity exercise (75 % of V̇O2,max), and the calculated oxygen deficit over the same period (n = 6) that was preceded by either 10 min of low intensity exercise (55 % of V̇O2,max) and 3 min passive recovery (•), or no low intensity cycling exercise (○). This figure illustrates the relationship between the calculated oxygen deficit, as detemined from ventilatory parameters, and the calculated ATP production from non-oxygen dependent routes, determined from muscle biopsy measurements, as well as the clear effect prior low intensity exercise has on both parameters.
Implications
Peripheral vascular disease (PVD) is characterised by the failure of muscle blood flow to increase adequately at the onset of exercise, resulting in the rapid activation of energy delivery from non-oxygen dependent routes. Even the most basic of activities is associated with pain, discomfort and premature fatigue development (Bauer et al. 1999) in these patients. Previous investigations in these patients have illustrated profound decreases in the overall peak V̇O2, a slower rate of V̇O2 on-kinetics and acceleration of PCr hydrolysis and lactate accumulation during exercise (Hansen et al. 1987; Bauer et al. 1999). This current study may provide an avenue for further investigation of the utility of low intensity exercise in the acute and long-term management of PVD patients.
Conclusion
In conclusion, this study has demonstrated a decreased reliance on ATP production from non-oxygen dependent routes during the first minute of moderate intensity exercise, when preceded by low intensity exercise. We believe this response was attributable to low intensity exercise increasing acetyl group availability at the level of the TCA cycle and thereby accelerating mitochondrial ATP production at the onset of moderate intensity exercise. This conclusion is supported by ventilatory data showing accelerated V̇O2 on-kinetics during the first minute of moderate intensity exercise, when preceded by low intensity exercise. Overall, however, ATP production from non-oxygen dependent routes and the amplitude of the change in V̇O2 were no different between the two experimental groups at the end of 10 min of moderate intensity exercise. This suggests that an acceleration in the kinetics of mitochondrial substrate utilisation occurred during moderate intensity exercise as a consequence of prior low intensity exercise, rather than a switch to mitochondrial ATP production. Overall, our findings strongly support the hypothesis of an intrinsic mitochondrial limitation to oxygen utilisation at the onset of exercise, which resides at the level of acetyl group availability and/or delivery.
Acknowledgments
This work was supported by a project grant award from the British Heart Foundation (grant no. PG/97117).
REFERENCES
- Bangsbo J, Gollnick PD, Graham TE, Juel C, Kiens B, Mizuno M, Saltin B. Anaerobic energy production and O2 deficit-debt relationship during exhaustive exercise in humans. Journal of Physiology. 1990;422:539–559. doi: 10.1113/jphysiol.1990.sp018000. [DOI] [PMC free article] [PubMed] [Google Scholar]
- Bauer TA, Regensteiner JG, Brass EP, Hiatt WR. Oxygen uptake kinetics during exercise are slowed in patients with peripheral arterial disease. Journal of Applied Physiology. 1999;87:809–816. doi: 10.1152/jappl.1999.87.2.809. [DOI] [PubMed] [Google Scholar]
- Bergmeyer HU. Methods of Enzymatic Analysis. 3. Verlag Chemie; 1984. [Google Scholar]
- Bergstrom J, Hultman E. The effect of exercise on muscle glycogen and electrolytes in normals. Scandinavian Journal of Clinical Investigation. 1966;18:16–20. doi: 10.3109/00365516609065602. [DOI] [PubMed] [Google Scholar]
- Cederblad G, Carlin I, Constantin-Teodosiu D, Harper P, Hultman E. Radioisotopic assays of CoASH and carnitine and their acetylated forms in human skeletal muscle. Analytical Biochemistry. 1990;185:274–278. doi: 10.1016/0003-2697(90)90292-h. [DOI] [PubMed] [Google Scholar]
- Constantin-Teodosiu D, Carlin JI, Cederblad G, Harris RC, Hultman E. Acetyl group accumulation and pyruvate dehydrogenase activity in human muscle during incremental exercise. Acta Physiologica Scandinavica. 1991;14:367–372. doi: 10.1111/j.1748-1716.1991.tb09247.x. [DOI] [PubMed] [Google Scholar]
- Essen B, Kaijser L. Regulation of glycolysis in intermittent exercise in man. Journal of Physiology. 1978;281:499–511. doi: 10.1113/jphysiol.1978.sp012436. [DOI] [PMC free article] [PubMed] [Google Scholar]
- Genovely H, Stamford BA. Effects of prolonged warm-up exercise above and below anaerobic threshold on maximal performance. European Journal of Applied Physiology and Occupational Physiology. 1982;48:323–330. doi: 10.1007/BF00430222. [DOI] [PubMed] [Google Scholar]
- Grassi B, Gladden LB, Samaja M, Stary CM, Hogan MC. Faster adjustment of O2 delivery does not affect VO2 on-kinetics in isolated in situ canine muscle. Journal of Applied Physiology. 1998a;85:1394–1403. doi: 10.1152/jappl.1998.85.4.1394. [DOI] [PubMed] [Google Scholar]
- Grassi B, Gladden LB, Stary CM, Wagner PD, Hogan MC. Peripheral O2 diffusion does not affect VO2 on-kinetics in isolated in situ canine muscle. Journal of Applied Physiology. 1998b;85:1404–1412. doi: 10.1152/jappl.1998.85.4.1404. [DOI] [PubMed] [Google Scholar]
- Hansen JE, Sue DY, Oren A, Wasserman K. Relation of oxygen uptake to work rate in normal men and men with circulatory disorders. American Journal of Cardiology. 1987;59:669–674. doi: 10.1016/0002-9149(87)91190-8. [DOI] [PubMed] [Google Scholar]
- Harris RC, Hultman E, Nordesjo L-O. Glycogen, glycolytic intermediates and high energy phosphates determined in biopsy samples of musculus quadriceps femoris of man at rest. Methods and varience of values. Scandinavian Journal of Clinical Laboratory Investigation. 1974;33:109–120. [PubMed] [Google Scholar]
- Howlett RA, Heigenhauser GJ, Hultman E, Hollidge-Horvat MG, Spriet LL. Effects of dichloroacetate infusion on human skeletal muscle metabolism at the onset of exercise. American Journal of Physiology. 1999;277:E18–25. doi: 10.1152/ajpendo.1999.277.1.E18. [DOI] [PubMed] [Google Scholar]
- Howlett RA, Parolin ML, Dyck DJ, Hultman E, Jones NL, Heigenhauser GJ, Spriet LL. Regulation of skeletal muscle glycogen phosphorylase and PDH at varying exercise power outputs. American Journal of Physiology. 1998;275:R418–425. doi: 10.1152/ajpregu.1998.275.2.R418. [DOI] [PubMed] [Google Scholar]
- Hultman E, Bergstrom J, Anderson NM. Breakdown and resynthesis of PCr and ATP in connection with muscular work. Scandinavian Journal of Clinical Laboratory Investigation. 1967;19:56–66. doi: 10.3109/00365516709093481. [DOI] [PubMed] [Google Scholar]
- Knight DR, Schaffartzik W, Poole DC, Hogan MC, Bebout DE, Wagner PD. Effects of hyperoxia on maximal leg O2 supply and utilization in men. Journal of Applied Physiology. 1993;75:2586–2594. doi: 10.1152/jappl.1993.75.6.2586. [DOI] [PubMed] [Google Scholar]
- MacDonald M, Pederson PK, Hughson RL. Acceleration of VO2 kinetics in heavy sub-maximal exercise by hyperoxia and prior high-intensity exercise. Journal of Applied Physiology. 1997;83:1318–1325. doi: 10.1152/jappl.1997.83.4.1318. [DOI] [PubMed] [Google Scholar]
- Margaria R, Aghemo P, Rovelli E. Indirect determination of maximal O2 consumption in man. Journal of Applied Physiology. 1965;20:1070–1073. doi: 10.1152/jappl.1965.20.5.1070. [DOI] [PubMed] [Google Scholar]
- Martin BJ, Robinson S, Wiegman DL, Aulick LH. Effect of warm-up on metabolic responses to strenuous exercise. Medicine and Science in Sports. 1975;7:146–149. [PubMed] [Google Scholar]
- Richardson RS, Grassi B, Gavin TP, Haseler LJ, Tagore K, Roca J, Wagner PD. Evidence of O2 supply-dependent VO2 max in the exercise-trained human quadriceps. Journal of Applied Physiology. 1999;86:1048–1053. doi: 10.1152/jappl.1999.86.3.1048. [DOI] [PubMed] [Google Scholar]
- Richardson RS, Knight DR, Poole DC, Kurdak SS, Hogan MC, Grassi B, Wagner PD. Determinants of maximal exercise VO2 during single leg knee-extensor exercise in humans. American Journal of Physiology. 1995;268:H1453–1461. doi: 10.1152/ajpheart.1995.268.4.H1453. [DOI] [PubMed] [Google Scholar]
- Robergs RA, Pascoe DD, Costill DL, Fink WJ, Chwalbinska-Moneta J, Davis JA, Hickner R. Effects of warm-up on muscle glycogenolysis during intense exercise. Medicine and Exercise in Sports Science. 1991;23:37–43. [PubMed] [Google Scholar]
- Shoemaker JK, Phillips SM, Green HJ, Hughson RL. Faster femoral artery blood velocity kinetics at the onset of exercise following short-term training. Cardiovascular Research. 1996;31:278–286. [PubMed] [Google Scholar]
- Timmons JA, Gustafsson T, Sundberg CJ, Jansson E, Greenhaff PL. Muscle acetyl group availability is a major determinant of oxygen deficit in humans during submaximal exercise. American Journal of Physiology. 1998a;274:E377–380. doi: 10.1152/ajpendo.1998.274.2.E377. [DOI] [PubMed] [Google Scholar]
- Timmons JA, Gustafsson T, Sundberg CJ, Jansson E, Hultman E, Kaijser L, Chwalbinska-Moneta J, Constantin-Teodosiu D, Macdonald IA, Greenhaff PL. Substrate availability limits human skeletal muscle oxidative ATP regeneration at the onset of ischemic exercise. Journal of Clinical Investigation. 1998b;101:79–85. doi: 10.1172/JCI1146. [DOI] [PMC free article] [PubMed] [Google Scholar]
- Whipp BJ, Ward SA, Lamarra N, Davis JA, Wasserman K. Parameters of ventilatory and gas exchange dynamics during exercise. Journal of Applied Physiology. 1982;52:1506–1513. doi: 10.1152/jappl.1982.52.6.1506. [DOI] [PubMed] [Google Scholar]
- Yoshida T, Kamiya J, Hishimoto K. Are oxygen uptake kinetics at the onset of exercise speeded up by local metabolic status in active muscles? European Journal of Applied Physiology and Occupational Physiology. 1995;70:482–486. doi: 10.1007/BF00634376. [DOI] [PubMed] [Google Scholar]