

Abstract
The mechanism related to mitochondrial dysfunction-induced catecholamine (CA) secretion in dispersed guinea-pig adrenal chromaffin cells was investigated using amperometry and confocal laser microscopy. Application of CCCP, which does not stimulate generation of reactive oxygen species (ROS), reversibly induced CA secretion, whereas application of either cyanide or oligomycin (OL), a stimulator for ROS, enhanced CA secretion to a smaller extent. The CCCP-induced secretion was abolished by removal of external Ca2+ ions and was markedly diminished by D600. The mitochondrial membrane potential, measured using rhodamine 123, was rapidly lost in response to CCCP, but did not change noticeably during a 3 min exposure to OL. Prior exposure to OL markedly facilitated depolarization of the mitochondrial membrane potential in response to cyanide. The mitochondrial inhibitors rapidly produced an increase in Magnesium Green (MgG) fluorescence in the absence of external Ca2+ and Mg2+ ions, an increase that was larger in the cytoplasm than in the nucleus. The rank order of potency in increasing MgG fluorescence among the inhibitors was similar to that in increasing secretion. Thus, mitochondrial inhibition rapidly decreases [ATP] and the mitochondrial dysfunction-induced secretion is not due to ROS generation or to mitochondrial depolarization, but is possibly mediated by a decrease in ATP.
Catecholamine (CA) secreted from the adrenal medulla plays a pivotal role in the defence against hypoxia (Cryer, 1980). It has become evident that in addition to type I cells of the carotid body, adrenal chromaffin (AC) cells themselves can rapidly detect hypoxia with consequent CA secretion in the adult guinea-pig (Inoue et al. 1998) and newborn rats (Mojet et al. 1997). This secretion was attributed to an increase in intracellular Ca2+ concentrations ([Ca2+]i) resulting from depolarization and the consequent activation of voltage-dependent Ca2+ channels (Inoue et al. 1998), as was noted for the secretion of dopamine from carotid body type I cells (Ureña et al. 1994). Mechanisms related to O2 sensing have been intensively investigated in carotid body type I cells from various species. There are mainly two hypotheses: one is the metabolic hypothesis, based on findings that the effects of hypoxia on the carotid body function were mimicked by various mitochondrial inhibitors (Anichkov & Belen'kii, 1963; Gonzalez et al. 1994), and the other is the membrane ion channel hypothesis, which states that a decrease in O2 tension is sensed by an O2-sensitive K+ channel or its closely associated molecule in the plasma membrane (López-Barneo, 1996). The type of O2-sensitive K+ channels seems to differ between the species, since hypoxia inhibited a charybdotoxin-sensitive, Ca2+-dependent K+ current in rat carotid body cells (López-López et al. 1997) whereas it suppressed a transient, voltage-gated, Ca2+-insenstive K+ channel in the rabbit (López-López et al. 1989). These two hypotheses may also apply to the hypoxia-induced CA secretion in AC cells. In rat AC cells, hypoxia-induced depolarization was attributed to the suppression of putative O2-sensitive K+ channels (Thompson et al. 1997), whereas our results and others (Mojet et al. 1997) showed that the effects of hypoxia on the secretion and whole-cell current were reproduced by cyanide, an electron transport inhibitor.
The membrane ion channel hypothesis is based on the finding that exposure to hypoxia resulted in inhibition of voltage-dependent K+ channels in patch membranes excised from rabbit carotid body type I cells (Ganfornina & López-Barneo, 1992). In contrast, in rat carotid body type I cells, O2 sensitivity of the K+ channels recorded in cell-attached patches was lost in excised patches (Wyatt & Peers, 1995; Buckler et al. 2000; but see Riesco-Fagundo et al. 2001), suggesting that a cytosolic factor is required to maintain O2 sensitivity. If these findings are universal, then the two hypotheses would not be contradictory, and excised patches from rabbit type I cells might have happened to include organelles. A signal related to mitochondrial dysfunction may affect ion transports in the plasma membrane and depolarization would ensue.
We reported that a decrease in O2 tension and mitochondrial inhibitors inhibited the Na+ pump and activated non-selective cation (NS) channels in adult guinea-pig AC cells (Inoue et al. 1999). These changes in ion transport in response to mitochondrial dysfunction could possibly be mediated by diffusible messengers, such as reactive oxygen species (ROS) (Kourie, 1998). Alternatively, changes could be due to a decrease in cellular ATP concentrations ([ATP]), since under conditions where the Na+ pump was suppressed by removal of external K+ ions, the extent of NS channel activation in response to cyanide gradually diminished and this diminution was exacerbated by replacing sucrose with glucose (Inoue et al. 1999). These results could be explained by the notion that the decrease in potency of cyanide in activating NS channels in the presence of glucose is due to glycolytic production of ATP. To gain insight into mechanisms by which depolarization is induced by mitochondrial dysfunction, we examined effects of mitochondrial inhibitors on CA secretion, mitochondrial membrane potential, cellular ATP contents, and NAD(P)H autofluorescence.
METHODS
Female guinea-pigs weighing 250–300 g were used. All experimental procedures involving animals were approved by Institutional Animal Care and Use Committee of Fukuoka University.
Amperometry
Experiments were performed on AC cells enzymatically and mechanically isolated from the guinea-pig adrenal medulla. The animals were killed by cervical dislocation. The adrenal glands were excised and immediately put into ice-cold Ca2+-deficient balanced salt solution (in which 1.8 mm CaCl2 was simply omitted from the standard saline composition, see below). The adrenal gland was cut transversely into two, the adrenal cortex was removed using microscissors and a stereomicroscope. Adrenal medullae thus obtained were cut into two pieces and incubated for 30 min with 0.25 % collagenase dissolved in Ca2+-deficient solution. Then, the preparations were washed in Ca2+-deficient solution and left in this solution at room temperature (23–25 °C) until commencement of the experiments. Before the start of the experiments, one or two pieces of tissue were placed in the bath apparatus on an inverted microscope and AC cells were dissociated mechanically using fine needles. Dissociated AC cells were left for a few minutes to facilitate attachment to the bottom of the bath before being constantly perfused with standard solution at a rate of 1 ml min−1. Chemicals were bath applied. CA release from single or clustered AC cells was measured using amperometry (Chow et al. 1992). A carbon-fibre electrode (ProCFE: Dagan Corporation) was carefully placed on an AC cell and +600 mV was applied to the electrode under voltage clamp conditions. The position of carbon-fibre electrode was occasionally adjusted during the experiment. The current due to oxidation of CA at the tip of the electrode was recorded using an Axopatch 200A amplifier (Axon Instruments) and data were stored on a DAT data recorder (TEAC, Japan) and fed to a brush recorder after low-pass filtering at 5 Hz. For quantitative analysis, the signals were low-pass filtered at 100 Hz and digitized at a sampling interval of 5 ms, using AxoData software (Axon Instruments). The total charge of evoked currents was measured using AxoGraph software (Axon Instruments), and mitochondrial inhibitor-induced secretion was obtained by subtraction of the secretion recorded before stimulation for 60 s from that observed during stimulation for 60 s. The amount of cyanide-induced secretion was expressed as a fraction of average of CCCP-induced secretion before and after cyanide application, whereas the oligomycin-induced secretion was expressed as a fraction of the CCCP-induced secretion before oligomycin application, because of a long-lasting action of the latter. The standard saline contained (mm): 137 NaCl, 5.4 KCl, 1.8 CaCl2, 0.5 MgCl2, 0.53 NaH2PO4, 5 d-glucose, 5 Hepes, and 4 NaOH (pH 7.4). To study the involvement of external Ca2+ ions, 1.8 mm CaCl2 in the standard solution was replaced with 3.6 mm MgCl2.
Magnesium Green and rhodamine fluorescence
To measure change in intracellular Mg2+ ions concentrations ([Mg2+]i), dissociated cells were loaded at room temperature with 5 μm of the acetoxymethyl (AM) ester form of Magnesium Green (MgG) in the presence of 0.05 % Pluronic F-127 for 40 min and then kept for 20 min in standard saline without the dye (Leyssens et al. 1996), whereas for the measurement of a change in mitochondrial membrane potential, the cells were incubated in standard saline containing 26 μm rhodamine 123 for 10 min (Nicholls & Ward, 2000). The dish in which the loaded cells had settled was placed on a Zeiss Axiovert microscope (× 63 objective lens, NA 1.4) attached to a Zeiss LSM 410 laser confocal scanning unit. Illumination with 488 nm was provided by an argon laser and emission was monitored between 510 and 525 nm. Fluorescence images were acquired every 2.5 s at room temperature. Unless otherwise noted, MgG fluorescence was obtained with a full width at half-maximal intensity (FWHM) of 7.59 μm because of the low intensity. FWHM under our experimental conditions corresponds to optical slice thickness. The rhodamine fluorescence was acquired with a FWHM of 0.92 or 1.49 μm. To investigate the effects of mitochondrial inhibitors, half the 2 ml solution in the dish was replaced with a test solution containing the inhibitor, and the administration was completed within 25 s. After testing with an inhibitor, the solution in the dish was exchanged at least five times with saline, unless otherwise noted. The intensity of MgG and rhodamine fluorescence usually decreased with each illumination. Thus, 15–20 frames of MgG fluorescence were obtained prior to application of chemicals and the extent of photobleaching was estimated by a curve fitting of the intensities in the frames with a linear function (at + b, where a and b are constants and t is time). Intensity in each frame was then corrected for photobleaching. The actual intensity in an 80th frame was 2.0 ± 0.6 % (mean ± s.e.m., n = 22) larger than the value estimated in this manner (when an exponential function was used for curve-fitting, it was 2.6 ± 0.6 % (n = 9) smaller). All data are expressed as means ± s.e.m. and statistical significance was determined with Student's t test.
NAD(P)H autofluorescence
To measure change in NAD(P)H autofluorescence, a × 63 objective lens with a NA of 1.25 was used. Cells were illuminated using the 364 nm laser and emission above 397 nm was collected with a FWHM of 7.59 μm every 2.5 s. Before application of mitochondrial inhibitors, 50 frames of the autofluorescence were obtained, and the extent of photobleaching was estimated by a curve-fitting of the intensity in the frames with an exponential function (aexp(-bt) + c, where a, b and c are constants and t is time). The actual intensity in a 120th frame was 0.9 ± 0.2 % (n = 11) smaller than the value estimated in this manner. The NAD(P)H autofluorescence was observed not only in dissociated AC cells, but also in guinea-pig cardiac myocytes isolated, as reported elsewhere (Inoue & Imanaga, 1993). Unless otherwise noted, NAD(P)H and MgG experiments were performed in a Ca2+- and Mg2+-free solution, in which Mg2+ ions were omitted from the Ca2+-free solution, and fluorescence intensity was expressed in arbitrary units.
Chemicals
Rhodamine 123 (rhodamine) and Magnesium Green (MgG) were obtained from Molecular Probes; Pluronic F-127, methoxyverapamil (D600), and carbonyl cyanide m-chlorophenyl-hydrazone (CCCP) were from Sigma; oligomycin A (OL) was from Biomol (Plymouth Meeting, PA, USA); collagenase was from Yakult (Tokyo, Japan); NaCN was from Hayashi Pure Chemical (Tokyo, Japan).
RESULTS
Effects of mitochondrial inhibitors on secretion
Hypoxia and cyanide, which induced secretion in adult guinea-pig AC cells, can produce ROS in mitochondria (Semenza, 1999). Thus, we first examined the possible involvement of ROS in CA secretion evoked by mitochondrial dysfunction using two mitochondrial inhibitors: OL, an ATP synthase inhibitor that can produce ROS, and CCCP, a protonophore that cannot produce ROS (Budd et al. 1997; Nicholls & Budd, 2000).
Figure 1A shows the effects of cyanide, CCCP and OL on CA secretion in the same cell, as recorded using amperometry. Application of 5 μm CCCP induced an increase in secretion with a latency of 9.6 ± 1.1 s (n = 11) and this increase rapidly disappeared on washout, as was seen with cyanide- and hypoxia-induced secretions (Inoue et al. 1998). The potency of CCCP to enhance secretion was stronger than that of cyanide. In 6 of 10 cells responding to CCCP, noticeable amounts of CA secretion were evoked by cyanide stimulation for 1 min with a latency of 27.1 ± 3.4 s (CA secretion measuring > 5 % of the CCCP-induced secretion was regarded as responsive to cyanide or OL). The extent of cyanide-induced secretion in the 10 cells averaged 27.6 ± 10.7 % of the CCCP-induced secretion. The CCCP-induced secretion was abolished by removal of external Ca2+ ions (n = 4; Fig. 1B, Ca(−)) and was markedly diminished by application of 10 μm D600, a voltage-dependent Ca2+ channel blocker (80.4 ± 6.7 % reduction, n = 7; Fig. 1C), thereby indicating involvement of a voltage-dependent Ca2+ influx in the secretion.
Figure 1. Enhancement of catecholamine secretion by mitochondrial inhibitors.
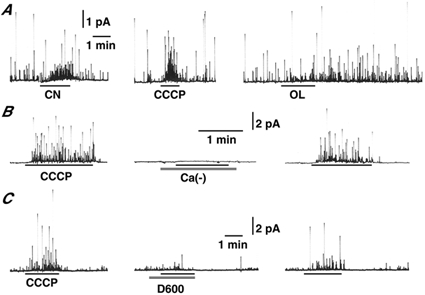
A, secretion of catecholamine (CA) in response to 5 mm cyanide (CN), 5 μm CCCP and 2 μm oligomycin (OL) in the same cell. B, CCCP-induced secretion was reversibly abolished by replacement of Ca2+ ions (Ca(-)) with Mg2+ ions in the perfusate in the same cell. C, CCCP-induced secretion was markedly suppressed by addition of 10 μm D600 in the same cell. CA secretion from dissociated guinea-pig adrenal chromaffin cells was recorded using amperometry.
On the other hand, application of 2 μm OL enhanced CA secretion in 6 of 9 cells where CCCP augmented release. This secretion occurred with long latencies (33.2 ± 4.5 s, n = 6) and in most of the cells continued for more than 10 min after termination of the application. The extent of OL-induced secretion averaged 15.4 ± 5.4 % of the CCCP-induced secretion in the 9 cells. As the three different mitochondrial inhibitors induced enhancement of secretion, irrespective of their potency to generate ROS, ROS probably does not play a major role in CA secretion due to mitochondrial dysfunction.
Effects on mitochondrial membrane potential
The involvement of mitochondrial depolarization in CA secretion was then examined using rhodamine, a dye that is taken up by mitochondria via a negative voltage gradient across the inner membrane (Johnson et al. 1981; Fink et al. 1998). When the mitochondrial membrane potential is depolarized, the dye diffuses from the mitochondria to the non-mitochondrial compartment. Thus, one can assess effects on the mitochondrial membrane potential by measuring changes in fluorescence in mitochondrial and non-mitochondrial compartments.
Figure 2Ab represents a rhodamine fluorescence image obtained using confocal laser microscopy, which shows a punctate distribution of high-intensity fluorescence. This fluorescence image was not markedly altered by application of OL (Fig. 2Ac), whereas the overall intensity of fluorescence diminished with laser illumination. To quantitatively evaluate the effect of OL on the mitochondrial membrane potential, changes in fluorescence intensity, which were corrected for photobleaching, were measured in mitochondrial and non-mitochondrial compartments and expressed as fractions of intensities prior to stimulation. Figure 2B shows changes in fluorescence in these compartments. It is evident that addition of a 4 μm OL-containing solution (final concentration, 2 μm) to the dish induced no change in fluorescence in mitochondrial and non-mitochondrial compartments, whereas the subsequent addition of 10 μm CCCP-containing solution (final concentration, 5 μm) resulted in a rapid decrease and increase in fluorescence in the former and the latter, respectively. The fluorescence image obtained after CCCP addition (Fig. 2Ad) clearly reveals that exposure to CCCP resulted in an almost complete abolition of the mitochondrial membrane potential. This result was quantified by measuring the ratio of fluorescence intensity in the mitochondria to that in the non-mitochondrial compartment. This ratio of fluorescence intensity was not altered by the addition of OL, whereas it markedly decreased to 1.8 ± 0.2 (n = 9) with the subsequent addition of CCCP (Fig. 2C). This decrease was attributed solely to the action of CCCP, since similar ratios (1.5 ± 0.1, n = 9) were observed with application of CCCP alone. The results indicate that OL does not alter the mitochondrial membrane potential at least in the time scale in which secretion occurs, whereas CCCP practically abolishes the negative membrane potential in mitochondria.
Figure 2. Effects of oligomycin and CCCP on mitochondrial membrane potential.
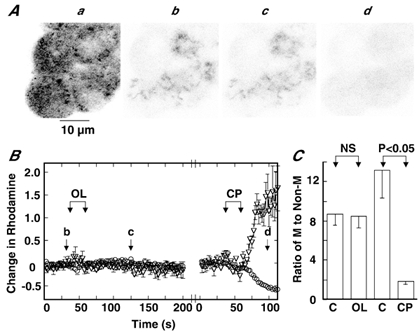
Aa, image of cells acquired with illumination of 488 nm laser and emission of all wavelengths; b-d, rhodamine fluorescence images taken at corresponding times b-d in B with illumination of 488 nm and emission of 510–525 nm. The full width at half-maximal intensity (FWHM) was 1.49 μm. B, changes in fluorescence intensity in mitochondrial (○) and non-mitochondrial compartments (▿) in response to OL and CCCP (CP) are plotted against time. Intensities were corrected for photobleaching, and changes were expressed as fractions of control intensities before OL or CP stimulation (see, Methods). The 1 ml of 4 μm (final concentration, 2 μm) OL- or 10 μm (final concentration, 5 μm) CCCP-containing solution was added to 1 ml of dish solution (total dish volume 2 ml) during the periods indicated by the arrows, and the chemical was present in the dish after addition. Before the start of the experiment for CCCP, the dish solution was exchanged at least 5 times (see Methods). The interruption in time was about 1 min. b-d in A correspond to b-d in B. C, ratios of fluorescence intensity in the mitochondrial to that in the non-mitochondrial compartment before (C) and at 75 s after the beginning of OL or CP addition. Data are means ± s.e.m. (n = 9). NS, not significant.
MgG fluorescence
The results so far suggest that the secretion induced by mitochondrial dysfunction is due to factors other than ROS and mitochondrial depolarization. One candidate would be a decrease in cellular ATP content. We next used MgG to determine whether [ATP] rapidly decreases in response to mitochondrial inhibitors. The most Mg2+ ions in the cell are considered to be present in the form of MgATP, thus hydrolysis of ATP is expected to result in an increase in [Mg2+]i, because of a 10-fold difference in affinity for Mg2+ between ATP and ADP (Leyssens et al. 1996). An increase in MgG fluorescence may represent a decrease in [ATP] under conditions in which [Ca2+]i does not change (KD for Ca2+ ions, 6 μm, Haugland, 1999) (Leyssens et al. 1996).
We first examined fluorescence intensity in response to CCCP in the presence of external Ca2+ ions. Figure 3A shows that fluorescence intensity in the nucleus was stronger than that in the cytoplasm, probably due to heterogeneous loading of the dye (Hernández-Cruz et al. 1990), and that administration of CCCP led to a marked increase in fluorescence in both the nucleus and the cytoplasm. On the other hand, in the absence of external Ca2+ and Mg2+ ions, CCCP produced a slight increase in fluorescence and the time course of the increase did not differ from that in the presence of external Ca2+ ions (Fig. 3B). The CCCP-induced increase in MgG fluorescence in the presence of external Ca2+ was three times that in its absence in 8 cells examined (Fig. 3C). The fluorescence increase under Ca2+-deficient conditions probably represents an increase in [Mg2+]i resulting from ATP hydrolysis, because our previous study with fluo−3/AM revealed that application of cyanide led to no increase in [Ca2+]i in the absence of external Ca2+ ions (Inoue et al. 1998) and CCCP failed to evoke CA secretion in a Ca2+-deficient solution.
Figure 3. Increase in MgG fluorescence in response to CCCP in the presence and the absence of external Ca2+ ions.
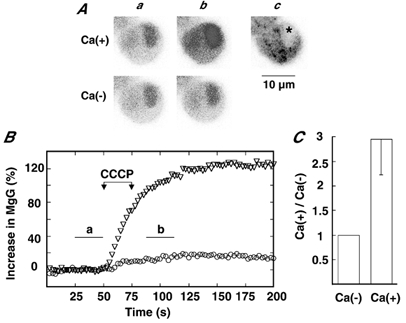
Aa and b, MgG fluorescence images in the presence and the absence of both Ca2+ and Mg2+ before and after CCCP addition, respectively; Ac, cell image. FWHM was 2.38 μm. The fluorescence images a and b represent averages of 11 frames indicated by the horizontal bars in B. Here and in subsequent figures the asterisk indicates the nucleus. B, increases in MgG fluorescence intensity in the presence (▿) and the absence (○) of Ca2+ and Mg2+ ions are plotted against time. Increases were expressed and 5 μm CCCP was applied in the manner explained for Fig. 2. C, CCCP-induced increase in fluorescence intensity in the presence of Ca2+ and Mg2+ ions is expressed with reference to that in the absence in the same cells. Data represent means ± s.e.m. (n = 8).
This notion was further supported by a heterogeneous increase in fluorescence in response to CCCP in the absence of Ca2+ and Mg2+ ions (Fig. 4). Measurement of fluorescence intensity in the nucleus and in the cytoplasm revealed that fluorescence in the two compartments increased in a similar time course in response to CCCP, but the maximum increase in the cytoplasm was larger than that in the nucleus (22 vs. 15 %). This heterogeneous increase in fluorescence was further supported by image analysis: the average of 11 images obtained prior to the addition of CCCP was subtracted from that of 11 images after the addition, and the resulting image was divided by the control image for normalization of change in fluorescence. This image reveals that the extent of fluorescence increase in the nucleus was less than that in the cytoplasm of the two cells shown. In 11 cells, fluorescence increases in the nucleus and cytoplasm were 71.7 ± 10.6 and 124.0 ± 11.3 % of the increase measured over the whole cell, respectively, whereas such a heterogeneous increase in fluorescence did not occur in the presence of external Ca2+ ions (Fig. 4C), thereby indicating that the heterogeneous increase in MgG fluorescence in the absence of Ca2+ is not due to heterogeneous loading of the dye. We interpret these observations to mean that the increase in MgG fluorescence intensity represents a decrease in [ATP] and that ATP hydrolysis mainly occurs in the cytoplasm rather than in the nucleus.
Figure 4. Heterogeneous increase in MgG fluorescence in response to CCCP in the absence of Ca2+ and Mg2+.
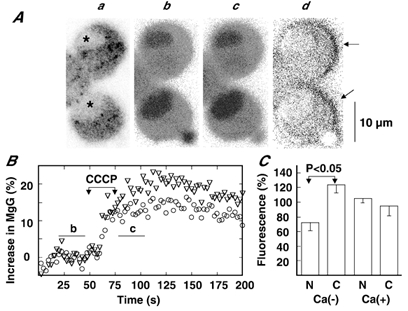
Aa, image of cells; b and c, MgG fluorescence images before and after addition of CCCP, respectively; d, normalized subtraction image (i.e. (c - b)/b). FWHM was 2.38 μm. The images b and c represent averages of 11 frames during the periods indicated by the horizontal bars in B. The strong intensities indicated by the arrows in d are artifacts due to a little leftward shift of image c. B, increases in MgG fluorescence intensity in the nucleus (○) and cytoplasm (▿) in the absence of external Ca2+ and Mg2+ ions are plotted against time. Increases were expressed and 5 μm CCCP was applied during the indicated period, as explained for Fig. 2. C, fluorescence increases in the nucleus (N) and cytoplasm (C) are expressed as fractions of increases measured over the whole cell in the absence and the presence of Ca2+ and Mg2+ ions. Data represent means ± s.e.m. (n = 11 for Ca(-); n = 5 for Ca(+)).
The effects of cyanide on MgG fluorescence were then examined. Whereas CCCP produced an increase in fluorescence in the majority of cells examined, the effects of cyanide varied with cells. Thus, the potency of cyanide in increasing MgG fluorescence was evaluated in cells that showed a fluorescence increase in response to CCCP. Exposure to cyanide produced a non-specific decrease in MgG fluorescence, and this decrease occurred little on a second application of cyanide. Thus, cells in cluster were exposed to cyanide briefly in the absence of Ca2+ and Mg2+ ions, followed by washout with Ca2+- and Mg2+-free solution. Thereafter, MgG fluorescence was tested with cyanide and then CCCP. As shown in Fig. 5, the cyanide-induced increase in MgG fluorescence was significantly smaller than that produced by CCCP. In 14 cells tested with both inhibitors, the cyanide- and CCCP-induced increases in MgG were 7.8 ± 1.3 % and 20.3 ± 2.4 % of control levels, respectively. Next, the effects of OL on MgG fluorescence were examined. Since the stimulating effect of OL on secretion was long lasting, the effects of OL and CCCP on MgG fluorescence were examined sequentially without washout between the tests. In 16 cells which showed a 5 % increase in fluorescence in response to OL or CCCP, the OL-induced increase was 5.5 ± 1.5 % of control levels. The values of cyanide and OL-induced increases were significantly smaller than that (23.7 ± 1.7 %, n = 64) of the CCCP-induced increase (Fig. 5B).
Figure 5. Effects of cyanide on MgG fluorescence in the absence of Ca2+ and Mg2+.
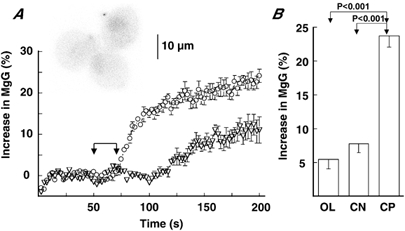
A, increases in MgG fluorescence in response to CCCP (○) and cyanide (▿) are plotted against time (see text). FWHM was 7.59 μm. Inset, MgG fluorescence image. Data are means ±s.e.m. of three cells in cluster. CCCP or cyanide was added to the dish during the indicated period, as explained for Fig. 2. The cyanide-induced increase was delayed, probably due to slow diffusion. B, summary of OL-, cyanide (CN)-, and CCCP (CP)-induced increases in MgG fluorescence (see text). Data represent means ±s.e.m. of 16 for OL, 14 for CN, and 64 for CP.
Mechanisms related to ATP consumption
When the H+ gradient across the mitochondrial membrane is impaired by mitochondrial inhibitors such as CCCP, ATP synthase is expected to function in a reversed mode with the consumption of ATP. If so, then ATP synthase in the mitochondria possibly plays a major role in the ATP decrease seen under conditions of mitochondrial dysfunction in AC cells. This possibility was examined by investigating effects of OL on the CCCP-induced increase in MgG fluorescence. In the cluster of AC cells shown in Fig. 6A, application of OL led to a 10 % increase in fluorescence that was well maintained in the presence of OL. The subsequent administration of CCCP about 3 min after adding OL led to a further increase in fluorescence, which was 16 % at 75 s after the CCCP addition (Fig. 6B). In 16 cells, application of CCCP in the presence of OL led to a further 11.9 ± 1.6 % increase in fluorescence and the sum of OL- and CCCP-induced increase was 17.4 ± 2.6 %. The former, but not the latter, differed significantly from the increase evoked by administration of CCCP alone (Fig. 6C). The results suggest that OL and CCCP complementally act on MgG fluorescence. This notion was supported by the finding that the extent of the OL-induced increase in the cells shown in Fig. 6 was related inversely to that of the CCCP (i.e. as the OL-induced increase was larger, the subsequent CCCP-induced increase was smaller) (r = −0.8838, P < 0.05; not shown). Thus, it is suggested that the reversed function of ATP synthase does not play a major role in ATP expenditure in AC cells with mitochondrial dysfunction, or that ATP synthase in the mitochondria of AC cells does not operate in the reversed mode (Cabezon et al. 2000).
Figure 6. Failure of oligomycin to abolish CCCP-induced increase in MgG fluorescence.
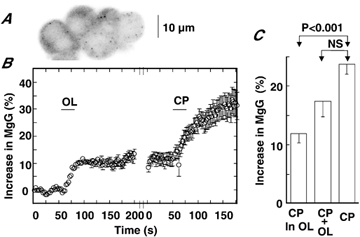
A, image of cells. FWHM was 7.59 μm. B, increases in MgG fluorescence in response to OL and CCCP (CP) are plotted against time. Increases in fluorescence were expressed and 2 μm OL or 5 μm CP was applied during the indicated period in the absence of external Ca2+ and Mg2+, as explained for Fig. 2. The interruption in time was about 1 min. Data represent means ± s.e.m. of five cells shown in A. C, summary of CP-induced increase in MgG fluorescence in the presence of OL, sum of CP- and OL-induced increases, and CP-induced increase. Data represent means ± s.e.m. (n = 16 for CP in OL and for CP + OL; n = 64 for CP alone).
The latter possibility was then examined by studying the effect of OL on cyanide-induced depolarization of the mitochondrial membrane potential (Fig. 7). When complex IV in the electron transport chain is suppressed by cyanide, mitochondria may strive to maintain the H+ gradient across the inner membrane with the reversed operation of ATP synthase. Thus, the cyanide-induced mitochondrial depolarization is expected to be enhanced by the inhibition of ATP synthase, if it is operating in the reversed mode. Application of cyanide resulted in a gradual decrease in rhodamine fluorescence of the mitochondria and an increase in the non-mitochondrial compartment (Fig. 7B). The time course and extent of the decrease in mitochondrial fluorescence were slower and smaller, compared with the case of the decrease evoked by CCCP. The ratio of the mitochondrial to non-mitochondrial fluorescence measured 75 s after the beginning of addition was 5.0, a value which was significantly larger than the corresponding value for CCCP (P < 0.05). This means that the significant extent of the original membrane potential across the inner membrane is preserved during a 2–3 min exposure to cyanide. This notion was supported by the fluorescence image obtained 75 s after the addition of cyanide, in which mitochondria were clearly recognizable (Fig. 7Ac). Washout of cyanide resulted in an increase in mitochondrial fluorescence and a decrease in the non-mitochondrial compartment (not shown). Next, the cluster of cells was exposed to OL for about 3 min, then cyanide solution was added. This exposure to cyanide in the presence of OL produced a rapid decrease and increase in the mitochondrial and non-mitochondrial fluorescence, respectively (Fig. 7B). After reaching a maximum, the non-mitochondrial fluorescence gradually diminished in intensity and the fluorescence outside the cell increased in parallel to change in the non-mitochondrial compartment, thus indicating that the dye leaked from the cell. In the image obtained 75 s after the addition of cyanide, mitochondria were not evident (Fig. 7Ae) and the ratio of mitochondrial to non-mitochondrial fluorescence in such an image was 2.3 ± 0.1 (n = 7) (Fig. 7C), findings similar to those obtained for CCCP. These results are consistent with the notion that ATP synthase functions as a H+ translocating ATPase when the mitochondrial membrane potential diminishes due to cessation of electron transport.
Figure 7. Enhancement of cyanide-induced mitochondrial depolarization by oligomycin.
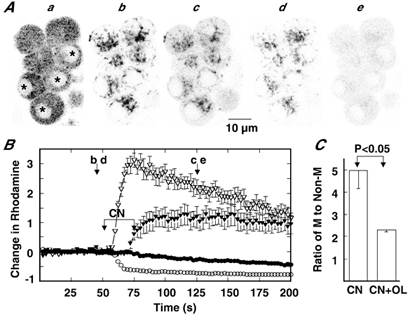
Aa, image of cells; b and c, rhodamine fluorescence images before and after application of 5 mm CN; d and e, rhodamine fluorescence images before and after application of 5 mm CN in the presence of 2 μm OL. FWHM was 0.92 μm. B, changes in rhodamine fluorescence in the mitochondrial (○, •) and non-mitochondrial compartments (▿, ▾) are plotted against time. The open and closed symbols represent changes in fluorescence in the presence and absence of OL, respectively. Changes in fluorescence were expressed and 5 mm CN was applied during the indicated period, as explained for Fig. 2. b-e in A correspond to b-e in B. Data represent means ± s.e.m. of 7 cells shown in Aa. C, ratio of fluorescence intensity in the mitochondrial to that in the non-mitochondrial compartment at 75 s after the start of CN addition in the absence (CN) and the presence of OL (CN+OL). Data represent means ± s.e.m. (n = 11 for CN; n = 14 for CN+OL).
NAD(P)H autofluorescence
To infer the resting metabolic conditions in AC cells, a change in NAD(P)H autofluorescence in response to CCCP and cyanide was measured. When the mitochondrial membrane potential is collapsed by the protonophore CCCP, respiration in mitochondria will become maximal with an increase in turnover of nicotinamide adenine dinucleotide between oxidation and reduction. On the other hand, inhibition of the electron transport by cyanide will result in its full reduction. Thus, the ratio of the change in NAD(P)H autofluorescence in response to cyanide (Δcyanide) to the sum of the changes in fluorescence in response to cyanide and CCCP (Δcyanide + ΔCCCP) may give information about the resting metabolic conditions. Figure 8A and B shows NAD(P)H autofluorescence images and changes in autofluorescence intensity, which was measured over the whole cell. Exposure to cyanide resulted in a rapid increase in fluorescence, and the enhanced punctate fluorescence image was roughly consistent with that of rhodamine fluorescence, thus supporting the notion that the bulk of autofluorescence is derived from mitochondrial NADH (Eng et al. 1989; Duchen & Biscoe, 1992). On the other hand, exposure to CCCP led to a rapid decrease in fluorescence with a more homogenous distribution. To circumvent the effect of sequence of application, the sequence was reversed in three of the six clusters examined, and the ratio, Δcyanide/ (Δcyanide + ΔCCCP), which was calculated in each cell of the cluster, was 83.5 ± 9.3 % (n = 31). This value is similar to that (73 %) for rabbit carotid body type I cells (Duchen & Biscoe, 1992), which may have a high O2 consumption rate (Gonzalez et al. 1994), whereas it is significantly larger than that (55 % calculated from 100 % increase and 82 % decrease in response to cyanide and the protonophore FCCP) in dissociated rat cardiac myocytes, where the resting O2 consumption rate was only 20 % of saturation (Eng et al. 1989). Based on these findings, we examined the resting metabolic conditions of dissociated guinea-pig cardiac myocytes using the same method, and the ratio was found to be 57.8 ± 3.7 % (n = 13), similar to that in relaxing rat myocytes. The results indicate that the value of Δcyanide/(Δcyanide + ΔCCCP) in guinea-pig AC cells is significantly larger than that in cardiac myocytes.
Figure 8. NAD(P)H autofluorescence.
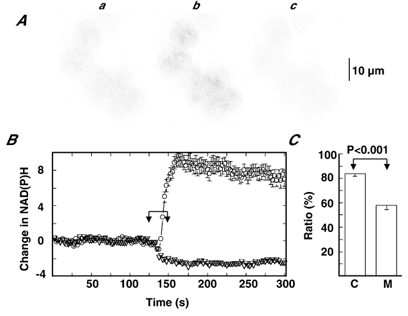
A, NAD(P)H autofluorescence images just before (a) and 25 s after addition of cyanide (b) and CCCP (c). FWHM was 7.59 μm. B, changes in NAD(P)H autofluorescence are plotted against time. Chemicals were added to the dish during the indicated period, as explained for Fig. 2. The cells were exposed first to cyanide and then to CCCP. Data represent means ± s.e.m. of 6 cells shown in A. C, ratio in guinea-pig AC cells (C) and cardiac myocytes (M). The ratio was obtained by dividing cyanide-induced change in NAD(P)H by the sum of the cyanide- and CCCP-induced changes (see text). Data represent means ± s.e.m. of 31 for C and 13 for M.
DISCUSSION
Role of ATP decrease
The present study shows that the potency of cyanide and hypoxia to induce secretion from guinea-pig AC cells is shared by the protonophore CCCP and the ATP synthase inhibitor OL. The application of CCCP induced secretion with a short latency and this secretion ceased on washout. In contrast, the OL-induced secretion occurred with long latencies and secretion continued for more than 10 min after the termination of stimulation. This long-lasting action may be ascribed to firm binding with ATP synthase (Nicholls & Budd, 2000). In addition, rotenone, a respiratory chain inhibitor, increased secretion in AC cells of newborn rats (Mojet et al. 1997) and adult guinea-pig AC cells (authors' unpublished observations). Thus, it can be assumed that CA secretion evoked by a decrease in O2 tension is due to mitochondrial dysfunction, although the possibility that a decrease in O2 tension and mitochondrial dysfunction induce secretion via different mechanisms cannot be completely excluded.
The metabolic hypothesis for chemoreception in the carotid body has not been widely accepted even though it has been proposed repeatedly for more than 60 years (Gonzalez et al. 1994). One reason for this poor acceptance would be that the mechanism through which mitochondrial dysfunction induces a rapid increase in membrane excitability in type I cells remains unknown. One possible mechanism that would account for the rapid secretion of CA in response to mitochondrial dysfunction in carotid body cells and AC cells is involvement of a diffusible molecule(s) produced in the mitochondria. One such candidate is ROS, since it is assumed to mediate many cellular responses evoked by mitochondrial dysfunction (Kourie, 1998): in hippocampal neurones, ROS was suggested to be responsible for activation of Na+ channels in response to hypoxia (Hammarstöm & Gage, 2000), and it was shown to inhibit the Na+ pump activity isolated from rat kidney and brain (Huang et al. 1994). These actions of ROS were irreversible, whereas secretion in response to hypoxia, cyanide and CCCP in AC cells ceased rapidly on termination of stimulation. In addition, CCCP, which produces no ROS, proved to be a potent secretagogue. Thus, ROS may not be responsible for secretion in response to mitochondrial dysfunction. This notion was further supported by the stimulating effect of rotenone on secretion. This chemical inhibits electron transport at complex I, consequently suppressing ROS generation between complexes III and IV (Semenza, 1999; Carriedo et al. 2000). The second possibility is the involvement of a substance leaking from the mitochondria. The leak of cytochrome c into the cytosol was associated with a depolarization of mitochondrial membrane potential (Heiskanen et al. 1999), and in neurones Ca2+ ions were released from the mitochondria under physiological conditions (Duchen, 1999). This possibility can probably be ruled out, since OL did not induce depolarization of the mitochondrial membrane potential under the time scale with which secretion occurred. The third possibility is the involvement of a decrease in intracellular pH. Since H+ extrusion by the Na+−H+ exchanger depends on a Na+ gradient across the plasma membrane, which is produced by the Na+ pump, the intracellular pH is expected to decrease eventually under metabolically suppressed conditions. The involvement of a pH decrease, however, may not be tenable. Even if intracellular pH decreased to 6.2 (calculated based on the assumption that intracellular and extracellular H+ distribution follows its electrochemical gradient: Wakabayashi et al. 1997), a decrease in Na+ pump activity may be at most 50 % (Friedrich et al. 1996). On the other hand, application of cyanide resulted in over 80 % inhibition of the Na+ pump current, which was identified by exposure to a K+-free solution (Inoue et al. 1998).
In contrast to the effects on the mitochondrial membrane potential, CCCP, cyanide, and OL led to a small, but rapid increase in MgG fluorescence in the absence of external Ca2+ and Mg2+ ions. Our previous studies showed that cyanide induced increases in [Ca2+]i and CA secretion in the presence of external Ca2+ ions, but not in its absence (Inoue et al. 1998). In addition, the CA secretion in response to CCCP (Fig. 1) and OL (authors' unpublished observations) was abolished by the removal of external Ca2+ ions. These results indicate that mitochondrial dysfunction does not lead to an increase in [Ca2+]i in Ca2+-deficient solution. Therefore, the mitochondrial inhibitor-induced increase in MgG fluorescence in the absence of external Ca2+ ions may reflect an increase in [Mg2+]i. Because the increase in [Mg2+]i occurred in the absence of external Mg2+ ions and most Mg2+ ions in the cell are present in the form of MgATP, it seems likely that the inhibitor-induced increase in [Mg2+] is due to ATP hydrolysis. This thesis is compatible with our finding that the Na+ pump activity began to decrease within 10 or 20 s after exposure to cyanide or anoxia (Inoue et al. 1999). In addition, the Na+ pump activity in a suspension of rabbit renal tubules showed a linear relationship with millimolar concentrations of cellular ATP, whereas it in lysed membranes of tubules displayed a rectangular hyperbola as a function of ATP with an EC50 of 0.2 mm (Soltoff & Mandel, 1984). Thus, the increase in MgG fluorescence during a 1–2 min exposure to CCCP may reflect the ATP decrease from the millimolar to the submillimolar range. This notion is consistent with the previous findings that a 1–2 min exposure to CN resulted in about a 50 % diminution in ATP-dependent NS channel activity, as evoked by the G protein activator AlF complex, and the EC50 for MgATP of the NS channel was 0.265 mm (Inoue et al. 1996). Thus, we tentatively conclude that the mitochondrial inhibitor-induced increase in MgG fluorescence is due to a decrease in [ATP] and that this decrease is responsible for the secretion.
Mechanism for ATP decrease
Since the CCCP-induced increase in MgG fluorescence in the cytoplasm was larger than that in the nucleus, ATP hydrolysis may occur mainly in the cytoplasm. One possible mechanism for ATP consumption is a reversed function of ATP synthase in mitochondria, since CCCP practically abolished the mitochondrial membrane potential. Furthermore, ATP synthase in the mitochondria of AC cells can function as an H+ translocating ATPase, because exposure to OL augmented the subsequent mitochondrial depolarization in response to cyanide. Actually, FCCP failed to increase MgG fluorescence in the presence of OL in rat cardiac myocytes (Leyssens et al. 1996). This ATP synthase, however, may not play a major role in ATP consumption in AC cells. Firstly, OL slightly, but significantly, increased the MgG fluorescence. Secondly, prior exposure to OL did not abolish the CCCP-induced increase in fluorescence. The finding that the CCCP-induced increase in MgG fluorescence in the presence of OL was smaller than that induced by CCCP alone may be accounted for by the notion that CCCP and OL reduce the ATP content in common compartments, since the sum of CCCP- and OL-induced increases in fluorescence did not differ from the increase induced by CCCP alone and the extent of the OL-induced increase was inversely related to that of the subsequent CCCP-induced increase in fluorescence.
The difference in the effects of OL on MgG fluorescence in cardiac myocytes and AC cells may be attributed to cell morphology. Mitochondria in cardiac myocytes constitute about 35 % of the total cell volume (Smith & Page, 1976), whereas those in rat AC cells occupy only 4 % (Tomlinson et al. 1987). Therefore, mechanisms other than mitochondrial ATP synthase may contribute mainly to a decrease in [ATP] in AC cells with mitochondrial dysfunction. An electron micrograph of guinea-pig adrenal medulla showed that most of the cytoplasm was occupied by secretory vesicles (Inoue et al. 2000). Thus, vesicle-related events (e.g. transport and storing of CA) may be responsible for ATP consumption.
Physiological implications
The time course of increase in MgG fluorescence in the presence of external Ca2+ ions was similar to that in its absence, and the potency difference among CCCP, cyanide, and OL in eliciting CA secretion was roughly comparable to that seen for an increase in MgG fluorescence (CCCP > cyanide ≥ OL). Thus, the rapid decrease in [ATP] from millimolar to submillimolar range or its associated event(s) may be responsible for the mitochondrial dysfunction-induced depolarization and the consequent activation of voltage-gated Ca2+ channels (Inoue et al. 1998). This ATP decrease might be due to a high rate of resting O2 consumption, since the ratio, Δcyanide/(Δcyanide + ΔCCCP), of adult guinea-pig AC cells is similar to that of rabbit carotid body type I cells which may have a high O2 consumption rate (Duchen & Biscoe, 1992), but larger than that of relaxing rat cardiac myocytes where the resting O2 consumption rate was only 20 % of the maximum (Eng et al. 1989). The present observations will aid in determining how a decrease in O2 tension is sensed by hypoxia-sensitive cells, such as carotid body type I cells.
Acknowledgments
This work was in part supported by a grant (966004) from Fukuoka University.
REFERENCES
- Anichkov SV, Belen'kii ML. Pharmacology of the Carotid Body Chemoreceptors. Oxford: Pergamon Press; 1963. [Google Scholar]
- Buckler KJ, Williams BA, Honore E. An oxygen-, acid- and anaesthetic-sensitive TASK-like background potassium channel in rat arterial chemoreceptor cells. Journal of Physiology. 2000;525:135–142. doi: 10.1111/j.1469-7793.2000.00135.x. [DOI] [PMC free article] [PubMed] [Google Scholar]
- Budd SL, Castilho RF, Nicholls DG. Mitochondrial membrane potential and hydroethidine-monitored superoxide generation in cultured cerebellar granule cells. FEBS Letters. 1997;415:21–24. doi: 10.1016/s0014-5793(97)01088-0. [DOI] [PubMed] [Google Scholar]
- Cabezon E, Butler PJG, Runswick MJ, Walker JE. Modulation of the oligomerization state of the bovine F1-ATPase. Journal of Biological Chemistry. 2000;275:25460–25464. doi: 10.1074/jbc.M003859200. [DOI] [PubMed] [Google Scholar]
- Carriedo SG, Sensi SL, Yin HZ, Weiss JH. AMPA exposures induce mitochondrial Ca2+ overload and ROS generation in spinal motor neurons in vitro. Journal of Neuroscience. 2000;20:240–250. doi: 10.1523/JNEUROSCI.20-01-00240.2000. [DOI] [PMC free article] [PubMed] [Google Scholar]
- Chow RH, von Rüden L, Neher E. Delay in vesicle fusion revealed by electrochemical monitoring of single secretory events in adrenal chromaffin cells. Nature. 1992;356:60–63. doi: 10.1038/356060a0. [DOI] [PubMed] [Google Scholar]
- Cryer PE. Physiology and pathophysiology of the human sympathoadrenal neuroendocrine system. New England Journal of Medicine. 1980;303:436–444. doi: 10.1056/NEJM198008213030806. [DOI] [PubMed] [Google Scholar]
- Duchen MR. Contributions of mitochondria to animal physiology: from homeostatic sensor to calcium signalling and cell death. Journal of Physiology. 1999;516:1–17. doi: 10.1111/j.1469-7793.1999.001aa.x. [DOI] [PMC free article] [PubMed] [Google Scholar]
- Duchen MR, Biscoe TJ. Mitochondrial function in type I cells isolated from rabbit arterial chemoreceptors. Journal of Physiology. 1992;450:13–31. doi: 10.1113/jphysiol.1992.sp019114. [DOI] [PMC free article] [PubMed] [Google Scholar]
- Eng J, Lynch RM, Balaban RS. Nicotinamide adenine dinucleotide fluorescence spectroscopy and imaging of isolated cardiac myocytes. Biophysical Journal. 1989;55:621–630. doi: 10.1016/S0006-3495(89)82859-0. [DOI] [PMC free article] [PubMed] [Google Scholar]
- Fink C, Morgan F, Loew LM. Intracellular fluorescent probe concentrations by confocal microscopy. Biophysical Journal. 1998;75:1648–1658. doi: 10.1016/S0006-3495(98)77607-6. [DOI] [PMC free article] [PubMed] [Google Scholar]
- Friedrich T, Bamberg E, Nagel G. Na+,K+-ATPase pump currents in giant excised patches activated by an ATP concentration jump. Biophysical Journal. 1996;71:2486–2500. doi: 10.1016/S0006-3495(96)79442-0. [DOI] [PMC free article] [PubMed] [Google Scholar]
- Ganfornina MD, López-Barneo J. Potassium channel types in arterial chemoreceptor cells and their selective modulation by oxygen. Journal of General Physiology. 1992;100:401–426. doi: 10.1085/jgp.100.3.401. [DOI] [PMC free article] [PubMed] [Google Scholar]
- Gonzalez C, Almaraz L, Obeso A, Rigual R. Carotid body chemoreceptors: from natural stimuli to sensory discharges. Physiological Reviews. 1994;74:829–898. doi: 10.1152/physrev.1994.74.4.829. [DOI] [PubMed] [Google Scholar]
- Hammarstöm AKM, Gage PW. Oxygen-sensing persistent sodium channels in rat hippocampus. Journal of Physiology. 2000;529:107–118. doi: 10.1111/j.1469-7793.2000.00107.x. [DOI] [PMC free article] [PubMed] [Google Scholar]
- Haugland RP. Handbook of Fluorescence Probes and Research Chemicals. Molecular Probes; 1999. [Google Scholar]
- Heiskanen KM, Bhat MB, Wang H-W, Ma J, Nieminen A-L. Mitochondrial depolarization accompanies cytochrome c release during apoptosis in PC6 cells. Journal of Biological Chemistry. 1999;274:5654–5658. doi: 10.1074/jbc.274.9.5654. [DOI] [PubMed] [Google Scholar]
- Hernández-Cruz A, Sala F, Adams PR. Subcellular calcium transients visualized by confocal microscopy in a voltage-clamped vertebrate neuron. Science. 1990;247:858–862. doi: 10.1126/science.2154851. [DOI] [PubMed] [Google Scholar]
- Huang W-H, Wang Y, Askari A, Zolotarjova N, Ganjeizadeh M. Different sensitivities of the Na+/K+-ATPase isoforms to oxidants. Biochimica et Biophysica Acta. 1994;1190:108–114. doi: 10.1016/0005-2736(94)90039-6. [DOI] [PubMed] [Google Scholar]
- Inoue M, Fujishiro N, Imanaga I. Hypoxia and cyanide induce depolarization and catecholamine release in dispersed guinea-pig chromaffin cells. Journal of Physiology. 1998;507:807–818. doi: 10.1111/j.1469-7793.1998.807bs.x. [DOI] [PMC free article] [PubMed] [Google Scholar]
- Inoue M, Fujishiro N, Imanaga I. Na+ pump inhibition and non-selective cation channel activation by cyanide and anoxia in guinea-pig chromaffin cells. Journal of Physiology. 1999;519:385–396. doi: 10.1111/j.1469-7793.1999.0385m.x. [DOI] [PMC free article] [PubMed] [Google Scholar]
- Inoue M, Fujishiro N, Ogawa K, Muroi M, Sakamoto Y, Imanaga I, Shioda S. Pituitary adenylate cyclase-activating polypeptide may function as a neuromodulator in guinea-pig adrenal medulla. Journal of Physiology. 2000;528:473–487. doi: 10.1111/j.1469-7793.2000.00473.x. [DOI] [PMC free article] [PubMed] [Google Scholar]
- Inoue M, Imanaga I. Masking of A-type K+ channel in guinea pig cardiac cells by extracellular Ca2+ American Journal of Physiology. 1993;264:C1434–1438. doi: 10.1152/ajpcell.1993.264.6.C1434. [DOI] [PubMed] [Google Scholar]
- Inoue M, Ogawa K, Fujishiro N, Yano A, Imanaga I. Role and source of ATP for activation of nonselective cation channels by AlF complex in guinea pig chromaffin cells. Journal of Membrane Biology. 1996;154:183–195. doi: 10.1007/s002329900143. [DOI] [PubMed] [Google Scholar]
- Johnson LV, Walsh ML, Bockus BJ, Chen LB. Monitoring of relative mitochondrial membrane potential in living cells by fluorescence microscopy. Journal of Cell Biology. 1981;88:526–535. doi: 10.1083/jcb.88.3.526. [DOI] [PMC free article] [PubMed] [Google Scholar]
- Kourie JI. Interaction of reactive oxygen species with ion transport mechanisms. American Journal of Physiology. 1998;275:C1–24. doi: 10.1152/ajpcell.1998.275.1.C1. [DOI] [PubMed] [Google Scholar]
- Leyssens A, Nowicky AV, Patterson L, Crompton M, Duchen MR. The relationship between mitochondrial state, ATP hydrolysis, [Mg2+]i and [Ca2+]i studied in isolated rat cardiomyocytes. Journal of Physiology. 1996;496:111–128. doi: 10.1113/jphysiol.1996.sp021669. [DOI] [PMC free article] [PubMed] [Google Scholar]
- López-Barneo J. Oxygen-sensing by ion channels and the regulation of cellular functions. Trends in Neuroscience. 1996;19:435–440. doi: 10.1016/0166-2236(96)10050-3. [DOI] [PubMed] [Google Scholar]
- López J, González C, Ureña J, López-Barneo J. Low pO2 selectively inhibits K channel activity in chemoreceptor cells of the mammalian carotid body. Journal of General Physiology. 1989;93:1001–1015. doi: 10.1085/jgp.93.5.1001. [DOI] [PMC free article] [PubMed] [Google Scholar]
- López JR, González C, Pérez-Gía MT. Properties of ionic currents from isolated adult rat carotid body chemoreceptor cells: effect of hypoxia. Journal of Physiology. 1997;499:429–441. doi: 10.1113/jphysiol.1997.sp021939. [DOI] [PMC free article] [PubMed] [Google Scholar]
- Mojet MH, Mills E, Duchen MR. Hypoxia-induced catecholamine secretion in isolated newborn rat adrenal chromaffin cells is mimicked by inhibition of mitochondrial respiration. Journal of Physiology. 1997;504:175–189. doi: 10.1111/j.1469-7793.1997.175bf.x. [DOI] [PMC free article] [PubMed] [Google Scholar]
- Nicholls DG, Budd SL. Mitochondria and neuronal survival. Physiological Reviews. 2000;80:315–360. doi: 10.1152/physrev.2000.80.1.315. [DOI] [PubMed] [Google Scholar]
- Nicholls DG, Ward MW. Mitochondrial membrane potential and neuronal glutamate excitotoxicity: mortality and millivolts. Trends in Neuroscience. 2000;23:166–174. doi: 10.1016/s0166-2236(99)01534-9. [DOI] [PubMed] [Google Scholar]
- Riesco-Fagundo AM, Pérez-Giacute;a MT, González C, López-López JR. O2 modulates large-conductance Ca2+-dependent K+ channels of rat chemoreceptor cells by a membrane-restricted and CO-sensitive mechanism. Circulation Research. 2001;89:430–436. doi: 10.1161/hh1701.095632. [DOI] [PubMed] [Google Scholar]
- Semenza GL. Perspectives on oxygen sensing. Cell. 1999;98:281–284. doi: 10.1016/s0092-8674(00)81957-1. [DOI] [PubMed] [Google Scholar]
- Smith HE, Page E. Morphometry of rat heart mitochondrial subcompartments and membranes: application to myocardial cell atrophy after hypophysectomy. Journal of Ultrastructure Research. 1976;55:31–41. doi: 10.1016/s0022-5320(76)80079-2. [DOI] [PubMed] [Google Scholar]
- Soltoff SP, Mandel LJ. Active ion transport in the renal proximal tubule. III. The ATP dependence of the Na pump. Journal of General Physiology. 1984;84:643–662. doi: 10.1085/jgp.84.4.643. [DOI] [PMC free article] [PubMed] [Google Scholar]
- Thompson RJ, Jackson A, Nurse CA. Developmental loss of hypoxic chemosensitivity in rat adrenomedullary chromaffin cells. Journal of Physiology. 1997;498:503–510. doi: 10.1113/jphysiol.1997.sp021876. [DOI] [PMC free article] [PubMed] [Google Scholar]
- Tomlinson A, Durbin J, Coupland RE. A quantitative analysis of rat adrenal chromaffin tissue: morphometric analysis at tissue and cellular level correlated with catecholamine content. Neuroscience. 1987;20:895–904. doi: 10.1016/0306-4522(87)90250-8. [DOI] [PubMed] [Google Scholar]
- Ureña J, Fernández-Chacón R, Benot AR, Alvarez de Toledo G, López-Barneo J. Hypoxia induces voltage-dependent Ca2+ entry and quantal dopamine secretion in carotid body glomus cells. Proceedings of the National Academy of Sciences of the USA. 1994;91:10208–10211. doi: 10.1073/pnas.91.21.10208. [DOI] [PMC free article] [PubMed] [Google Scholar]
- Wakabayashi S, Shigekawa M, Pouyssegur J. Molecular physiology of vertebrate Na+/H+ exchangers. Physiological Reviews. 1997;77:51–74. doi: 10.1152/physrev.1997.77.1.51. [DOI] [PubMed] [Google Scholar]
- Wyatt CN, Peers C. Ca2+-activated K+ channels in isolated type I cells of the neonatal rat carotid body. Journal of Physiology. 1995;483:559–565. doi: 10.1113/jphysiol.1995.sp020606. [DOI] [PMC free article] [PubMed] [Google Scholar]