

Abstract
Relationships between calcium signals and NADH responses were investigated in pancreatic acinar cells stimulated with calcium-releasing secretagogues. Cytosolic calcium signals were studied using Fura Red or calcium-sensitive Cl− current. Mitochondrial calcium was measured using Rhod-2. The highest levels of NADH autofluorescence were found around the secretory granule region. Stimulation of cells with physiological doses of cholecystokinin (CCK) triggered slow oscillations of NADH autofluorescence. NADH oscillations were clearly resolved in the mitochondrial clusters around secretory granules. Very fast apical calcium signals induced by acetylcholine (ACh) produced no detectable changes in NADH; slightly more extended apical (or preferentially apical) calcium transients triggered clear NADH responses. Triple combined recordings of cytosolic calcium, mitochondrial calcium and NADH revealed the sequence of development of individual signals: an increase in cytosolic calcium was accompanied by a slower mitochondrial calcium response followed by a delayed increase in NADH fluorescence. Recovery of cytosolic calcium was faster than recovery of mitochondrial calcium. NADH recovery occurred at elevated mitochondrial calcium levels. During the transient cytosolic calcium oscillations induced by intermediate doses of ACh, there was an initial increase in NADH fluorescence following the first calcium transient; each of the subsequent calcium responses produced biphasic NADH changes comprising an initial small decline followed by restoration to an elevated calcium level. During the higher-frequency sinusoidal calcium oscillations induced by higher doses of ACh, NADH responses fused into a smooth rise followed by a slow decline. Supramaximal doses of ACh and CCK produced single large NADH transients.
As an important second messenger, calcium triggers a broad range of energy-consuming cellular reactions like contraction, secretion and gene expression (Clapham, 1995; Berridge et al. 1998; Brini & Carafoli, 2000). To match the increased energy demand, calcium simultaneously upregulates the rates of NADH production and ATP synthesis (McCormack et al. 1990; Hajnoczky et al. 1995; Robb-Gaspers et al. 1998; Jouaville et al. 1999). Mitochondria are capable of decoding–converting calcium signals into changes in energy production (Hajnoczky et al. 1995; Jouaville et al. 1999). In other words, calcium is an essential regulator of mitochondrial metabolism (McCormack et al. 1990; Duchen, 2000a; Rizzuto et al. 2000). Abnormalities of calcium signalling can trigger varied forms of mitochondrial pathology (Brini et al. 1999; Szalai et al. 1999; Duchen, 2000b).
Increases of calcium in mitochondria in response to physiological stimuli have been recorded in a variety of cell types. This has been achieved using indicator proteins that are targeted to mitochondria, for example the bioluminescent protein aequorin (Rizzuto et al. 1992, 1994; Rutter et al. 1996), and fluorescent cameleons (Arnaudeau et al. 2001). Small fluorescent calcium indicators, which preferentially accumulate in mitochondria due to the negative (with respect to cytosol) membrane potential of these organelles (e.g. Rhod-2), have also been used for calcium measurements in mitochondria (Babcock et al. 1997; Gonzalez et al. 2000; Park et al. 2001). Changes in total mitochondrial calcium that occur following cell stimulation have been recorded using X-ray microanalyses (Isenberg et al. 1993; Pivovarova et al. 1999).
Calcium, driven by large negative mitochondrial membrane potentials, enters mitochondria via a calcium uniporter (reviewed in Bernardi, 1999; Duchen, 2000a; Rizzuto et al. 2000). Another proposed calcium influx pathway in mitochondria is the rapid uptake mode (Buntinas et al. 2001). In a number of cell types, calcium entry into the mitochondria occurs particularly efficiently when calcium is released from the internal stores (Rizzuto et al. 1993; Csordas et al. 1999; Szalai et al. 2000; Collins et al. 2001). This phenomenon has been attributed to the structural proximity of the mitochondrial uniporters and calcium-releasing channels in the endoplasmic reticulum (ER; Rizzuto et al. 1998; Rutter & Rizzuto, 2000). Mitochondria can also effectively import calcium that enters through the voltage-gated (Montero et al. 2000) and store-operated (Lawrie et al. 1996; Collins et al. 2001; Szabadkai et al. 2001) calcium channels of the plasma membrane. The removal of calcium from mitochondria is mediated by the Na+−Ca2+ exchanger (reviewed by Bernardi, 1999); other extrusion mechanisms (e.g. the H+−Ca2+ exchanger) have also been described (Bernardi, 1999).
Mitochondria can significantly modulate calcium signalling in the cytosol: they have been shown to upregulate calcium influx through store-operated calcium entry channels (Gilabert & Parekh, 2000), suppress local calcium feedback activation of inositol trisphosphate receptors (Hajnoczky et al. 1999), prevent spreading of calcium waves (Tinel et al. 1999; Straub et al. 2000) and decrease the rate of calcium wave propagation (Boitier et al. 1999).
A number of components of the energy production cascade in mitochondria are affected by calcium. A direct effect of calcium on ATP synthase has been described (Territo et al. 2000). Recent experiments from Rizzuto's laboratory have revealed the existence of long-term priming of ATP synthesis by calcium (Jouaville et al. 1999). Calcium has also been shown to stimulate the respiratory chain and to increase proton motive force (Robb-Gaspers et al. 1998). Importantly, the elevation of intramitochondrial calcium triggers an increase in the activity of mitochondrial dehydrogenases: oxoglutarate dehydrogenase, isocitrate dehydrogenase and pyruvate dehydrogenase (McCormack et al. 1990; Robb-Gaspers et al. 1998) with the net effect of increasing NADH production (Hajnoczky et al. 1995; Robb-Gaspers et al. 1998). NADH is the important supplier of reducing equivalents to the respiratory chain of mitochondria. NADH fluoresces when excited by UV light; its oxidized form (NAD+) is not fluorescent (Mojet et al. 2000). NADH fluorescence can serve as a valuable indicator of mitochondrial metabolism. This was successfully utilized in studies of relationships between calcium oscillations and mitochondrial responses in hepatocytes, which revealed the particular efficiency of the oscillatory calcium mode in stimulating mitochondrial functions (Hajnoczky et al. 1995).
Pancreatic acinar cells are polarized secretory epithelial cells. The apical part of the cells is packed with secretory granules containing precursors of digestive enzymes (Bolender, 1974). The basal part of the cell contains a highly developed ER and a relatively large nucleus (in some cells two nuclei; Bolender, 1974). The highest density of mitochondria was found on the periphery of the secretory granule region (perigranular mitochondria; Tinel et al. 1999; Straub et al. 2000), smaller groups of mitochondria are located immediately adjacent to the basal plasma membrane (subplasmallemal mitochondria) and around the nucleus (perinuclear mitochondria; Tinel et al. 1999; Park et al. 2001).
In pancreatic acinar cells, the calcium signalling cascade is utilized by important secretagogues (e.g. the circulating hormone cholecystokinin (CCK) and the neurotransmitter ACh) to trigger and regulate the secretion of digestive enzymes (Williams et al. 1997). Fluid secretion in pancreatic acinar cells is also calcium dependent (Petersen et al. 1991; Kidd & Thorn, 2001). Pancreatic acinar cells conveniently express calcium-dependent Cl− channels (Petersen et al. 1991; Petersen, 1992; Kidd & Thorn, 2001), enabling cytosolic calcium to be monitored electrophysiologically.
A variety of calcium signalling patterns is produced by calcium-releasing secretagogues in pancreatic acinar cells. These include: calcium oscillations localized to the secretory granule region, global transient oscillations composed of large calcium spikes taken from the baseline, and fast sinusoidal calcium oscillations superimposed on an elevated calcium plateau (Osipchuk et al. 1990; Petersen et al. 1991; Yule et al. 1991; Thorn et al. 1993). Specific groups of mitochondria participate in the regulation of the calcium concentration in their distinct regions of the cytosol (Park et al. 2001). In particular, perigranular mitochondria are important for confining calcium signals to the secretory granular region during localized calcium oscillations (Tinel et al. 1999; Straub et al. 2000).
The clear polarity of pancreatic acinar cells and the rich variety of calcium signalling patterns make this cell type an interesting model for studies of the effects of calcium on mitochondria. The aim of this study was to characterize relationships between mitochondrial NADH responses and the different secretagogue-induced patterns of calcium signals found in pancreatic acinar cells.
METHODS
Cell preparation
Fresh mouse pancreatic acinar cells were prepared using collagenase (Worthington, code CLSPA, 200 U ml−1, 14 min, 37 °C), as described previously (Osipchuk et al. 1990) and used within 4 h. Pancreata were obtained from adult male mice (CD1) that had been killed by cervical dislocation, in accordance with the Animals (Scientific Procedures) Act, 1986. All experiments were performed at room temperature (22–25 °C). In some experiments, which involved measurements of cytosolic calcium, cells were loaded with Fura Red-AM (5 μm) at room temperature for 20 min. For measurements of mitochondrial calcium, cells were loaded with Rhod-2-AM (4.5 μm) in the presence of 0.01% pluronic F-127, for 30 min at 37 °C. For labelling the mitochondria, we loaded cells with Mito Tracker Red CMXRos (50 nm) for 15 min at 37 °C.
Solutions
The extracellular bathing solution contained (mm): NaCl 140, KCl 4.7, MgCl2 1.13, CaCl2 1, glucose 10 and Hepes 10 (adjusted to pH 7.3 by NaOH). The pipette solution contained (mm): KCl 130, NaCl 10, MgCl2 1.5, K2ATP 2, EGTA 0.1 and Hepes 10 (adjusted to pH 7.2 by KOH). The cells were placed on a glass coverslip coated with poly-l-lysine (0.01%) and attached to an open perfusion chamber. Solutions were perfused using a gravity-fed system.
Confocal imaging
Confocal imaging of the cells was performed using a Zeiss LSM510 confocal system. This system allows rapid changes of excitation wavelength in a multi-track configuration.
Fura Red was excited by an argon laser line at 488 nm, and fluorescence was collected through an LP585 filter. The fluorescence of Fura Red decreases upon calcium binding. The fluorescence of Rhod-2 was excited using a laser line at 543 nm, and the emitted light was collected using an LP560 filter. NADH fluorescence was measured by excitation with a UV laser line at 351 nm, and autofluorescence was collected using a BP 385–470 filter. Mito Tracker Red fluorescence was excited at 543 nm, and the emission was collected using an LP585 filter.
Fluorescence changes were usually expressed as F/F0 × 100%, where F is the fluorescence of an indicator (or autofluorescence) and F0 is the initial fluorescence. The fluorescence was usually corrected for bleaching, using initial (before stimulation) parts of the curves. The relative amplitude of fluorescence responses was measured as ΔFmax/F0 × 100%, where ΔFmax is the maximal change of fluorescence due to stimulation. The measurements are given as averaged value ± s.e.m., and n represents the number of cells (except when specifically indicated otherwise). A C-Apochromat × 63 objective with a numerical aperture of 1.2 was used in all experiments. For image analysis we used Zeiss confocal 510 image software.
The Kd for Fura Red was assumed to be 140 nm. Cytosolic calcium was calibrated using exposure of the cells to 10–20 μm ionomycin and 10 mm calcium or 4 mm EGTA.
Patch-clamp recording
Standard patch-clamp, whole-cell current recording (Hamill et al. 1981) was used. The electrophysiological recordings of calcium-dependent Cl− currents were used as a sensitive measure of changes in cytosolic calcium. The recordings were made using an EPC-8 amplifier and Pulse software (HEKA). The holding potential was −30 mV. The pipette resistance was 2–3 MΩ. Patch-clamp pipettes were pulled from borosilicate glass capillaries (GC150TF-7.5, Harvard Apparatus) on a DMZ-Universal puller (Zeitz-Instrumente, Germany).
Chemicals
Fura Red-AM, Rhod-2-AM and Mito Tracker Red CMXRos were purchased from Molecular Probes (Eugene, OR, USA). RU360 was from Calbiochem (Nottingham, UK). All other chemicals were purchased from Sigma (Gillingham, UK) and were of the highest grade available.
RESULTS
Calcium and NADH responses triggered by CCK
NADH responses triggered by low (physiological) doses of CCK and by supramaximal CCK stimulation
The distribution of NADH autofluorescence in pancreatic acinar cells was similar to that found with Mito Tracker Green (Tinel et al. 1999), tetramethylrhodamine ethyl ester (TMRE) (Raraty et al. 2000) and Rhod-2 (Park et al. 2001). The highest intensity of fluorescence was systematically found around the secretory granule region (Fig. 1A, B and D) confirming the perigranular clustering of mitochondria (Tinel et al. 1999; Park et al. 2001). This was verified by direct comparison of the distributions of NADH autofluorescence (Fig. 1Da) and fluorescence of Mito Tracker Red (Fig. 1Db). Both images reveal very similar distributions of fluorescence (see also overlay image in Fig. 1Dc). There was clear clustering of both types of fluorescence around the secretory granule region (Fig. 1Da–d), but some staining close to the plasma membrane was also seen.
Figure 1. Distribution of NADH fluorescence and oscillations of NADH fluorescence triggered by cholecystokinin (CCK).
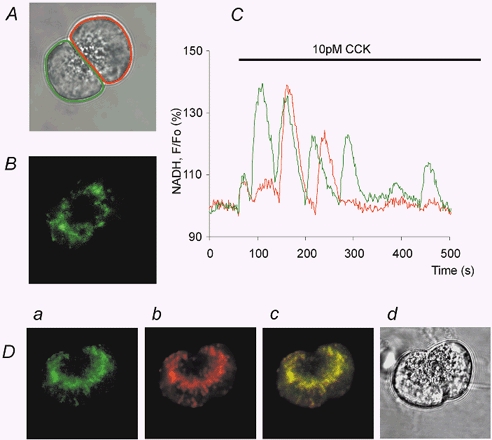
A, transmitted light image showing the structure of the acinar doublet under investigation, with the two areas of interest identified by the different colours (around the cells). B, distribution of NADH autofluorescense in the same acinar doublet. C, oscillation of NADH autofluorescence recorded in the individual cells (from the regions of interest specified in A). D, distribution of NADH autofluorescence (Da) and Mito Tracker Red fluorescence (Db) in the two cells. Dc shows the overlay image of Da and Db. A transmitted light image of this doublet is shown in Dd.
Low (physiological) CCK concentrations produced oscillations of NADH fluorescence (Fig. 1C). The oscillations were composed of spikes of NADH fluorescence (usually a few tens of seconds in duration) with complete or almost complete recovery to the pre-stimulated level of fluorescence (n = 36). Whilst low (physiological) CCK stimulations produced oscillating NADH responses, supramaximal stimulation with CCK resulted in just one extended (more than 200 s) NADH transient (n = 18; see Fig. 2A), which recovered to the resting (or slightly lower than resting) level. Control experiments with rotenone, which is a classical inhibitor of complex I (Mojet et al. 2000), were performed to verify that the changes in fluorescence were due to changes in mitochondrial NADH concentration. Rotenone has been shown to elevate NADH autofluorescence in a number of cell types (Robb-Gaspers et al. 1998; Szalai et al. 2000; Szabadkai et al. 2001). In our experiments, application of rotenone (2 μm) resulted in a strong increase in fluorescence (Fig. 2B; n = 11); subsequent stimulation with CCK had no effect (Fig. 2B; n = 9).
Figure 2. Changes of NADH autofluorescence in a cell stimulated with a supramaximal dose of CCK.
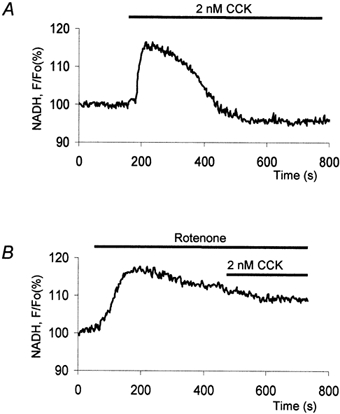
A, stimulation with 2 nm CCK results in a transient elevation of NADH. B, rotenone (2 μm) induced an increase in NADH autofluorescence; subsequent supramaximal stimulation with CCK had no effect.
Correlation between the calcium oscillations triggered by low doses of CCK and NADH responses
The correlation between calcium and NADH responses was studied using cells stained with Fura Red. Stimulation with low doses of CCK (10–20 pm) produced oscillations of calcium concentration in pancreatic acinar cells (n = 24). These oscillations (see Fig. 3) usually comprised individual large (approximately 400 nm) calcium transients that arose from the baseline and recovered back to baseline. The frequency of these large calcium transients was low (1–2 per 100 s). The first spike was usually more prolonged than subsequent transients. The interspike baseline was similar to the resting calcium level before stimulation. An example of such calcium oscillations and accompanying NADH signals is shown in Fig. 3. The increases in NADH fluorescence were slightly delayed in comparison with the calcium transients (Fig. 3). Recovery of NADH signals was substantially slower than the recovery of cytosolic calcium transients. Figure 3 shows transmitted light and fluorescence images of cells (Fig. 3A), changes in Fura Red and NADH fluorescence recorded from whole cells (Fig. 3B) and from nuclei (Fig. 3C) and clusters of mitochondria that surround secretory granule regions (Fig. 3D). The positions of nuclei were identified by the slightly higher fluorescence of Fura Red (Fig. 3Ab). In the nucleus, the region of interest was selected in such a way that the fluorescence was recorded from the central region, thus avoiding the perinuclear regions. The mitochondria are clearly seen as structures with increased NADH fluorescence, mainly clustering in the perigranular region (Fig. 3Ac). The localization of mitochondria was similar to that identified previously with Mito Tracker Green (Tinel et al. 1999).
Figure 3. Simultaneous measurement of the Fura Red and NADH fluorescence in cells stimulated with 20 pm CCK.

A, images of the cells under investigation. Aa, the transmitted light picture shows the structure of an acinar doublet with numbered cells (1 and 2). Ab, fluorescence image of the same acinar cells loaded with Fura Red. The dye concentration in the nucleus is usually higher than in the cytoplasm. Ac, autofluorescence image of the same cells showing the distribution of NADH. B, Fura Red and NADH responses evoked by 20 pm CCK in cell 1 and cell 2. Regions of interest covered the whole cell. Here and in C and D, the regions of interest for both cells are specified on the y-axis. The decrease of Fura Red fluorescence corresponds to an increase in cytosolic calcium concentration. C, Fura Red and NADH recordings from the nuclei. D, Fura Red and NADH recordings from the perigranular mitochondria.
Negative deflections of Fura Red traces (seen on this and the following figures) correspond to elevations of cytosolic calcium. NADH and calcium signals recorded from the area of the perigranular belt were similar to those recorded from the whole cell (Fig. 3B and D), indicating that the perigranular mitochondria are the major contributors to the total NADH signal from whole cells. However, in the nuclei no changes in NADH fluorescence could be resolved, in spite of clearly detectable calcium signals (Fig. 3C). Sometimes, small calcium signals (preferentially localized to the apical part of the cells) could be found amid large and global CCK-induced transients. The changes in NADH corresponding to these small calcium events were difficult to delineate within the background of the much larger changes induced by global calcium transients.
NADH and calcium responses triggered by ACh
In this section we will consider different patterns of calcium oscillations and accompanying NADH changes that were triggered by ACh. We will sequentially discuss patterns of calcium and NADH signals characteristic for stimulation with small, intermediate and high doses of ACh.
Calcium oscillation preferentially localized to the secretory region of the cells
One of the types of calcium oscillations that have been reported previously to occur in pancreatic acinar cells is composed of very short calcium transients localized to the secretory granule (apical) part of the cell (Kasai et al. 1993; Thorn et al. 1993). This type of calcium signal can be produced in some cells as a result of the application of small doses of ACh (10–25 nm). Initially we used electrophysiological recordings of the calcium-sensitive Cl− current as a measure of cytosolic calcium. A correlation of Cl− current and cytosolic calcium in pancreatic acinar cells has been described in a number of studies (Petersen, 1992; Kidd & Thorn, 2000). Note that downward deflections of current traces on the figures discussed in this section correspond to calcium elevations. Electrophysiological measurements were combined with measurements of NADH fluorescence. We could not resolve changes in NADH signals during fast (less than 2.9 s) spikes of calcium-dependent Cl− currents (n = 5; Fig. 4A). Slightly more prolonged calcium transients could produce NADH responses (Fig. 4B; n = 5). The first of the two spikes in Fig. 4B is only 3 s (corresponding calcium responses were shown to be preferentially localized in the apical region; Thorn et al. 1993); this calcium signal initially triggers a small downward deflection in NADH fluorescence followed by a strong rise (Fig. 4B).
Figure 4. Simultaneous measurements of cytosolic calcium and NADH responses induced by a small dose of ACh.
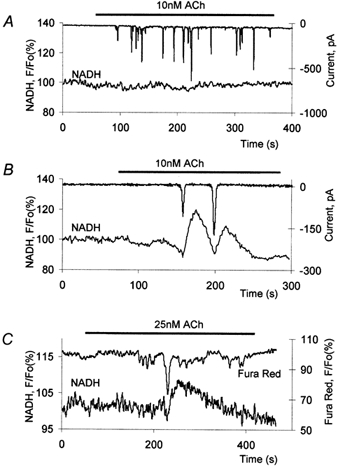
The upper traces in A and B show measurements of the calcium-dependent Cl− current; note that a rise in calcium results in a downward deflection of the current. The lower traces show whole-cell NADH measurements. A, an example of fast transients with an absence of accompanying NADH responses. B, slightly more prolonged cytosolic calcium transients triggered large NADH responses. C, simultaneous measurements of Fura Red and NADH responses induced by small doses of ACh. This figure shows a combination of fast calcium responses of small amplitude and a more prolonged large calcium response. Only a large calcium transient induced an NADH response.
Figure 4C shows the results of combined recordings of Fura Red fluorescence and NADH autofluorescence. In these experiments (as with electrophysiological recordings) we were not able to resolve increases in NADH fluorescence during very short (less than 3.6 s; n = 9) local calcium transients (see the first four small and fast transients in Fig. 4C). However, slightly longer (more than 3.6 s; n = 6) calcium signals (but still preferentially located in the apical pole) could trigger NADH responses (see following large transient in Fig. 4C), composed of an initial small and fast decline, followed by a larger and more prolonged rise. Interestingly, some short-lasting calcium transients only produced small negative NADH deflections without subsequent positive components (n = 5, not shown).
In previous work we have identified two other smaller groups of mitochondria: sub-plasmalemmal and perinuclear. Because of the low level of NADH autofluorescence, the noise of the recordings was usually such that it was impossible to resolve details of the NADH responses in small groups of mitochondria.
Simultaneous measurements of cytosolic calcium, mitochondrial calcium and NADH responses triggered by small doses of ACh
A combination of electrophysiological and optical recordings allowed us to monitor simultaneously changes in cytosolic calcium, mitochondrial calcium and NADH. The cytosolic calcium response was assessed using the calcium-dependent Cl− current. Mitochondrial calcium was recorded using Rhod-2, which we have used successfully as a mitochondrial calcium probe in pancreatic acinar cells previously (Park et al. 2001). An example of the triple recording is shown in Fig. 5. In previous experiments described in this paper, the rise of NADH fluorescence was shown to be consistently delayed with respect to elevations in cytosolic calcium (for example see Figs 3B, 4B and C). Combined recordings of cytosolic calcium, mitochondrial calcium and NADH (Fig. 5) indicate that this effect was not due to a delay in the onset of mitochondrial calcium accumulation (n = 4).
Figure 5. Simultaneous recording of cytosolic calcium (calcium-sensitive current), mitochondrial calcium (Rhod-2) and the NADH response induced by ACh.
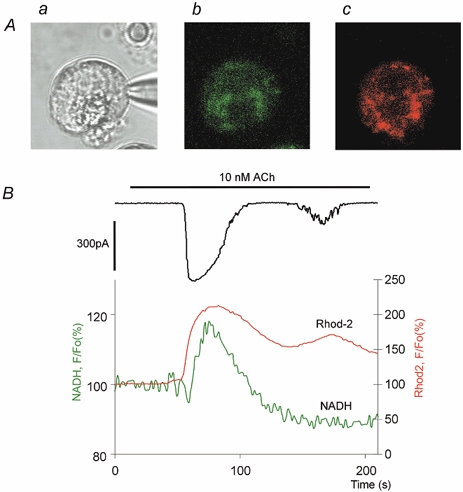
A, images of the cell. Aa, in transmitted light. Ab, NADH autofluorescence. Ac, Rhod-2 fluorescence at the peak of the Rhod-2 response. B, the upper trace shows current changes; the intermediate (red) trace shows the whole-cell Rhod-2 response. The lower (green) trace represents NADH changes.
The increase in mitochondrial calcium started almost immediately following cytosolic calcium elevation. This rise in mitochondrial calcium was slower than that of cytosolic calcium, with the result that the peak in mitochondrial calcium occurred later than that of cytosolic calcium. The onset of the rise in NADH was considerably delayed with respect to elevations in mitochondrial and cytosolic calcium (Fig. 5B). The delay between the onset of the current and NADH responses was 7.1 ± 0.3 s (n = 9, combined statistics for dual and triple recordings; only the first current and NADH transients were considered). The recovery of cytosolic calcium clearly occurred faster than that of mitochondrial calcium (Fig. 5B). Interestingly, the NADH response began to recover at the time when the calcium concentration in the mitochondria was still substantially elevated (Fig. 5B). The second calcium spike (Fig. 5B) was able to increase the Cl− current and elevate mitochondrial calcium, but had no effect on NADH. This could be interpreted as an indication of the threshold nature of the NADH responses to calcium, so that calcium in the cytosol and consequently in the mitochondria should reach a certain minimal value to be able to trigger an NADH response. This value was clearly not attained during this small calcium transient. Not only the duration, but also the amplitude of the calcium transients is important for their ability to trigger NADH responses. In our experiments with triple recordings we used small doses of ACh (10–25 nm) for stimulation of the cells. Surprisingly in these experiments no local calcium spikes were recorded. It seems that the combination of patch clamp and Rhod-2 staining somehow decreases the probability of generating local calcium transients.
Transient calcium oscillations composed of an initial large calcium spike followed by periodic global calcium responses
This pattern can be triggered by 20–100 nm ACh (n = 28). Examples of such oscillations are shown in Fig. 6A (Fura Red and NADH measurements) and Fig. 6B (Cl− current and NADH measurements).
Figure 6. NADH and calcium responses to intermediate doses of ACh.
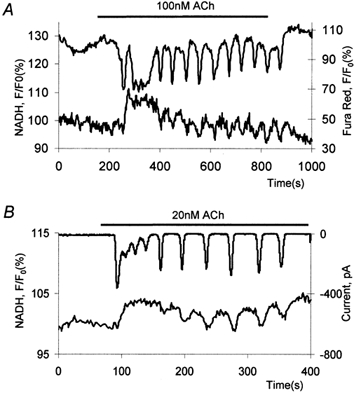
A, a simultaneous recording of Fura Red and NADH responses. The upper trace shows the whole-cell Fura Red response comprising an initial prolonged calcium spike followed by periodical calcium transients; the lower trace shows corresponding NADH changes. B, a simultaneous recording of membrane current (upper trace) and NADH (lower trace).
These oscillations usually started with an initial, large and prolonged calcium transient of varied shape, which was followed by regular and periodic calcium transients (Fig. 6A and B). These subsequent transients could have complete recovery to a prestimulated level or could be superimposed on a slightly elevated background. NADH levels always increased after the first transient. The subsequent calcium transients (e.g. see spikes 3–12 in Fig. 6A and the last 6 spikes in Fig. 6B) were accompanied with small transient decreases of NADH fluorescence. These ‘dents’ in the NADH response curve were particularly visible on the elevated plateau after the first transients. Each of the subsequent calcium responses produced rapid negative NADH changes followed by a slower restoration of the NADH plateau level (Fig. 6A and B). Small negative NADH responses were also seen to accompany other forms of calcium signals, but they were particularly visible during this type of cytosolic calcium oscillation.
Sinusoidal oscillations superimposed on an elevated calcium plateau and responses triggered by supramaximal doses of ACh
Sinusoidal calcium oscillations were triggered by relatively high doses of ACh (100 nm to 1 μm; n = 14). High-frequency (5–20 spikes per 100 s) oscillations were superimposed on a considerably elevated calcium level (Fig. 7). The rise in calcium was followed by an increase in NADH fluorescence. The effects of individual calcium spikes on NADH fluorescence during fast sinusoidal oscillations were not possible to resolve. The rise of NADH fluorescence was followed by a slow decline developing in spite of the elevated cytosolic calcium level and superimposed calcium oscillations.
Figure 7. Sinusoidal calcium oscillations and accompanying NADH response induced by ACh.
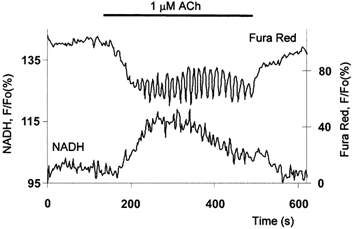
The upper trace shows whole-cell Fura Red changes; the lower trace shows the NADH transient.
High doses of ACh (1–10 μm) produced NADH responses similar to that triggered by supramaximal CCK stimulation (n = 36, not shown). Preincubation of cells (30 min) with a blocker of the mitochondrial calcium uniporter (RU360, 10 μm) resulted in partial inhibition of NADH responses induced by 1 μm ACh. The relative amplitude of the NADH response was 15.0 ± 1.3% (s.e.m., n = 36); this decreased to 9.3 ± 1.4% (s.e.m., n = 16) after RU360 treatment.
DISCUSSION
In pancreatic acinar cells, the calcium signalling cascade is used by secretagogues to trigger and regulate the secretion of digestive enzymes (Williams et al. 1997; Kidd & Thorn, 2001). It has been shown for a number of cell types that an increase in cytosolic calcium results in a mitochondrial calcium rise. This in turn serves to increase the activity of mitochondrial dehydrogenases and of other mechanisms involved in ATP production (McCormack et al. 1990; Hajnoczky et al. 1995; Robb-Gaspers et al. 1998; Jouaville et al. 1999). Our study demonstrates that mitochondria in pancreatic acinar cells can also react to an increase in cytosolic calcium by up-regulation of NADH production. The calcium-releasing secretagogues produce complex patterns of cytosolic calcium oscillations, which trigger the ATP-consuming processes of secretion. These same oscillations should activate reactions in the mitochondria that are necessary to compensate for the loss of ATP. This work aimed to correlate the calcium signalling patterns induced by secretagogues with changes in mitochondrial activity.
Our experiments demonstrate that physiological concentrations of the circulating hormone CCK induce oscillatory elevations of NADH (Fig. 1). Each of the large CCK-induced cytosolic calcium spikes in pancreatic acinar cells triggers secretion (Ito et al. 1997), and induces the opening of calcium-sensitive channels (Petersen, 1992) and activation of calcium pumps of the ER and plasma membrane (Tepikin et al. 1992; Camello et al. 1996). Some of these processes will demand immediate energy expenditure (e.g. pumping of calcium ions and exocytosis), some will impose later energy demands (e.g. endocytosis and restoration of Cl−, Na+ and K+ gradients). The transients of CCK-induced NADH oscillations reflect an increase in the activity of mitochondrial calcium-sensitive dehydrogenases or, in other words, an increased rate of turnover of the Krebs cycle. An elevation in NADH concentration signifies an increase in the availability of reduced equivalents for the mitochondrial respiratory chain. Therefore, the physiological stimulation of pancreatic acinar cells is accompanied by efficient upregulation of energy production to compensate for the increased energy demand. The CCK-induced calcium transients are low-frequency events. Because of this, the NADH transients do not usually fuse into a plateau. Each of the NADH transients is substantially broader, time-wise, than its corresponding cytosolic calcium trigger. Such an arrangement will have the advantage of prolonging enhanced energy production for some time after termination of the cytosolic calcium signal, so that all of the energy demands for restoration of the steady states that have been disturbed by calcium signals could be met.
Importantly, the distribution of NADH autofluorescence confirmed previous reports of preferential perigranular clustering of mitochondria in pancreatic acinar cells (Tinel et al. 1999; Straub et al. 2000; Park et al. 2001). This was further verified in our study by comparison of NADH autofluorescence and Mito Tracker Red fluorescence. The clearly resolved changes in NADH autofluorescence in the perigranular region induced by calcium-releasing secretagogues confirm that these mitochondria are capable of sensing and responding to calcium changes in the cytosol. The relatively low brightness of NADH autofluorescence and modest changes of NADH signals made it difficult to study other smaller mitochondrial groups in pancreatic acinar cells.
NADH is a small molecule and because of the high permeability of nuclear pore complexes, nuclear changes in NADH fluorescence should reflect the NADH changes in the cytosol. The absence of measurable NADH changes in confocal sections through the nuclei (Fig. 3), and similarity between whole-cell and mitochondrial responses indicate that the whole-cell NADH responses are determined by intramitochondrial NADH.
We have not been able to resolve changes in NADH fluorescence corresponding to very fast local calcium signals in the secretory granule region of pancreatic acinar cells. It is possible that these signals occupy only a small part of the secretory granule region and are quenched in calcium buffer before reaching the perigranular mitochondria. It is also conceivable that we were unable to detect the effects of very fast local transients on the NADH level for purely technical reasons (i.e. the noise of recordings may have been too high to resolve the changes in a few affected mitochondria). It is interesting to note that in a recent study by Straub and colleagues (Straub et al. 2000), mitochondrial inhibitors had no effect on the shape of very small and fast calcium signals in the secretory granular region of pancreatic acinar cells. However, in the same study it is reported that calcium signals that are somewhat more extended, but still localized to the apical pole, are converted to global responses by inhibiting the mitochondria. Our data confirm that such more extended, but still preferentially apical, calcium responses are indeed sensed by mitochondria and are capable of changing mitochondrial metabolism.
In hepatocytes, vasopressin induces calcium transients of high amplitude, and each of these transients induces maximal activation of NADH (Hajnoczky et al. 1995). In pancreatic acinar cells, however, small (physiological) doses of secretagogues induce calcium transients of variable amplitude, followed with highly variable NADH responses (Figs 3, 4 and 5). Pancreatic acinar cells can therefore regulate NADH responses by modulating both the amplitude and frequency of their calcium signals.
The mitochondrial NADH responses were sometimes biphasic, being composed of an initial decline followed by a slower rise. Interestingly, a similar type of biphasic response has been described in sensory neurones (Duchen, 1992), where the initial fast decline of NADH fluorescence was attributed to the direct stimulation of mitochondrial coenzymes as a result of mitochondrial depolarization induced by calcium influx. In pancreatic acinar cells, changes in mitochondrial potential were not resolved during stimulation of the cells with secretagogues (Raraty et al. 2000). This, however, does not preclude stimulation of the respiratory chain. Indeed, to prevent depolarization due to the influx of calcium through the uniporter, the mitochondria should operate a very precise and efficient charge compensation mechanism. This is possibly based on an increase of H+ extrusion by the stimulated respiratory chain. Interestingly, the negative NADH responses were particularly visible when they were superimposed on the elevated NADH level (e.g. see Fig. 6), suggesting that NADH consumption is induced particularly strongly in activated mitochondria.
The calcium-dependent increase in respiratory chain activation has been documented by Robb-Gaspers et al. (1998). A similar process could contribute to a reduction in NADH concentration after its initial rise during long-lasting global calcium transients or sinusoidal calcium oscillations.
We succeeded in performing triple combined simultaneous recordings of cytosolic calcium, intramitochondrial calcium and NADH autofluorescence. Unlike Gonzalez et al. (2000), we did not see a delay between the onsets of cytosolic and mitochondrial calcium responses; however, the mitochondrial calcium accumulation was slower than the cytosolic response. The increase in NADH was substantially (7.1 ± 0.3 s) delayed in comparison with cytosolic and mitochondrial calcium elevations. The recovery of mitochondrial calcium was slower than the recovery of cytosolic calcium.
An interesting possibility of mitochondrial calcium-induced calcium release (CICR) mediated by permeability transition pores has been described (Ichas et al. 1997). The recent discovery of ryanodine receptors in mitochondria (Beutner et al. 2001) suggests another possible CICR mechanism for this organelle. In our experiments, however, we have not seen indications of mitochondrial CICR during cytosolic calcium oscillations.
The delayed recovery of mitochondrial calcium in comparison with cytosolic calcium during transient oscillations suggests that calcium that accumulates in the mitochondria could be returned to the ER during the interspike period, thus completing the ER-mitochondria- ER cycle. Such cycling was recently described in the elegant study by Arnaudeau et al. (2001).
In our experiments, the NADH responses were clearly delayed in comparison with both cytosolic and mitochondrial calcium changes. For stimulation with low or intermediate doses of agonists, the recovery of mitochondrial calcium and the recovery of NADH transients were both slower than the recovery of cytosolic calcium. This creates the possibility of two levels of integration of cytosolic calcium responses by mitochondria. Indeed, when the rate of cytosolic calcium oscillations becomes greater than two transients per 100 s, the mitochondrial NADH responses fuse into elevated plateaux.
What about the shape of the physiological NADH responses? The nature of physiological responses of NADH to ACh stimulation is not clear. ACh is a neurotransmitter, which in the pancreas should be destroyed rapidly by esterases after its release from the terminals of peripheral neurones (Davison et al. 1980). The short pulses of ACh stimulation triggered calcium transients that were preferentially localized to the apical part of pancreatic acinar cells and largely excluded from the nucleus and the basal cytosol. Such transients could be quite prolonged (lasting up to 10 s; Gerasimenko et al. 1996) and should trigger changes of NADH fluorescence. The frequency of ACh-induced cytosolic calcium transients under physiological conditions is not known, therefore it is not clear whether NADH responses to this agonist are fused or oscillatory. The pattern of changes in calcium in response to physiological CCK stimulations is clearer. Even at the upper range of physiological concentrations of CCK, the global cytosolic calcium transients seem to have a rather low frequency. Therefore, the physiological NADH responses triggered by CCK in pancreatic acinar cells are most probably oscillatory.
As in hepatocytes (Hajnoczky et al. 1995; Robb-Gaspers et al. 1998), supramaximal doses of calcium-releasing agonists produce just one transient rise of NADH, followed by complete recovery. The smaller ‘oscillatory’ doses of the secretagogues are capable of producing repetitive or sustained NADH responses, confirming the notion of the higher efficiency of calcium oscillations in the activation of mitochondrial metabolism. Furthermore, transient oscillations (of the type produced by physiological doses of CCK) with complete after-spike recovery should be more efficient for long-term energy production than sinusoidal oscillations that are superimposed on an elevated calcium plateau.
Acknowledgments
We thank Mark Houghton and Illya Kruglikov for technical support. This work was supported by a Medical Research Council Programme Grant and a Human Frontiers Science Programme grant. O.H.P. is a Medical Research Council Research Professor. The work of T.S. in Liverpool was supported by an INTAS Grant.
REFERENCES
- Arnaudeau S, Kelley WL, Walsh JV, Jr, Demaurex N. Mitochondria recycle Ca2+ to the endoplasmic reticulum and prevent the depletion of neighboring endoplasmic reticulum regions. Journal of Biological Chemistry. 2001;276:29430–29439. doi: 10.1074/jbc.M103274200. [DOI] [PubMed] [Google Scholar]
- Babcock DF, Herrington J, Goodwin PC, Park YB, Hille B. Mitochondrial participation in the intracellular Ca2+ network. Journal of Cell Biology. 1997;136:833–844. doi: 10.1083/jcb.136.4.833. [DOI] [PMC free article] [PubMed] [Google Scholar]
- Bernardi P. Mitochondrial transport of cations: channels, exchangers, and permeability transition. Physiological Reviews. 1999;79:1127–1155. doi: 10.1152/physrev.1999.79.4.1127. [DOI] [PubMed] [Google Scholar]
- Berridge MJ, Bootman MD, Lipp P. Calcium - a life and death signal. Nature. 1998;395:645–648. doi: 10.1038/27094. [DOI] [PubMed] [Google Scholar]
- Beutner G, Sharma VK, Giovannucci DR, Yule DI, Sheu SS. Identification of a ryanodine receptor in rat heart mitochondria. Journal of Biological Chemistry. 2001;276:21482–21488. doi: 10.1074/jbc.M101486200. [DOI] [PubMed] [Google Scholar]
- Boitier E, Rea R, Duchen MR. Mitochondria exert a negative feedback on the propagation of intracellular Ca2+ waves in rat cortical astrocytes. Journal of Cell Biology. 1999;145:795–808. doi: 10.1083/jcb.145.4.795. [DOI] [PMC free article] [PubMed] [Google Scholar]
- Bolender RP. Stereological analysis of the guinea pig pancreas. I. Analytical model and quantitative description of nonstimulated pancreatic exocrine cells. Journal of Cell Biology. 1974;61:269–287. doi: 10.1083/jcb.61.2.269. [DOI] [PMC free article] [PubMed] [Google Scholar]
- Brini M, Carafoli E. Calcium signalling: a historical account, recent developments and future perspectives. Cellular and Molecular Life Sciences. 2000;57:354–370. doi: 10.1007/PL00000698. [DOI] [PMC free article] [PubMed] [Google Scholar]
- Brini M, Pinton P, King MP, Davidson M, Schon EA, Rizzuto R. A calcium signaling defect in the pathogenesis of a mitochondrial DNA inherited oxidative phosphorylation deficiency. Nature Medicine. 1999;5:951–954. doi: 10.1038/11396. [DOI] [PubMed] [Google Scholar]
- Buntinas L, Gunter KK, Sparagna GC, Gunter TE. The rapid mode of calcium uptake into heart mitochondria (RaM): comparison to RaM in liver mitochondria. Biochimica et Biophysica Acta. 2001;1504:248–261. doi: 10.1016/s0005-2728(00)00254-1. [DOI] [PubMed] [Google Scholar]
- Camello P, Gardner J, Petersen OH, Tepikin AV. Calcium dependence of calcium extrusion and calcium uptake in mouse pancreatic acinar cells. Journal of Physiology. 1996;490:585–593. doi: 10.1113/jphysiol.1996.sp021169. [DOI] [PMC free article] [PubMed] [Google Scholar]
- Clapham DE. Calcium signaling. Cell. 1995;80:259–268. doi: 10.1016/0092-8674(95)90408-5. [DOI] [PubMed] [Google Scholar]
- Collins TJ, Lipp P, Berridge MJ, Bootman MD. Mitochondrial Ca2+ uptake depends on the spatial and temporal profile of cytosolic Ca2+ signals. Journal of Biological Chemistry. 2001;276:26411–26420. doi: 10.1074/jbc.M101101200. [DOI] [PubMed] [Google Scholar]
- Csordas G, Thomas AP, Hajnoczky G. Quasi-synaptic calcium signal transmission between endoplasmic reticulum and mitochondria. EMBO Journal. 1999;18:96–108. doi: 10.1093/emboj/18.1.96. [DOI] [PMC free article] [PubMed] [Google Scholar]
- Davison JS, Pearson GT, Petersen OH. Electrophysiological investigations into exocrine pancreatic innervation. In: Ribet A, Pradayrol L, Susini C, editors. Biology of Normal and Cancerous Exocrine Pancreatic Cells, INSERM Symposium Series. Vol. 15. Amsterdam: Elsevier; 1980. pp. 83–88. [Google Scholar]
- Duchen MR. Ca2+ -dependent changes in the mitochondrial energetics in single dissociated mouse sensory neurons. Biochemical Journal. 1992;283:41–50. doi: 10.1042/bj2830041. [DOI] [PMC free article] [PubMed] [Google Scholar]
- Duchen MR. Mitochondria and Ca2+ in cell physiology and pathophysiology. Cell Calcium. 2000a;28:339–348. doi: 10.1054/ceca.2000.0170. [DOI] [PubMed] [Google Scholar]
- Duchen MR. Mitochondria and calcium: from cell signalling to cell death. Journal of Physiology. 2000b;529:57–68. doi: 10.1111/j.1469-7793.2000.00057.x. [DOI] [PMC free article] [PubMed] [Google Scholar]
- Gerasimenko OV, Gerasimenko JV, Petersen OH, Tepikin AV. Short pulses of acetylcholine stimulation induce cytosolic Ca2+ signals that are excluded from the nuclear region in pancreatic acinar cells. Pflügers Archiv. 1996;432:1055–1061. doi: 10.1007/s004240050234. [DOI] [PubMed] [Google Scholar]
- Gilabert JA, Parekh AB. Respiring mitochondria determine the pattern of activation and inactivation of the store-operated Ca2+ current I (CRAC) EMBO Journal. 2000;19:6401–6407. doi: 10.1093/emboj/19.23.6401. [DOI] [PMC free article] [PubMed] [Google Scholar]
- Gonzalez A, Schulz I, Schmid A. Agonist-evoked mitochondrial Ca2+ signals in mouse pancreatic acinar cells. Journal of Biological Chemistry. 2000;275:38680–38686. doi: 10.1074/jbc.M005667200. [DOI] [PubMed] [Google Scholar]
- Hajnoczky G, Hager R, Thomas AP. Mitochondria suppress local feedback activation of inositol 1,4, 5- trisphosphate receptors by Ca2+ Journal of Biological Chemistry. 1999;274:14157–14162. doi: 10.1074/jbc.274.20.14157. [DOI] [PubMed] [Google Scholar]
- Hajnoczky G, Robb-Gaspers LD, Seitz MB, Thomas AP. Decoding of cytosolic calcium oscillations in the mitochondria. Cell. 1995;82:415–424. doi: 10.1016/0092-8674(95)90430-1. [DOI] [PubMed] [Google Scholar]
- Hamill OP, Marty A, Neher E, Sakmann B, Sigworth FJ. Improved patch-clamp techniques for high-resolution current recording from cells and cell-free membrane patches. Pflügers Archiv. 1981;391:85–100. doi: 10.1007/BF00656997. [DOI] [PubMed] [Google Scholar]
- Ichas F, Jouaville LS, Mazat JP. Mitochondria are excitable organelles capable of generating and conveying electrical and calcium signals. Cell. 1997;89:1145–1153. doi: 10.1016/s0092-8674(00)80301-3. [DOI] [PubMed] [Google Scholar]
- Isenberg G, Han S, Schiefer A, Wendt-Gallitelli MF. Changes in mitochondrial calcium concentration during the cardiac contraction cycle. Cardiovascular Research. 1993;27:1800–1809. doi: 10.1093/cvr/27.10.1800. [DOI] [PubMed] [Google Scholar]
- Ito K, Miyashita Y, Kasai H. Micromolar and submicromolar Ca2+ spikes regulating distinct cellular functions in pancreatic acinar cells. EMBO Journal. 1997;16:242–251. doi: 10.1093/emboj/16.2.242. [DOI] [PMC free article] [PubMed] [Google Scholar]
- Jouaville LS, Pinton P, Bastianutto C, Rutter GA, Rizzuto R. Regulation of mitochondrial ATP synthesis by calcium: evidence for a long-term metabolic priming. Proceedings of the National Academy of Sciences of the USA. 1999;96:13807–13812. doi: 10.1073/pnas.96.24.13807. [DOI] [PMC free article] [PubMed] [Google Scholar]
- Kasai H, Li YX, Miyashita Y. Subcellular distribution of Ca2+ release channels underlying Ca2+ waves and oscillations in exocrine pancreas. Cell. 1993;74:669–677. doi: 10.1016/0092-8674(93)90514-q. [DOI] [PubMed] [Google Scholar]
- Kidd JF, Thorn P. Intracellular Ca2+ and Cl− channel activation in secretory cells. Annual Review of Physiology. 2000;62:493–513. doi: 10.1146/annurev.physiol.62.1.493. [DOI] [PubMed] [Google Scholar]
- Kidd JF, Thorn P. The properties of the secretagogue-evoked chloride current in mouse pancreatic acinar cells. Pflügers Archiv. 2001;441:489–497. doi: 10.1007/s004240000451. [DOI] [PubMed] [Google Scholar]
- Lawrie AM, Rizzuto R, Pozzan T, Simpson AW. A role for calcium influx in the regulation of mitochondrial calcium in endothelial cells. Journal of Biological Chemistry. 1996;271:10753–10759. doi: 10.1074/jbc.271.18.10753. [DOI] [PubMed] [Google Scholar]
- McCormack JG, Halestrap AP, Denton RM. Role of calcium ions in regulation of mammalian intramitochondrial metabolism. Physiological Reviews. 1990;70:391–425. doi: 10.1152/physrev.1990.70.2.391. [DOI] [PubMed] [Google Scholar]
- Mojet MH, Jacobson JD, Keelan J, Vergun O, Duchen MR. Monitoring mitochondrial functions in single cells. In: Tepikin A, editor. Calcium Signalling. A Practical Approach. Oxford: Oxford University Press; 2000. pp. 79–110. [Google Scholar]
- Montero M, Alonso MT, Carnicero E, Cuchillo-Ibanez I, Albillos A, Garcia AG, Garcia-Sancho J, Alvarez J. Chromaffin-cell stimulation triggers fast millimolar mitochondrial Ca2+ transients that modulate secretion. Nature Cell Biology. 2000;2:57–61. doi: 10.1038/35000001. [DOI] [PubMed] [Google Scholar]
- Osipchuk YV, Wakui M, Yule DI, Gallacher DV, Petersen OH. Cytoplasmic Ca2+ oscillations evoked by receptor stimulation, G-protein activation, internal application of inositol trisphosphate or Ca2+: simultaneous microfluorimetry and Ca2+ dependent Cl− current recording in single pancreatic acinar cells. EMBO Journal. 1990;9:697–704. doi: 10.1002/j.1460-2075.1990.tb08162.x. [DOI] [PMC free article] [PubMed] [Google Scholar]
- Park MK, Ashby MC, Erdemli G, Petersen OH, Tepikin AV. Perinuclear, perigranular and sub-plasmalemmal mitochondria have distinct functions in the regulation of cellular calcium transport. EMBO Journal. 2001;20:1863–1874. doi: 10.1093/emboj/20.8.1863. [DOI] [PMC free article] [PubMed] [Google Scholar]
- Petersen CC, Toescu EC, Petersen OH. Different patterns of receptor-activated cytoplasmic Ca2+ oscillations in single pancreatic acinar cells: dependence on receptor type, agonist concentration and intracellular Ca2+ buffering. EMBO Journal. 1991;10:527–533. doi: 10.1002/j.1460-2075.1991.tb07979.x. [DOI] [PMC free article] [PubMed] [Google Scholar]
- Petersen OH. Stimulus-secretion coupling: cytoplasmic calcium signals and the control of ion channels in exocrine acinar cells. Journal of Physiology. 1992;448:1–51. doi: 10.1113/jphysiol.1992.sp019028. [DOI] [PMC free article] [PubMed] [Google Scholar]
- Pivovarova NB, Hongpaisan J, Andrews SB, Friel DD. Depolarization-induced mitochondrial Ca accumulation in sympathetic neurons: spatial and temporal characteristics. Journal of Neuroscience. 1999;19:6372–6384. doi: 10.1523/JNEUROSCI.19-15-06372.1999. [DOI] [PMC free article] [PubMed] [Google Scholar]
- Raraty M, Ward J, Erdemli G, Vaillant C, Neoptolemos JP, Sutton R, Petersen OH. Calcium-dependent enzyme activation and vacuole formation in the apical granular region of pancreatic acinar cells. Proceedings of the National Academy of Sciences of the USA. 2000;97:13126–13131. doi: 10.1073/pnas.97.24.13126. [DOI] [PMC free article] [PubMed] [Google Scholar]
- Rizzuto R, Bernardi P, Pozzan T. Mitochondria as all-round players of the calcium game. Journal of Physiology. 2000;529:37–47. doi: 10.1111/j.1469-7793.2000.00037.x. [DOI] [PMC free article] [PubMed] [Google Scholar]
- Rizzuto R, Brini M, Murgia M, Pozzan T. Microdomains with high Ca2+ close to IP3-sensitive channels that are sensed by neighboring mitochondria. Science. 1993;262:744–747. doi: 10.1126/science.8235595. [DOI] [PubMed] [Google Scholar]
- Rizzuto R, Brini M, Pozzan T. Targeting recombinant aequorin to specific intracellular organelles. Methods in Cell Biology. 1994;40:339–358. doi: 10.1016/s0091-679x(08)61121-8. [DOI] [PubMed] [Google Scholar]
- Rizzuto R, Pinton P, Carrington W, Fay FS, Fogarty KE, Lifshitz LM, Tuft RA, Pozzan T. Close contacts with the endoplasmic reticulum as determinants of mitochondrial Ca2+ responses. Science. 1998;280:1763–1766. doi: 10.1126/science.280.5370.1763. [DOI] [PubMed] [Google Scholar]
- Rizzuto R, Simpson AW, Brini M, Pozzan T. Rapid changes of mitochondrial Ca2+ revealed by specifically targeted recombinant aequorin. Nature. 1992;358:325–327. doi: 10.1038/358325a0. [DOI] [PubMed] [Google Scholar]
- Robb-Gaspers LD, Burnett P, Rutter GA, Denton RM, Rizzuto R, Thomas AP. Integrating cytosolic calcium signals into mitochondrial metabolic responses. EMBO Journal. 1998;17:4987–5000. doi: 10.1093/emboj/17.17.4987. [DOI] [PMC free article] [PubMed] [Google Scholar]
- Rutter GA, Burnett P, Rizzuto R, Brini M, Murgia M, Pozzan T, Tavare JM, Denton RM. Subcellular imaging of intramitochondrial Ca2+ with recombinant targeted aequorin: significance for the regulation of pyruvate dehydrogenase activity. Proceedings of the National Academy of Sciences of the USA. 1996;93:5489–5494. doi: 10.1073/pnas.93.11.5489. [DOI] [PMC free article] [PubMed] [Google Scholar]
- Rutter GA, Rizzuto R. Regulation of mitochondrial metabolism by ER Ca2+ release: an intimate connection. Trends in Biochemical Sciences. 2000;25:215–221. doi: 10.1016/s0968-0004(00)01585-1. [DOI] [PubMed] [Google Scholar]
- Straub SV, Giovannucci DR, Yule DI. Calcium wave propagation in pancreatic acinar cells: functional interaction of inositol 1,4,5-trisphosphate receptors, ryanodine receptors, and mitochondria. Journal of General Physiology. 2000;116:547–560. doi: 10.1085/jgp.116.4.547. [DOI] [PMC free article] [PubMed] [Google Scholar]
- Szabadkai G, Pitter JG, Spat A. Cytoplasmic Ca2+ at low submicromolar concentration stimulates mitochondrial metabolism in rat luteal cells. Pflügers Archiv. 2001;441:678–685. doi: 10.1007/s004240000466. [DOI] [PubMed] [Google Scholar]
- Szalai G, Csordas G, Hantash BM, Thomas AP, Hajnoczky G. Calcium signal transmission between ryanodine receptors and mitochondria. Journal of Biological Chemistry. 2000;275:15305–15313. doi: 10.1074/jbc.275.20.15305. [DOI] [PubMed] [Google Scholar]
- Szalai G, Krishnamurthy R, Hajnoczky G. Apoptosis driven by IP3-linked mitochondrial calcium signals. EMBO Journal. 1999;18:6349–6361. doi: 10.1093/emboj/18.22.6349. [DOI] [PMC free article] [PubMed] [Google Scholar]
- Tepikin AV, Voronina SG, Gallacher DV, Petersen OH. Pulsatile Ca2+ extrusion from single pancreatic acinar cells during receptor-activated cytosolic Ca2+ spiking. Journal of Biological Chemistry. 1992;267:14073–14076. [PubMed] [Google Scholar]
- Territo PR, Mootha VK, French SA, Balaban RS. Ca2+ activation of heart mitochondrial oxidative phosphorylation: role of the F(0)/F(1)-ATPase. American Journal of Physiology - Cell Physiology. 2000;278:C423–435. doi: 10.1152/ajpcell.2000.278.2.C423. [DOI] [PubMed] [Google Scholar]
- Thorn P, Lawrie AM, Smith PM, Gallacher DV, Petersen OH. Local and global cytosolic Ca2+ oscillations in exocrine cells evoked by agonists and inositol trisphosphate. Cell. 1993;74:661–668. doi: 10.1016/0092-8674(93)90513-p. [DOI] [PubMed] [Google Scholar]
- Tinel H, Cancela JM, Mogami H, Gerasimenko JV, Gerasimenko OV, Tepikin AV, Petersen OH. Active mitochondria surrounding the pancreatic acinar granule region prevent spreading of inositol trisphosphate-evoked local cytosolic Ca2+ signals. EMBO Journal. 1999;18:4999–5008. doi: 10.1093/emboj/18.18.4999. [DOI] [PMC free article] [PubMed] [Google Scholar]
- Williams JA, Groblewski GE, Ohnishi H, Yule DI. Stimulus-secretion coupling of pancreatic digestive enzyme secretion. Digestion. 1997;58:42–45. doi: 10.1159/000201524. [DOI] [PubMed] [Google Scholar]
- Yule DI, Lawrie AM, Gallacher DV. Acetylcholine and cholecystokinin induce different patterns of oscillating calcium signals in pancreatic acinar cells. Cell Calcium. 1991;12:145–151. doi: 10.1016/0143-4160(91)90016-8. [DOI] [PubMed] [Google Scholar]