Abstract
The modulatory effects of dopamine (DA) on the visual responses of relay cells of the dorsal aspect of cat lateral geniculate nucleus (dLGN) were tested using local micro-iontophoretic application of DA and application of the receptor-specific agonists SKF38393 (SKF, D1/D5) and quinpirole (QUIN, D2/D3/D4) in the anaesthetized alcuronium-treated cat. The effects of DA and QUIN were clearly dose-dependent: small amounts caused a weak and transient facilitation of visual activity (10–30 % increase) preferentially in Y-type relay cells, which changed to a moderate reduction of visual responses when the dose was increased (50 %, maximal 70 %). The effect of SKF was mainly suppressive and increased with the amount of drug applied (up to 90 % reduction). The selective antagonists SCH23390 (SCH, D1) and sulpiride (SULP, D2) reduced the effects of co-applied DA agonists. We found little evidence for a specific dopaminergic modulation of the surround inhibition (stimulus-driven lateral inhibition) although DA slightly facilitated the transmission of weak signals (small stimuli). Nevertheless, some dopaminergic effects seem to be mediated via inhibitory interneurons regulating the strength of sustained or recurrent inhibition. Application of DA agonists during blockade of GABAA receptors indicates a direct suppression of relay cells via D1 receptors, an excitation of relay cells via D2 receptors and - with increasing amounts of D2 agonist - probably also an excitation of inhibitory interneurons, which results in an indirect inhibition of dLGN relay cells (predominantly of the X-type). The results are discussed in relation to the impairment of visual functions in Parkinson's disease.
Transmission of visual information through the lateral geniculate nucleus, the major sub-cortical relay station for retinal signals, is under the control of several different [modulatory] systems (for review see Sillito & Murphy, 1988; Sherman & Guillery, 1996). Besides inhibitory interactions with local interneurons (feedforward and feedback inhibition) and neurons of the perigeniculate nucleus (PGN, only feedback inhibition), these include excitatory feedback input from the primary visual cortices and diffuse inputs from the ascending reticular arousal system (ARAS) of the brain stem. The latter originates in the locus coeruleus, nucleus raphe dorsalis and several regions of the mesopontine reticular formation and includes noradrenergic, serotonergic and cholinergic/ nitrergic subsystems (De Lima & Singer, 1987; Fitzpatrick et al. 1989). Further candidates for the modulation of thalamocortical relay of visual information are histaminergic (Uhlrich et al. 1993) and dopaminergic systems (Papadopoulos & Parnavelas, 1990). The projections of the central dopaminergic system are biased to brain areas concerned with motor execution and planning including working memory and the limbic system. Accordingly, most studies are focused on these systems and little is known about the role of dopamine in the control of primary sensory paths. The role of dopamine in visual processing came into play when clinical studies concerned with Parkinsonism reported impaired visual functions in patients suffering from this disease (see Bodis-Wollner, 1990). The visual system is equipped with a separate dopaminergic system which modifies lateral interactions within the retina during the course of light/dark adaptation (Weiler et al. 2000). Deficits in this system may be associated with impairments of the central dopamine metabolism and are a likely explanation for the visual deficits of Parkinsonian patients (Harnois & Di Paolo, 1990). However, it cannot be excluded that dopaminergic modulation of visual processing takes place also at the following stations of the visual pathway, the next being the dorsal aspect of the lateral geniculate nucleus (dLGN). The dopaminergic innervation of the thalamus seems to be very sparse and expression of dopamine receptors within the dLGN is close to the limit of detection in many species (Camps et al. 1990; Papadopoulos & Parnavelas, 1990; Khan et al. 1998; Mijnster et al. 1999). Even less is known about the physiological action of dopamine on visual processing in the dLGN and, to our knowledge, only one electrophysiological study using micro-iontophoretic application of dopaminergic agents has been performed in rats (Albrecht et al. 1996), and one using systemic or intra-vitreous application of apomorphine has been done in rabbits (Boumghar et al. 1997). Unpublished results from our immunohistochemical investigations demonstrate the presence of dopamine receptors of the D1 and D2 (or D2/D3) type in cat dLGN. To investigate the possible functional significance of these systems in the transmission of visual signals through cat dLGN, we recorded single units in the anaesthetized alcuronium-treated animal during simultaneous micro-iontophoretic application of dopamine and specific agonists (SKF38393, D1; quinpirole, D2) and antagonists (SCH 23390, D1; sulpiride, D2). Additional, less numerous, subtypes of dopamine receptors (D3, D4, D5 or D1B) have been reported to exist in different brain regions (Civelli et al. 1993), but seem to be variants of the two main receptor types D1 (D5) and D2 (D3, D4). Therefore, we only refer to D1 and D2 mechanisms in this study (as done by Albrecht et al. 1996). The contribution of inhibitory interneurons was tested by blocking GABAA receptor-mediated inhibition with bicuculline methiodide. Our results indicate that DA controls the visual activity in cat dLGN in multiple ways: (i) through a direct inhibition of X- and Y-type relay cells via D1 receptors, (ii) by a direct facilitation of relay cell activity via D2 receptors and (iii) through an indirect inhibition of X-type relay cells due to excitation of inhibitory interneurons via D2 receptors. Using light spots of different size to stimulate different fractions of the receptive field centre and inhibitory surround of dLGN relay cells we found that facilitation and inhibition of visual responses due to DA agonists were largely proportional to response strength, indicating that there was no specific modulation of lateral (surround) inhibition but a more likely effect on local feedforward and recurrent inhibition. In addition, Y-cell responses to small stimuli were more likely to be facilitated than responses to larger stimuli.
METHODS
All experimental procedures followed the guidelines of the German animal welfare laws, were evaluated by the local ethics committee, permitted by the government and conformed with the principles of UK animal legislation.
Anaesthesia and general procedures
Extracellular single-unit recordings of dLGN and PGN cells were obtained from 12 adult cats of either sex (body weight 3.2–5.3 kg). The surgical procedures to prepare artificial respiration, arterial infusion and EEG recording and to enable vertical access to the visual thalamus were carried out under deep initial anaesthesia with ketamine hydrochloride (20–25 mg kg−1, i.m.; Ketanest, Parke-Davies, Germany) and xylazine (1–2 mg kg−1, i.m.; Rompun, Bayer, Germany). Two small holes were drilled into the skull to allow epidural EEG registration (silver ball electrode, area 17, left hemisphere) and lowering glass micropipettes to the dorsal lateral geniculate nucleus (dLGN) on the right hemisphere. The head was fixed in a stereotaxic frame, using blunt ear bars to avoid irritation of the tympanic membrane. Anaesthesia was continued by artificial respiration with N2O/O2 (70 : 30) and halothane (Fluothane, ICI-Pharma, Germany) during the recording sessions. The anaesthetic level was generally increased to 1.5–2.5 % halothane during manipulations such as handling the contact lenses or performing a new electrode penetration through the dura mater. During the recording sessions the level of anaesthesia was lowered to 0.6–1.0 % halothane to reduce intoxication of the liver during the long-lasting experiments (4–9 days). Animals were under 24 h supervision, blood pressure, heart rate and the EEG were continuously monitored, and the level of anaesthesia was increased (halothane 1.0–2.0 %) when increases in blood pressure, heart rate or when a loss of EEG delta waves might signal any lightening of anaesthesia. All incisions and pressure points were treated with the local anaesthetic Xylocaine (2 %; Astra Chemicals, Germany). To our knowledge, these procedures are sufficient to keep the animal free of any pain.
To maintain the physiological state of the animal, the end-expiratory CO2 was kept almost constant at about 3.8 %, the body temperature was held at 38.5 °C and infections were prevented by application of the broad-band antibiotics Chassot (0.5 ml i.m.; Chassot GmbH, Germany; genericum of Tardomyocel) and Isoptomax (Alcon Pharma, Germany; topically applied to the cornea). Recordings were performed as long as the mean arterial blood pressure was above 90 mmHg. A drop in blood pressure below that level close to the end of the experiment could partly be prevented by increasing the vascular volume with Ringer solution. Neuromuscular blockade was established and maintained by infusing alcuronium chloride (0.15 mg kg−1 h−1; Alloferin 10, Hoffmann-La Roche, Germany) in 1 % glucose-Ringer solution through the femoral artery. The corneae were protected with zero power contact lenses and the optics were corrected with spectacle lenses of 7–9 D for a viewing distance of 28 cm. Atropine sulphate (1 %; Atropin-Pos, Ursapharm, Germany) and phenylephrine hydrochloride (5 %; Neosynephrin-Pos, Ursapharm, Germany) were applied topically for mydriasis and retraction of the nictitating membranes.
At the end of each experiment, the animal was killed by administration of an overdose of anaesthetic (5% halothane plus 50 mg kg−1 Ketanest).
Recordings and visual stimulation
Single-unit action potentials were extracellularly recorded through one barrel of a five-barrelled glass micropipette. This barrel was filled with 3 mNaCl and had an inner tip diameter of 1–3 μm. After conventional electronic amplification, action potentials were separated from noise and converted to −5 V pulses using a window discriminator including an initial non-linear step of amplification to increase the signal-to-noise ratio. The Spike2 software (Cambridge Electronic Design, UK) was used to record spike times from a laboratory interface (Model 1401 plus, Cambridge Electronic Design) with a temporal resolution of 125 μs. With the same system we also recorded the analogue EEG signal (amplification ×10 000–20 000, band-passed between 0.1 and 100 Hz) which was digitized at a sampling rate of 250 Hz and periods corresponding to sequences of single-unit recordings were stored on hard disk. The spectral composition of the EEG was determined using a sliding time-window fast Fourier transform (Li et al. 1999). The EEG was analysed to distinguish between state-dependent and drug-induced changes in visual responsiveness (see Li et al. 1999; Funke & Eysel, 2000).
Flashing spots of different diameter (0.3–3 deg) were generated by a PC-based visual stimulator (Leonardo, Lohmann Research Equipment, Germany) and presented at a refresh rate of 100 Hz and a spatial resolution of 1024 pixels × 768 pixels on a 21 inch PC monitor (Iiyama Vision Master 500) placed 0.28 m in front of the cat's eyes. Stimuli were presented with about 70 % contrast to background ([Lspot - Lback]/[Lspot + Lback], where L represents luminance) with a screen background illumination of 0.5 cd m−2. Background room illumination was about 0.1 cd m−2. Series of six different spot diameters but fixed contrast (70 %) were used to stimulate different aspects of the centre or centre and surround of the receptive field. Spot diameters were chosen to yield maximal X-cell responses with stimulus size 3 at a given eccentricity, e.g. stimuli were 0.4, 0.75, 1.1, 1.45, 1.8 and 2.15 deg at an eccentricity of 5–10 deg. The same stimuli were used for Y-cells recorded at the same eccentricity to stimulate different fractions of their receptive field centre. Embedded in a leading episode of 400 ms and a following episode of 800 ms the spot was switched on for 800 ms, resulting in a complete sweep length of 2000 ms. X- and Y-type dLGN relay cells were distinguished by standard criteria, like receptive field size, spatial resolution, strength of the inhibitory surround and response to quickly moved objects adequate in contrast to stimulate the inhibitory surround (see Eysel et al. 1979). Stimuli were presented in an interleaved fashion to reduce the effect of changes in the internal state of the visual system (see below).
Drug application
Five-barrelled glass micropipettes (single-barrel tip diameter 2–3 μm, DC resistance 10–35 MΩ) were used to apply the dopaminergic drugs via micro-iontophoresis (Neurophore-2-system, Medical Systems Corp., USA) to the vicinity of the recorded cell. One barrel was always filled with dopamine hydrochloride (0.01 m, Sigma), while the others included different combinations of (±)-SKF38393 (0.05 m, partial D1 agonists, Research Biochemicals International (RBI)), (-)-quinpirole hydrochloride (0.05 m, LY171555, D2 agonist, RBI), SCH23390 (0.05 m, D1 antagonist, RBI) and (±)-sulpiride (0.05 m, D2 antagonist, RBI). All drugs were dissolved in 0.1 % ascorbic acid to prevent oxygenation and adjusted to pH 4.0 to eject the molecules as cations. Bicuculline methiodide (5 mm in 165 mmNaCl, pH 3.0, Sigma) was applied to block GABA receptors of the A-type. All drugs were applied with DC of positive polarity and with currents ranging from +10 to +50 nA. Unwanted leakage of drugs from the electrode tip was prevented by retaining currents of negative polarity ranging from 10 to 15 nA. Currents up to 50 nA rarely caused a direct excitation or inhibition of neuronal electric activity so that there was no need to use an additional channel for balancing the applied currents. In case of a direct electrical stimulation of the cell (immediate effect vs. delayed drug effects) the electrode was moved further away from the cell. Barrels used for current balance may lead to unspecific drug effects due to collection and re-ejection of drugs applied through the other barrels.
Experimental protocol
Each block of drug analysis was started with a control measurement during which the six different spot stimuli were presented in an interleaved fashion to reduce effects caused by changes in the state of the animal (see below). The same sequence was then repeated during continuous application of a drug at constant ejection current. Following a recovery to control levels - during which, in some cases, another record took place - the same drug was applied at a changed ejection current or a different drug was applied in the same way. Series of drug applications with different ejection currents (i.e. 10, 20, 30, 40 and 50 nA) were always performed in incremental order, starting with the lowest ejection current to prevent accumulation of the drug in the tissue and to thereby reduce the necessary recovery time. In the case of combined applications of DA agonists and DA antagonist or bicuculline methiodide, application of the antagonist (or bicuculline methiodide) was started and continued for about 1 min prior to application of the agonist. Averaged visual responses (peri-stimulus-time histograms, PSTHs) were obtained from 25 to 50 repetitions of the same stimulus. Thus, one complete record including the presentation of six different spot sizes lasted for 5–10 min. Peak response levels after onset of the stimulus (transient response) and mean activity levels during the sustained stimulus (tonic response) were analysed separately.
RESULTS
The modulatory effects of dopamine (DA) were studied in 69 dLGN relay cells, those of the D1 receptor agonist SKF38393 (SKF) in 30 cells and those of the D2 receptor agonist quinpirole (QUIN) in 21 cells, in part in combination with the GABAA receptor antagonist bicuculline methiodide (BICU). The antagonists SCH23390 (SCH, D1) and sulpiride (SULP, D2) were tested in 19 and 21 dLGN relay cells, respectively. Since we could use only four barrels of the micropipette for drug application, we could not test all substances in the same cell but used different combinations of the drugs in different experiments. The strength and the temporal pattern of geniculate visual responses strongly varied with changes in the internal state of the animal (if it was more or less sleepy) and were strictly correlated to the power of the EEG delta band (Sawai et al. 1988; Funke & Eysel, 1992, 2000; Li et al. 1999). These effects were often stronger than the effects induced by drug application and impeded the quantification of the results. Therefore, we compared only those records which were obtained under a similar spectral composition of the EEG. We analysed only those records made during a moderate power in the delta band and with higher bands (alpha to gamma) also present. Recordings during strong delta activity and strongly reduced higher frequencies were omitted because they are accompanied by a strong reduction of tonic visual activity and burst-like activity patterns. Nevertheless, some fluctuations of response strength and spectral composition of the EEG are always present (Li et al. 1999). Complete recording sessions including control measurements, drug applications with different ejection currents and interleaved recoveries, all tested for different stimulus features, lasted for several hours and could be accompanied by spontaneous changes in the EEG pattern that followed the natural sleep-wake cycle of the cat (Lancel, 1993). Discarding those records with too dissimilar EEG patterns considerably further reduced the sample of usable data. Even after this procedure we found the effects of DA to be very variable at first glance; DA could either facilitate or reduce visual activity to different degrees. As will be seen in the following discussion, this is related to a dose-dependent superposition of several mechanisms.
The dose-dependent effect of dopamine
The effect of dopamine on the strength of geniculate visual responses strictly depended on the amount of DA applied via different ejection currents. In most cases DA caused a moderate reduction of visual responses when applied with ejection currents of 20 nA or more. The action of DA developed slowly and generally took 5–10 min to recover. Quite frequently, this reduction was preceded by a transient episode of facilitation of activity. Reducing the ejection current to values around 10 nA resulted in a stronger and longer lasting facilitation which slightly faded to the end of the record. Figure 1A shows example responses of an X-off type relay cell before, during and after application of DA with different ejection currents. The PSTHs were calculated by averaging 50 responses elicited by identical stimuli.
Figure 1. Single-unit responses to visual stimulation and application of dopaminergic agents.
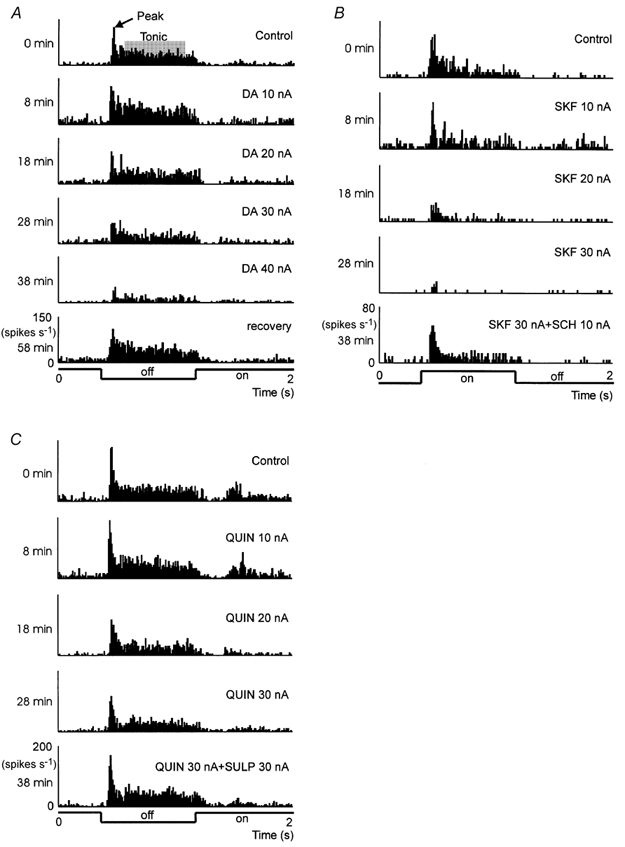
A, dopamine (DA) application with different ejection currents (nA) shows slight facilitation with 10 nA and inhibition with 20–40 nA. B, dose-dependent inhibition of visual responses was seen with the D1 agonist SKF; partial compensation of the inhibitory effect was observed during co-application of the D1 antagonist SCH. C, facilitation (10 nA) and inhibition (20–30 nA) of visual activity caused by the D2 receptor agonist QUIN; inhibition was eliminated during co-application of the D2 antagonist SULP. An X-off cell is shown in A, an X-on cell in B and an X-off cell in C. Peri-stimulus-time histograms were calculated from 50 repetitions of the same stimulus (stimulus protocol below the histograms). Time labels to the left of the histograms indicate the onset time of each record relative to the onset of the control record.
Series of light spots of six different diameters were used to test whether dopaminergic mechanisms may change the sensitivity of the receptive field centre or the strength of the receptive field surround. At a given eccentricity, the same spot diameters were used for X- and Y-cells. In X-cells the smallest spot covered a fraction of the excitatory receptive field centre while the largest exceeded the centre and stimulated large parts of the inhibitory surround. In Y-cells, the smallest spot stimulated a small fraction of the receptive field centre while the largest completely covered and slightly exceeded the area of the excitatory receptive field centre. Thus, this series of small light spots was suited to study the strength of lateral inhibition in X-cells and the sensitivity of the receptive fields of Y-cells to small stimuli. Figure 2 shows that the mean strength of the transient response (peak, see also Fig. 1A) continuously increased for Y-cells (Fig. 2A, upper diagram) while it had a maximum around stimulus size 3 for X-cells (Fig. 2B, upper diagram). The tonic response of X-cells also peaked at stimulus size 3 (Fig. 2B, lower diagram) while it approached a maximum at size 5 or 6 in Y-cells (Fig. 2A, lower diagram). Often, DA could induce a moderate facilitation of the visual response when applied with ejection currents of 20 nA or less. The continuous application of DA often caused an initial facilitation of visual activity, which was then followed by a reduction that reduced the average response level below control levels. This initial excitation was strong and long enough to yield significantly elevated response levels in Y-cells, predominantly for the tonic response. In X-cells, however, the transient facilitation was quickly overcome by suppression and thus no facilitation was evident for the averaged response levels during DA application with 10 or 20 nA (Fig. 2B). The larger error bars are an indication of the variability of the responses when DA was applied in small amounts (20 nA, mixed excitation and suppression). Larger amounts of DA (30–40 nA) reduced the visual activity from the very beginning of DA application. To preserve the stimulus size-dependent variation in activity levels, the bar histograms show mean absolute activity levels and were not normalized to control levels. Using the absolute means resulted in larger standard errors than using normalized values because of the strongly varying control levels of individual neurons.
Figure 2. Dose-dependent DA effect on the peak and tonic responses of Y- and X-cells to spot stimuli of different sizes.
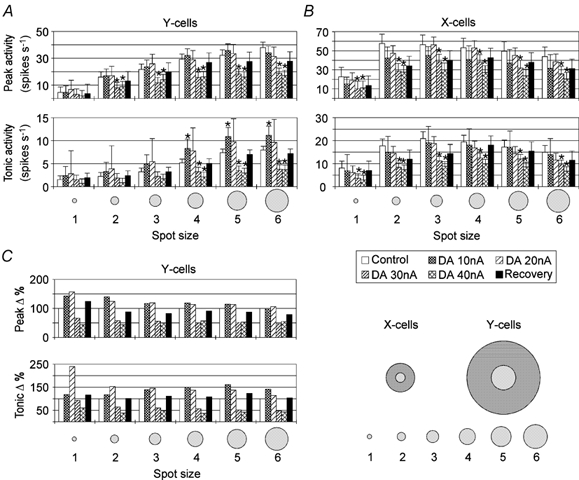
The bar histograms in A and B show mean (absolute) response levels and standard errors of the mean during control records, records with 10, 20, 30 and 40 nA dopamine (DA) application and recoveries. * Significantly different from control responses (P < 0.05, Student's paired t test, six Y-cells, six X-cells). The histograms in C show changes in Y-cell responses relative to control levels (percentage). Spot sizes (1–6) were chosen relative to receptive field size (see inset lower right and text).
Facilitation and reduction of activity by DA largely scaled with the absolute level of activity during the control records: the higher the response level before drug application, the larger the facilitation or suppression of activity during drug application, causing the slope of the response vs. size relationship to increase during facilitation and to decrease during suppression (more details below). An exception are Y-cell responses to the smallest stimuli, which showed a relatively (percentage) stronger increase when DA was applied in small quantities (10–20 nA). The relative decrease of activity during DA application with 30 nA was slightly smaller for the small spots while it was about the same for all spot diameters when DA was applied with 40 nA and may represent a saturation of the DA effect (Fig. 2C). Considering that the maximal response level of X-cells was not shifted to another spot size, one can conclude that DA had no specific effect on the strength of the surround (lateral) inhibition but did have an effect on the total impact of inhibition, e.g. tonic or feedforward and recurrent inhibition.
Actions of the D1 and D2 agonists
Application of the D1 receptor agonist SKF never caused a significant facilitation of visual activity but did cause a stronger reduction than DA when applied with ejection currents exceeding 20 nA (see Fig. 3). In addition, Fig. 1B demonstrates that the inhibitory effect of SKF could be partially compensated by co-application of the D1 receptor antagonist SCH. The inhibitory effect of SKF was of similar strength in X- and Y-cells and depended on spot size and absolute response strength. Thus, the relative reduction of visual activity was almost the same for responses to different spot sizes, except for some cases where SKF applied with 40 nA totally blocked the visual activity (Fig. 3 and Fig. 5).
Figure 3. Dose-dependent effect of the D1 receptor agonist SKF on the peak and tonic responses of Y- and X-cells to spot stimuli of different sizes.
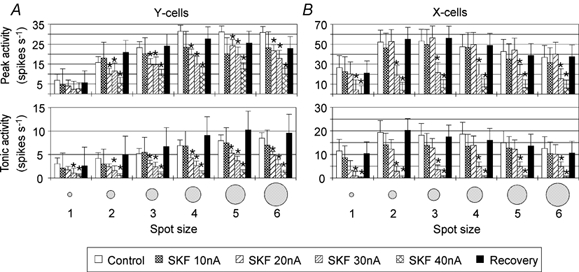
The bar histograms in A and B show mean (absolute) response levels and standard errors of the mean during control records, records with 10, 20, 30 and 40 nA SKF application and recoveries. The data are averaged from four Y-cells and five X-cells; otherwise the same conventions are used as in Fig. 2.
Figure 5. Drug-induced changes in response levels are largely proportional to absolute control response levels.
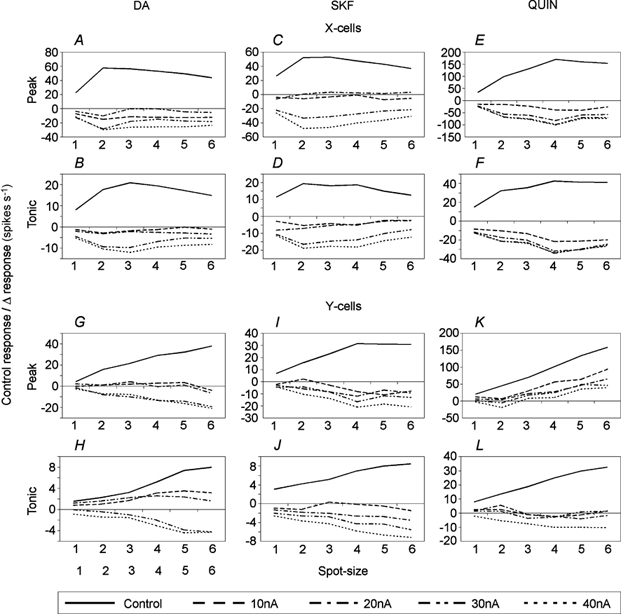
Relationship between control response levels to different spot sizes and the effects of DA, SKF and QUIN on visual responses of Y- and X-cells (DA: six Y, six X; SKF: four Y, five X; QUIN: seven Y, five X). Mean response levels during control records are plotted in absolute terms while response levels obtained during drug application are plotted as differences from control responses (drug record level minus control record level). Data were derived from the histograms shown in Figs 2–4. Error bars were omitted for clarity.
The effect of the D2 receptor agonist quinpirole was similar to that of dopamine in some respects. It caused a moderate facilitation of visual activity when applied with low ejection currents but a reduction when ejection current was raised. This suppressive effect could be compensated by co-application of the D2 receptor antagonist sulpiride (SULP, Fig. 1C). Again, excitation was more pronounced in Y-cells. The initial transient was in most cases facilitated, with the strongest effect when quinpirole was applied in small amounts. In the case of the tonic response, the facilitation was weaker and restricted to small ejection currents (10–20 nA) and small stimuli. Larger amounts of quinpirole caused a suppression of activity comparable to that caused by DA (Fig. 4A). Diminution of activity by QUIN dominated for the averaged activity of X-cells and increased with increasing amount of QUIN. The suppressive action was more pronounced for the tonic visual activity (Fig. 4B). The different effects of QUIN on transient and tonic response components may be related to the involvement of inhibitory processes driven by the visual activity (e.g. recurrent inhibition). The transient response is less affected than the tonic response because it is too early (especially in the case of Y-cells) to be considerably affected by recurrent inhibition. The possible contribution of interneurons to inhibition induced by the dopaminergic agents was studied by blocking GABAA-mediated inhibition with bicuculline methiodide (BICU) during application of dopaminergic agonists, as described below.
Figure 4. Dose-dependent effect of the D2 receptor agonist QUIN on the peak and tonic responses of Y- and X-cells to spot stimuli of different sizes.
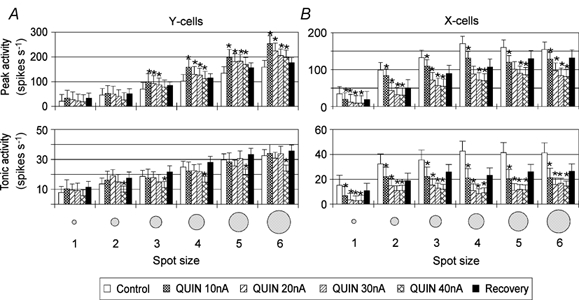
The bar histograms in A and B show mean (absolute) response levels and standard errors of the mean during control records, records with 10, 20, 30 and 40 nA QUIN application and recoveries. Averaged data from seven Y-cells and five X-cells. Otherwise same conventions as in Fig. 2.
Figure 5 summarizes the effects of DA, SKF and QUIN on visual responses to spots of different diameter. The control response levels are plotted in absolute terms while the response levels during drug applications are shown as deviations (differences in firing rate) from control levels. This way it is easy to see that facilitation and reduction of responses was almost proportional to the absolute firing rate of the controls with a few exceptions: Y-cell responses to small stimuli (sizes 2 and 3) were less reduced and slightly more facilitated by small amounts of agonist (10–20 nA) than responses to larger stimuli (see Fig. 5I, J and L). The proportional relation between control firing levels and changes induced by the agonists has at least two meanings: dopaminergic drugs change the slope of the response vs. stimulus size function and, for example, cause responses to large stimuli to be reduced more in absolute terms than responses to small stimuli. This, however, does not mean that surround (lateral) inhibition has been specifically strengthened. A proportional change in feedforward or feedback (recurrent) inhibition driven by visual activity is a more likely explanation.
Contribution of local inhibitory interneurons
To clarify whether the reduction of visual activity found when DA, SKF or QUIN are applied with ejection currents exceeding 10 nA is attributable to the excitation of neighbouring inhibitory interneurons, we applied the GABAA receptor antagonist BICU before and during application of a dopaminergic agonist. The sequences of drug application were basically the same as in a previous study in which we tested the excitation of inhibitory interneurons by serotonin (Funke & Eysel, 1995). After a control measurement, BICU was applied first to obtain a reference response level with blocked GABAA inhibition (release of tonic and visually induced inhibition). Following a short recovery to control response levels, BICU was applied with the same ejection current as before, and additional application of the dopaminergic agonist was started about 30 s later. This was followed by another recovery and an application of the dopaminergic agonist alone. The sequence was finished with a final recovery measurement. For an example of a single-unit response, see Fig. 6A. The pure BICU application was performed prior to application of the DA agonist because recovery from BICU action is much faster (< 1 min) than recovery from the action of DA agonists (10–15 min). DA and the other agonists were applied with 20–30 nA, an amount that was found to cause a moderate inhibition of visual activity, and possibly a superposition of facilitatory and suppressive actions. BICU was applied with 2–30 nA. Higher levels were avoided to prevent unspecific effects, in part because the combined application of BICU and DA agents would otherwise sum up to ejection currents higher than 60 nA and may cause direct current effects. The disinhibitory effect of BICU increased with spot size: an indication of the waxing contribution of surround (and recurrent) inhibition. The response level during pure BICU application was taken as a further reference for the dopaminergic effects. A direct comparison of pure DA agonist applications with combined applications is not sufficient because we have to assume a tonic level of inhibition which exists without additional dopaminergic actions.
Figure 6. Effect of DA on X- and Y-cells with and without blockade of GABAA inhibition by co-application of bicuculline methiodide (BICU).
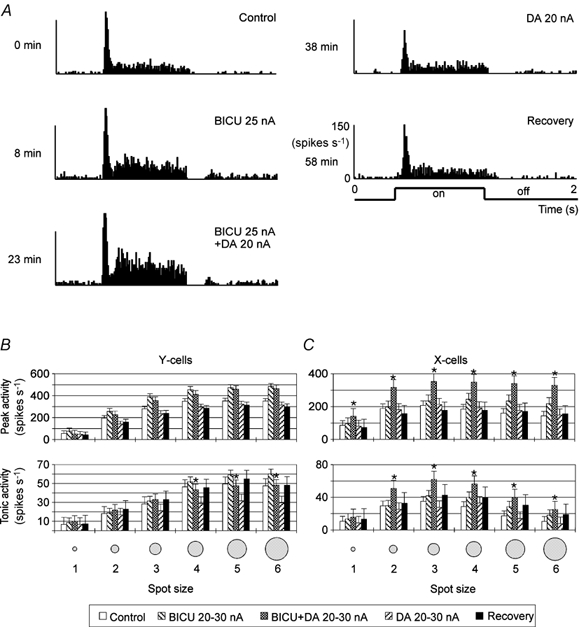
A shows an example of a single-unit response (X-on cell). Peri-stimulus-time histograms were calculated from 50 repetitions of the same stimulus (bright spot of size 3). Time labels to the left of the histograms indicate the onset time of each record relative to the onset of the control record. The bar diagrams (B and C) summarize the results obtained from 13 X-cells and 15 Y-cells. Asterisks label response levels during co-application of BICU and DA which are statistically significantly different from those during sole BICU application (P < 0.05, Student's t test). The contribution of [backround] inhibition was tested with sole BICU application.
In the case of combined applications of BICU and DA (see bar diagrams of Fig. 6B and C) we found the DA-mediated reduction of activity incompletely blocked for the Y-cells. The peak and tonic responses during combined applications were slightly smaller than those during sole BICU application. In addition, the difference between DA and DA-BICU combination was about the same as that between control and BICU, indicating that only DA-independent GABA-mediated inhibition had been blocked. By contrast, in X-cells both response components were clearly facilitated more strongly by a combined application than by a pure BICU application. The difference between sole BICU application and control values was much smaller than the difference between the values during pure DA and combined application, indicating that the combined application had not only abolished the background inhibition but also the DA-induced inhibition. Additionally, one can conclude that blockade of GABAA inhibition by BICU may have also unmasked some direct facilitation by DA because the activity level during combined applications (BICU + DA) is significantly higher than that during sole BICU application. The sole DA application had little effect and we can assume that in this case both actions interfere with and compensate each other. We can thus conclude that a contribution of interneurons to DA-induced inhibition of visual activity is more likely in X- than in Y-cells.
A combined SKF and BICU application revealed a slightly different result (see Fig. 7). In almost all cases the responses during combined application were significantly smaller than during a sole BICU application. In most cases, the difference between sole SKF application and combined application was quantitatively the same as the difference between control and BICU measurements, indicating that the response increase during combined applications results from a release of [background inhibition] but not from a blockade of SKF-induced GABAergic inhibition. Only for the tonic activity of Y-cells was the release of SKF-induced inhibition by additional BICU application somewhat stronger than the release of background inhibition, and this might involve non-linear mechanisms (see Discussion).
Figure 7. Effect of SKF on X- and Y-cells with and without blockade of GABAA inhibition by co-application of BICU.
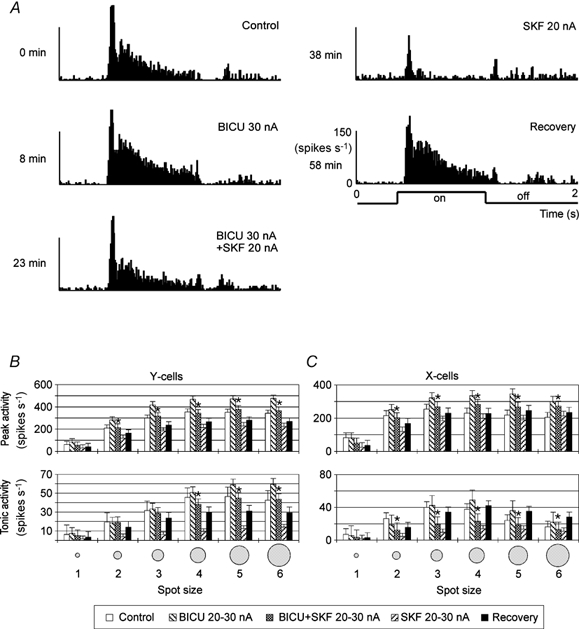
Single-unit example in A (X-on cell, bright spot size 4), averaged data of 12 Y-cells and five X-cells in B and C. Otherwise, the same conventions are used as in Fig. 6.
The results obtained with co-application of QUIN and BICU are qualitatively comparable to those achieved with co-application of BICU and DA except that we found no additional excitation in X-cells during combined applications of BICU and QUIN. The response levels of Y-cells during combined applications were either close to that of a sole BICU application (peak) or were clearly smaller (tonic, see Fig. 8). The difference between the mean responses to QUIN and combined application was generally smaller than the difference between responses during sole BICU application and those of the controls. At first sight the result seems to be similar in X-cells. With a few exceptions (peak responses to large spots) the response levels during combined applications are smaller than those during sole BICU application. However, the absolute differences between the responses obtained during combined and sole QUIN application are considerable larger than the differences between controls and sole BICU applications. Thus, the net release of inhibition is clearly stronger in X-cells than in Y-cells. There is no indication of an inhibitory effect of QUIN on Y-cells: the net effect of QUIN applied with 20–30 nA is excitatory when compared with control response levels and there is only release of background inhibition with BICU. The situation is different in X-cells: QUIN application with 20–30 nA had a much stronger inhibitory effect than DA. It is thus possible that blockade of GABAA inhibition was incomplete, allowing part of the QUIN-induced inhibition to pass. It is generally difficult to achieve a complete blockade of GABAA receptor-mediated inhibition without inducing abnormal response patterns (bursts, epileptiform activity patterns), which we tried to prevent.
Figure 8. Effect of QUIN on X- and Y-cells with and without blockade of GABAA inhibition by co-application of BICU.
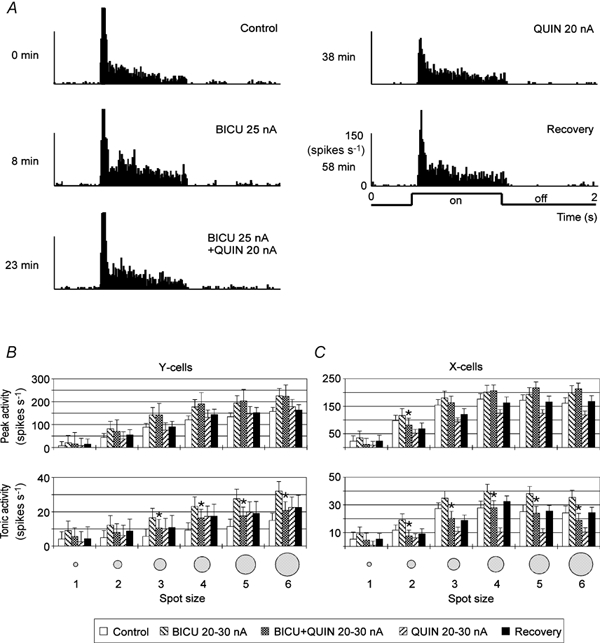
Single-unit example in A (X-on cell, bright spot size 3), averaged data of five Y-cells and seven X-cells in B and C. Otherwise, the same conventions are used as in Fig. 6.
Action of D1 and D2 antagonists
The DA receptor antagonist were applied to test the specificity of the agonist effects. Figure 9A shows the results of 18 measurements using the drugs specific for the D1 receptor. The suppression of visual activity caused by SKF application could be almost totally blocked in the case of peak activity and significantly reduced for the tonic part of the visual response (Fig. 9A). The effect of the D2 antagonist SULP was tested with the D2 agonist QUIN applied with two different ejection currents because small amounts of QUIN (10 nA) slightly enhanced visual activity while larger amounts (30 nA) reduced it (see Fig. 9B). A slight facilitation of visual activity in this sample (54 measurements) was visible only for the peak response and could be reduced to control levels with SULP application. Also, the reduction of peak and tonic visual activity caused by 30 nA QUIN could be substantially reduced with co-application of SULP.
Figure 9. Efficiency of the DA receptor antagonists SCH (D1) and SULP (D2) in blocking the action of the receptor agonists SKF and QUIN.
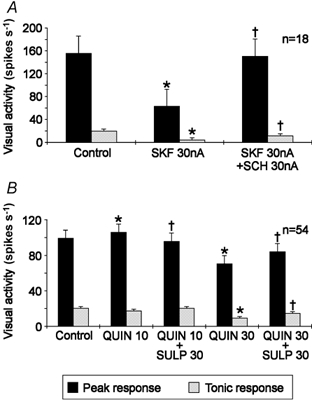
QUIN was tested with two different ejection currents (10 and 30 nA) because of opposite effects on response levels. *Mean response levels statistically different from control levels (P < 0.05, Student's t test). † Mean response level statistically different (P < 0.05) from that during sole agonist application. Responses obtained from X- and Y-cells evoked by different spot sizes were pooled in this case.
DISCUSSION
Interpretation of results
Our results demonstrate that the dopaminergic system can control retino-geniculate transmission of visual signals in the cat by acting on D1 and D2 receptors. These processes seem to be not restricted to a direct action on relay cells but may also involve the activity of local inhibitory interneurons. We also found differences in the strengths and kinds of DA effects on the two different types of relay cells that can be found in the dorsal layers (A, A1) of cat dLGN. Y-cells show a somewhat stronger facilitation of activity when DA or QUIN is applied in small amounts and are less strongly inhibited when the amount of DA agonist is increased. The dopaminergic actions on visual activity in X- and Y-cells can be explained in the following way, and are illustrated in Fig. 10. Both cell types possess D1 receptors and activation of these receptors by DA or SKF results in a reduction of activity. Both cell types also possess D2 receptors through which DA can have a mild excitatory effect. Whether the action of DA or QUIN is excitatory or inhibitory was, in our experiments, dependent on the amount of drug applied. The occasionally observed excitation at small drug amounts can be explained by a direct D2 receptor-mediated effect at the relay cells. During iontophoresis of the drugs, a sufficient number of molecules will also diffuse to neighbouring interneurons if the drug is applied in larger quantities. Excitation of the GABAergic interneurons then leads to increasing inhibition of the relay cells. It can be expected that the natural release of DA leads to a more selective modulation of either relay cells or interneurons so that facilitatory effects may be quantitatively stronger than found in our experiments.
Figure 10. Summary of dopaminergic input systems to cat dLGN.
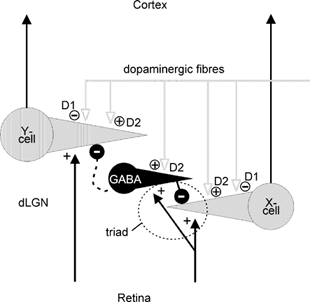
Sketch of the simplified circuitry of cat dLGN and the possible cells and receptor types targeted by the dopaminergic innervation. For explanation see Discussion.
The strengthened inhibition induced by DA might be sustained but will be more efficient if added to visually driven activity of interneurons. A comparison of visual responses obtained during combined applications of a DA agonist and the GABAA receptor antagonist BICU with control responses, or responses during sole applications of BICU or the DA agonist, allows us to decide whether interneurons contribute to the inhibition caused by application of the DA agonist. From these results we can conclude that interneurons excited by DA clearly contribute to the inhibition of X-type relay cells via GABAA receptors, but are less involved in the case of Y-cells. BICU increased the initial and sustained part of visual responses by blocking those inhibitory interactions already present without DA application. Assuming that BICU blocks both visually induced and additional DA-induced inhibition by interneurons, then the magnitude of visual responses during co-application of BICU and DA agonist should be about the same as that obtained during sole BICU application. This level was not completely reached in Y-cells for the initial response and was much lower for the tonic response, indicating that part of the remaining inhibition was not caused by interneurons. The degree of disinhibition of the transient response during combined application seems to reflect the release of background inhibition seen during sole BICU application. Disinhibition of X-cell responses during combined applications often exceeds the level observed during a sole BICU application, indicating a strong contribution of interneurons to DA-induced inhibition. The release from this inhibition then also unmasks a direct excitation of X-cells via D2 receptors. In cases of strong inhibition (QUIN applications) it was not always possible to block this inhibition completely but the net effect of disinhibition by BICU was then larger than the release of background inhibition.
A stronger inhibition of X-cells by release of DA is concomitant with anatomical findings demonstrating the circuitry within the cat dLGN. X-cells receive numerous inhibitory inputs from local interneurons via F2-type dendro-dendritic synapses, which are arranged with retinal inputs in a triad-like fashion (see Guillery, 1971), and which are thought to mediate fast feedforward inhibition relatively independent from the activity present at the soma of the interneuron (Sherman & Koch, 1986). The close vicinity of these autonomic inhibitory sites to the afferent input could also explain the weaker facilitation of X-cells by small amounts of DA compared with Y-cells: there is no need for diffusion of the drug to the more distantly located parts of the interneuron to enhance the release of GABA. If DA receptors are located close to the F2 terminal (and brainstem terminals are located there, Cucchiaro et al. 1988), facilitatory and inhibitory actions would be strengthened almost at the same time. Y-cells miss these types of inhibitory synapses and may receive inhibitory inputs via axonal conduction and in a recurrent way. In this case, global activation of the interneuron is needed to cause inhibition of the Y-cell. To further test this hypothesis, we plotted the tonic activity levels of X- and Y-cells versus the time of continuous QUIN application with small ejection currents (10–20 nA). The activity of the five X-cells shown in Fig. 11 generally declined during continuous QUIN application, with two of them showing an early facilitation of activity. Three of the five Y-cells showed a mild increase over time and two a weak decrease (one with an early excitation). All Y-cells ended up with a higher activity level than the X-cells. Thus, spread of QUIN during continuous application might reach more and more presynaptic inhibitory dendrites (triads) in the case of X-cells and increasingly more parts of the large dendritic tree of Y-cells, thereby facilitating the retinal inputs.
Figure 11. Response dynamics of X- and Y-cells during continuous QUIN application.
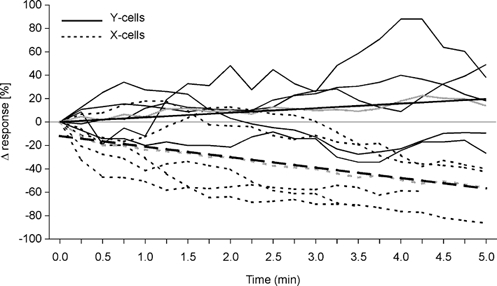
The mean tonic activity of five X- and five Y-cells is plotted over time after onset of QUIN application with 10–20 nA. The curves were slightly smoothed by calculating sliding means from three successive responses. The responses were normalized to the mean of the three first response levels, which were set to 0 on the graph. Continuous lines show Y-cell activity, dashed lines that for the X-cells. The grey lines show overall means for X- and Y-cells. Regression lines have also been added.
Specificity of the bicuculline effect
A recent in vitro study by Debarbieux et al. (1998) demonstrated that bicuculline methiodide not only blocks GABAA-type receptors but also blocks calcium-activated potassium channels in thalamic and cortical neurons. The reduction of this potassium current underlying the low-threshold spike burst afterhyperpolarization (AHP) leads to a prolongation of the low-threshold calcium spike (LTS) and the overlying burst of sodium action potentials. It is thus reasonable to ask, whether the effects obtained in our study with BICU application may be partly related to the blockade of calcium- sensitive potassium channels. Although we cannot totally rule out such an effect, we believe that it is small compared with the blockade of GABAergic inhibition for the following reasons. (1) From our long-term experience in using micro-iontophoretic application of bicuculline methiodide in vivo, we know that increasing the amount of BICU applied above a certain limit (usually around 30–35 nA at 5 mm BICU) increases burst firing in thalamic and cortical neurons, an effect corresponding to the findings of Debarbieux and co-workers (1998). Therefore, we strictly avoided eliciting such activity patterns by keeping the amount of BICU below this level. (2) Our recordings were done during a less synchronized EEG state during which spontaneous burst firing was minimal. Accordingly, the occurrence of LTS should be small, and thus also the involvement of a calcium-dependent potassium current that could be affected by BICU. (3) The disinhibition by BICU in our study was clearly related to the stimulus size used to elicit visual responses, which is a sign for reduced thalamic surround inhibition. An effect of BICU on the calcium-dependent potassium current can hardly explain this effect. (4) The disinhibitory effect of BICU was clearly different during the co-application of D1 or D2 agonists and (5) also different for the D2 effect on X- and Y-type relay cells. Also, the latter phenomena are more likely to be related to the blockade of GABAA-type inhibition than to modulation of the potassium current. Nevertheless, a tonic effect on potassium currents may impare the quantification of BICU effects on GABAA receptor-mediated inhibition in general.
Comparison with other studies
Until recently, only a few studies have investigated the actions of DA on visual processing in the dLGN (Albrecht et al. 1996; Boumghar et al. 1997) and all report a dominant inhibitory effect of DA on spontaneous and visually induced activity. Boumghar et al. applied apomorphine either by intra-vitreous or by intravenous injection to stimulate DA release in the rabbit. Since they did not find significant differences related to the site of injection, they concluded that the changes seen in rabbit dLGN are primarily related to dopaminergic modulation of retinal processes. Using micro-iontophoresis to apply DA or specific agonists directly to the dLGN we and Albrecht et al. (1996) have shown that dopaminergic control of the processing of visual information also takes place in the thalamus. Our study in cat is largely comparable to the study performed in rats by Albrecht et al. and demonstrates that differences between carnivores and rodents may be relatively small. Qualitatively, the findings are the same: activation of D1 receptors preferentially dampens rat dLGN relay cells obviously without the contribution of inhibitory interneurons, and stimulation of D2 receptors can induce both facilitation and reduction of visual activity, with the reduction probably mediated by inhibitory interneurons. However, the relay cells of cat and rat dLGN are not directly comparable. The receptive fields of rat dLGN relay cells are generally much larger than those of the cat. The [fast] cells of the rat dLGN may correspond to cat Y-cells and these were less frequently inhibited by DA. A stronger DA-mediated inhibition was found in the [slow] cells of rat dLGN, which are similar to cat W-cells (Albrecht et al. 1996). In our study, the X-type relay cells were more likely inhibited by DA through a D2 receptor-mediated activation of inhibitory interneurons.
A comparison of our study with studies investigating the action of DA in other brain structures can only be done with some limitations. The sub-cellular effects of DA seem to be very complex and variable because activation of D1 or D2 receptors can initiate multiple intracellular signal cascades involving the control of diverse sodium, potassium and calcium channels (for review see Nicola et al. 2000). DA receptor subtypes can be expressed in the same or different cells and may directly interact depending on the degree of activation (Shen et al. 1992). The final outcome of dopaminergic modulation partly depends on the amount of DA released and can switch from excitation to reduction (as also observed by us) or vice versa when DA level increases. Our suggestion that the prevailing facilitation of visual responses by small amounts of DA or QUIN is related to direct D2 receptor activation, while the suppression of activity caused by larger DA amounts involves D1 receptor stimulation, is supported by the finding that D2 receptors exhibit a higher affinity for DA than D1 receptors (Creese et al. 1983). In addition, some modulatory effects of DA seem to be specific to certain kinds of synaptic processes. For example, glutamatergic currents controlled by N-methyl-d-aspartate (NMDA) receptors were found to be facilitated in human neocortex while currents induced by activation of non-NMDA receptors (quisqualate and AMPA type) were reduced (Cepeda et al. 1992). A subsequent study from the same group (Cepeda et al. 1998) further demonstrated that potentiation of NMDA currents in rat neostriatal cells is related to D1 receptor stimulation and based on an enhancement of a voltage-dependent calcium current. Inconsistent effects were observed after stimulation of D2 receptors, leading to potentiation or reduction of NMDA currents. Retino-geniculate transmission is also of the glutamatergic type and involves NMDA and non-NMDA receptors (Sillito et al. 1990a, b). It is thus conceivable that similar dopaminergic mechanisms also affect the geniculate transmission of retinal signals.
Relation to pathophysiology and behaviour
Degeneration or dysfunction of the dopaminergic system is often accompanied by impaired visual functions. Especially in patients suffering from Parkinson's or Huntington's disease, spatial contrast sensitivity and the ability to distinguish colours is diminished (see Bodis-Wollner, 1990; Buettner et al. 1996; Wink & Harris, 2000). The origin of these deficits is commonly believed to be located in the retina and goes along with a lowered DA level in the retina (Harnois & Di Paolo, 1990) and disturbances of the dopaminergic control of lateral interactions which change in the course of light/dark adaptation (Weiler et al. 2000). DA decreases the electrical coupling of horizontal cells by reducing the efficiency of gap junctions between them (Maguire & Hamasaki, 1994). This leads to a reduced receptive field size of horizontal cells (Yamada et al. 1992) accompanied by a weakened lateral inhibition (Maguire & Hamasaki, 1994), which results in an enhanced absolute contrast sensitivity to the debit of a weakened spatial contrast detection. Clinical studies reported a stronger impairment of achromatic contrast sensitivity compared with colour discrimination (Buettner et al. 1996, 2000). Others found little deficit in spatial contrast resolution but a more general reduction of dynamic contrast sensitivity, including the detection of weak motion signals (Skandries & Gottlob, 1986; Masson et al. 1993; Haug et al. 1994). The majority of these findings support the hypothesis of an inappropriate dark adaptation and changes in contrast gain with little effect on receptive field size of retinal ganglion cells (Wink & Harris, 2000). Others report a stronger loss of contrast sensitivity for high spatial frequencies (see Bodis-Wollner, 1990). It is not always possible to directly relate data obtained in an animal experiment to clinical findings. In our case it is not easy to decide whether physiological states are more related to the facilitation seen with small amounts of DA or to the inhibition found at larger DA quantities since we applied the dopaminergic agent locally. However, both processes may enhance visual performance: the facilitation of responses to small stimuli and the promotion of visually induced inhibitory interactions may both improve the contrast sensitivity to fine structures and thus are not contradictory to the clinical findings.
Acknowledgments
We are grateful for the critical comments of Dr Volgushev on drafts of the manuscript and acknowledge the technical assistance of V. Onasch, B. Bendmann and D. Winkler. This study was supported by a grant from the Deutsche Forschungsgemeinschaft to K.F. (SFB 509, TP A2, 1999-2001).
REFERENCES
- Albrecht D, Quaeschling U, Zippel U, Davidowa H. Effects of dopamine on neurons of the lateral geniculate nucleus: an iontophoretic study. Synapse. 1996;23:70–78. doi: 10.1002/(SICI)1098-2396(199606)23:2<70::AID-SYN2>3.0.CO;2-D. [DOI] [PubMed] [Google Scholar]
- Bodis-Wollner I. Visual deficits related to dopamine deficiency in experimental animals and Parkinson's disease patients. Trends in Neurosciences. 1990;13:296–302. doi: 10.1016/0166-2236(90)90113-o. [DOI] [PubMed] [Google Scholar]
- Boumghar L, Marois A, Jolicoeur FJ, Casanova C. Apomorphine modifies the visual responses of cells in the rabbit's lateral geniculate nucleus. Canadian Journal of Physiology and Pharmacology. 1997;75:853–858. [PubMed] [Google Scholar]
- Buettner T, Kuhn W, Mueller T, Heinze T, Puhl C, Przuntek H. Chromatic and achromatic visual evoked potentials in Parkinson's disease. Electroencephalography and Clinical Neurophysiology. 1996;100:443–447. [PubMed] [Google Scholar]
- Buettner T, Mueller T, Kuhn W. Effects of apomorphine on visual functions in Parkinson's disease. Journal of Neural Transmission. 2000;107:87–94. doi: 10.1007/s007020050007. [DOI] [PubMed] [Google Scholar]
- Camps M, Kelly PH, Palacios JM. Autoradiographic localization of dopamine D1 and D2 receptors in the brain of several mammalian species. Journal of Neural Transmission. 1990;80:105–127. doi: 10.1007/BF01257077. [DOI] [PubMed] [Google Scholar]
- Cepeda C, Colwell CS, Itri JN, Chandler SH, Levine MS. Dopaminergic modulation of NMDA-induced whole cell currents in neostriatal neurons in slices: contribution of calcium conductances. Journal of Neurophysiology. 1998;79:82–94. doi: 10.1152/jn.1998.79.1.82. [DOI] [PubMed] [Google Scholar]
- Cepeda C, Radisavljevic Z, Peacock W, Levine MS, Buchwald N. Differential modulation by dopamine of responses evoked by excitatory amino acids in human cortex. Synapse. 1992;11:330–341. doi: 10.1002/syn.890110408. [DOI] [PubMed] [Google Scholar]
- Civelli O, Bunzow JR, Grandy DK. Molecular diversity of the dopamine receptors. Annual Review of Pharmacology and Toxicology. 1993;33:281–307. doi: 10.1146/annurev.pa.33.040193.001433. [DOI] [PubMed] [Google Scholar]
- Creese I, Sibley DR, Hamblin MW, Leff SE. The classification of dopamine receptors: relationship to radioligand binding. Annual Review of Neuroscience. 1983;6:43–71. doi: 10.1146/annurev.ne.06.030183.000355. [DOI] [PubMed] [Google Scholar]
- Cucchiaro JB, Uhlrich DJ, Sherman SM. Parabrachial innervation of the cat's dorsal lateral geniculate nucleus: an electron microscopic study using the tracer Phaseolus vulgaris leucoagglutinin (PHA-L) Journal of Neuroscience. 1988;8:4576–4588. doi: 10.1523/JNEUROSCI.08-12-04576.1988. [DOI] [PMC free article] [PubMed] [Google Scholar]
- Debarbieux F, Brunton J, Charpak S. Effect of bicuculline on thalamic activity: a direct blockade of IAHP in reticularis neurons. Journal of Neurophysiology. 1998;79:2911–2918. doi: 10.1152/jn.1998.79.6.2911. [DOI] [PubMed] [Google Scholar]
- De Lima AD, Singer W. The brainstem projection to the lateral geniculate nucleus in the cat: identification of cholinergic and mono-aminergic elements. Journal of Comparative Neurology. 1987;259:92–121. doi: 10.1002/cne.902590107. [DOI] [PubMed] [Google Scholar]
- Eysel UT, Gruesser OJ, Hoffmann KP. Monocular deprivation and the signal transmission by X- and Y-neurons of the cat lateral geniculate nucleus. Experimental Brain Research. 1979;34:521–539. doi: 10.1007/BF00239147. [DOI] [PubMed] [Google Scholar]
- Fitzpatrick D, Diamond IT, Raczkowski D. Cholinergic and mono-aminergic innervation of the cat's thalamus: comparison of the lateral geniculate nucleus with other principal sensory nuclei. Journal of Comparative Neurology. 1989;288:647–675. doi: 10.1002/cne.902880411. [DOI] [PubMed] [Google Scholar]
- Funke K, Eysel UT. EEG-dependent modulation of response dynamics of cat dLGN relay cells and the contribution of corticogeniculate feedback. Brain Research. 1992;573:217–227. doi: 10.1016/0006-8993(92)90766-3. [DOI] [PubMed] [Google Scholar]
- Funke K, Eysel UT. Possible enhancement of GABAergic inputs to cat dorsal lateral geniculate relay cells by serotonin. NeuroReport. 1995;6:474–476. doi: 10.1097/00001756-199502000-00017. [DOI] [PubMed] [Google Scholar]
- Funke K, Eysel UT. Quantitative aspects of the state-dependent co-variation of cat lateral geniculate and perigeniculate visual activity. NeuroReport. 2000;11:1031–1037. doi: 10.1097/00001756-200004070-00027. [DOI] [PubMed] [Google Scholar]
- Guillery RW. Patterns of synaptic interconnections in the dorsal lateral geniculate nucleus of cat and monkey: a brief review. Vision Research. 1971;3:11–27. doi: 10.1016/0042-6989(71)90041-1. [DOI] [PubMed] [Google Scholar]
- Harnois C, Di Paolo T. Decreased dopamine in the retinas of patients with Parkinson's disease. Investigative Ophthalmology and Visual Science. 1990;31:2473–2475. [PubMed] [Google Scholar]
- Haug BA, Trenkwalder C, Arden GB, Oertel WH, Paulus W. Visual thresholds to low-contrast pattern displacement, colour contrast and luminance contrast stimuli in Parkinson's disease. Movement Disorders. 1994;9:563–570. doi: 10.1002/mds.870090510. [DOI] [PubMed] [Google Scholar]
- Khan ZU, Gutiérrez A, Marin R, Peñafiel A, Rivera A, De La Calle A. Differential regional and cellular distribution of dopamine D2-like receptors: an immunocytochemical study of subtype-specific antibodies in rat and human brain. Journal of Comparative Neurology. 1998;402:353–371. doi: 10.1002/(sici)1096-9861(19981221)402:3<353::aid-cne5>3.0.co;2-4. [DOI] [PubMed] [Google Scholar]
- Lancel M. Cortical and subcortical EEG in relation to sleep-wake behaviour in mammalian species. Neuropsychobiology. 1993;28:154–159. doi: 10.1159/000119017. [DOI] [PubMed] [Google Scholar]
- Li B, Funke K, Woergoetter F, Eysel UT. Correlated variations in EEG pattern and visual responsiveness of cat lateral geniculate relay cells. Journal of Physiology. 1999;514:857–874. doi: 10.1111/j.1469-7793.1999.857ad.x. [DOI] [PMC free article] [PubMed] [Google Scholar]
- Maguire G, Hamasaki DI. The retinal dopamine network alters the adaptational properties of retinal ganglion cells in the cat. Journal of Neurophysiology. 1994;72:730–741. doi: 10.1152/jn.1994.72.2.730. [DOI] [PubMed] [Google Scholar]
- Masson G, Mestre D, Blin O. Dopaminergic modulation of visual sensitivity in man. Fundamental Clinical Pharmacology. 1993;7:449–463. doi: 10.1111/j.1472-8206.1993.tb01041.x. [DOI] [PubMed] [Google Scholar]
- Mijnster MJ, Isovich E, Flügge G, Fuchs E. Localization of dopamine receptors in the tree shrew brain using [3H]-SCH23390 and [125I]-epidepride. Brain Research. 1999;841:101–113. doi: 10.1016/s0006-8993(99)01795-3. [DOI] [PubMed] [Google Scholar]
- Nicola SM, Surmeier DJ, Malenka RC. Dopaminergic modulation of neuronal excitability in the striatum and nucleus accumbens. Annual Review of Neuroscience. 2000;23:185–215. doi: 10.1146/annurev.neuro.23.1.185. [DOI] [PubMed] [Google Scholar]
- Papadopoulos GC, Parnavelas JG. Distribution and synaptic organization of dopaminergic axons in the lateral geniculate nucleus of the rat. Journal of Comparative Neurology. 1990;294:356–361. doi: 10.1002/cne.902940305. [DOI] [PubMed] [Google Scholar]
- Sawai H, Morigawa K, Fukuda Y. Effects of EEG synchronization on visual responses of cat's geniculate relay cells: a comparison among Y, X and W cells. Brain Research. 1988;455:394–400. doi: 10.1016/0006-8993(88)90102-3. [DOI] [PubMed] [Google Scholar]
- Shen RY, Asdourian D, Chiodo LA. Microiontophoretic studies of the effects of D-1 and D-2 receptor agonists on type 1 caudate nucleus neurons: lack of synergistic interaction. Synapse. 1992;11:319–329. doi: 10.1002/syn.890110407. [DOI] [PubMed] [Google Scholar]
- Sherman SM, Guillery RW. Functional organization of thalamocortical relays. Journal of Neurophysiology. 1996;76:1367–1395. doi: 10.1152/jn.1996.76.3.1367. [DOI] [PubMed] [Google Scholar]
- Sherman SM, Koch C. The control of retinogeniculate transmission in the mammalian lateral geniculate nucleus. Experimental Brain Research. 1986;63:1–20. doi: 10.1007/BF00235642. [DOI] [PubMed] [Google Scholar]
- Sillito AM, Murphy PC. The modulation of the retinal relay to the cortex in the dorsal lateral geniculate nucleus. Eye Supplemental. 1988;2:221–232. doi: 10.1038/eye.1988.146. [DOI] [PubMed] [Google Scholar]
- Sillito AM, Murphy PC, Salt TE. The contribution of the non-N-methyl-d-aspartate group of excitatory amino acid receptors to retinogeniculate transmission in the cat. Neuroscience. 1990a;34:273–280. doi: 10.1016/0306-4522(90)90137-s. [DOI] [PubMed] [Google Scholar]
- Sillito AM, Murphy PC, Salt TE, Moody CI. The dependence of retinogeniculate transmission in the cat on NMDA receptors. Journal of Neurophysiology. 1990b;63:347–355. doi: 10.1152/jn.1990.63.2.347. [DOI] [PubMed] [Google Scholar]
- Skandries W, Gottlob I. Alterations of visual contrast sensitivity in Parkinson's disease. Human Neurobiology. 1986;5:255–259. [PubMed] [Google Scholar]
- Uhlrich DJ, Manning KA, Peinkowski TP. The histaminergic innervation of the lateral geniculate complex in the cat. Visual Neuroscience. 1993;10:225–235. doi: 10.1017/s0952523800003631. [DOI] [PubMed] [Google Scholar]
- Weiler R, Pottek M, He S, Vaney DI. Modulation of coupling between retinal horizontal cells by retinoic acid and endogeneous dopamine. Brain Research Reviews. 2000;32:121–129. doi: 10.1016/s0165-0173(99)00071-5. [DOI] [PubMed] [Google Scholar]
- Wink B, Harris J. A model of the Parkinsonian visual system: support for the dark adaptation hypothesis. Vision Research. 2000;40:1937–1946. doi: 10.1016/s0042-6989(00)00036-5. [DOI] [PubMed] [Google Scholar]
- Yamada M, Shigematsu Y, Umetani Y, Saito T. Dopamine decreases receptive field size of rod-driven horizontal cells in carp retina. Vision Research. 1992;32:1801–1807. doi: 10.1016/0042-6989(92)90041-g. [DOI] [PubMed] [Google Scholar]


