

Abstract
Calcium-activated chloride currents (ICl(Ca)) have been recorded in various smooth muscle cells but, to date, there has been no information as to the molecular nature of the channel underlying this conductance. We have characterised native ICl(Ca) in freshly dispersed smooth muscle cells isolated from murine portal vein using whole-cell voltage clamp. ICl(Ca) exhibited time-dependent activation at depolarised potentials and rapid deactivation upon repolarisation. The reversal potential of ICl(Ca) was close to the theoretical equilibrium potential (ECl) and was shifted by replacement of external Cl− by SCN− or isethionate. Dithiothreitol (DTT, 1 mm), a blocker of CLCA1, had no effect on the ICl(Ca) current in myocytes. RT-PCR demonstrated the expression of mCLCA1 transcripts, but not mCLCA3 transcripts, in various murine smooth muscle cells including portal vein, as well as cardiomyocytes, and the levels of mCLCA1 transcriptional expression were quantified by real time quantitative RT-PCR. Stable transfection of HEK293 cells with the cDNA encoding mCLCA1 cloned from murine portal vein smooth muscle yielded a current with notable differences in Ca2+ sensitivity, channel kinetics and modulation by DTT from the native ICl(Ca). However, there was some similarity in the pore properties and these data suggest that mCLCA1 alone does not comprise the Cl− channel in portal vein smooth muscle cells.
Ca2+-activated Cl− currents (ICl(Ca)) are found in a variety of muscular (Wang et al. 1992; Pacaud et al. 1992; Hogg et al. 1993) and non-muscular cells (Evans & Marty, 1986). In smooth muscle, the equilibrium potential for chloride (ECl) is more positive than the resting membrane potential, thus the physiological consequences of the activation of ICl(Ca) in smooth muscle are membrane depolarisation and subsequent contraction in response to excitatory agents (Large & Wang, 1996). Several properties are common to Ca2+-activated Cl− currents in smooth muscle tissues, namely, time and voltage dependence, the level of [Ca2+]i required to activate the Cl− channel, and sensitivity to pharmacological blockers such as niflumic acid and stilbene derivatives (see Large & Wang (1996) for a detailed review).
Recent molecular studies have identified a novel family of genes encoding Ca2+-activated Cl− channels (Pauli et al. 2000). Cunningham et al. (1995) cloned the first gene for such channels from bovine trachea (bCLCA1), which conferred an ionomycin-stimulated Cl− conductance when transfected into COS-7 cells. This family of closely related genes has since been extended to include a second bovine isoform (bCLCA2; Elble et al. 1997), four human CLCA isoforms (hCLCA1-4; Gruber et al. 1998a, 1999; Gruber & Pauli, 1999; Agnel et al. 1999) and three murine isoforms (mCLCA1-3; Gandhi et al. 1998; Lee et al. 1999; Komiya et al. 1999). Several members of this CLCA family, including the murine isoform mCLCA1, have been functionally expressed in mammalian cells and have been shown to elicit outwardly rectifying membrane currents that are anion-selective. Transient expression of mCLCA1 in human embryonic kidney HEK293 cells (Gandhi et al. 1998) or Xenopus oocytes (Romio et al. 1999) was associated with an increase in whole-cell Cl− current that could be activated by Ca2+ and ionomycin. mCLCA1 was inhibited by 4,4′-diisothiocyanatostilbene-2,2′-disulphonic acid (DIDS), DTT and niflumic acid, similar to the channels bCLCA1, hCLCA1 and hCLCA2.
Although ICl(Ca) has been recorded in many smooth muscle cells there has been no information as to the molecular identity of the underlying channel. In this present study, we investigated by RT-PCR whether the putative molecular candidates, mCLCA1 and mCLCA3, were expressed in murine smooth muscle. Further to this, we cloned mCLCA1 cDNA from murine portal vein and expressed the channel in HEK293 cells. Whole-cell patch-clamp recordings were performed on murine portal vein smooth muscle cells and the functionally expressed mCLCA1. A number of differences in the biophysical properties of native ICl(Ca) and the Cl− current recorded from mCLCA1-transfected HEK293 cells were found, i.e. Ca2+ sensitivity, channel kinetics and modulation by DTT. However, there was some similarity in the pore properties of the expressed mCLCA1 channel and endogenous ICl(Ca), which suggests that mCLCA1 may represent a component of ICl(Ca) in portal vein smooth muscle cells.
METHODS
Dissection of smooth muscles and smooth muscle cell preparations
BALB/c mice (> 30 days old) were sedated by exposure to isoflurane (Baxter Laboratories, Deerfield, IL, USA) and killed by cervical dislocation. Our Institutional Animal Care and Use Committee have approved this protocol. Incisions were made along the abdomen. Individual portal veins were dissected out by ligation close to the liver with cotton thread and were bathed in nominally Ca2+-free PSS (composition below) whilst fat and connective tissue were removed. Strips of small intestine, proximal colon and the stomach were removed and placed into PSS solution. The mucosa and submucosa were removed by sharp dissection. Segments of pulmonary arteries were also isolated, cleaned by removal of bulk connective tissue and cut into small squares for digestion. Preparation of single smooth muscle cells was specific for each tissue, as follows. Thin strips of portal vein muscle were placed in PSS containing 50 μm Ca2+ for 10 min at 36 °C, then in 50 μm Ca2+ PSS containing 3 mg ml−1 collagenase (type IA), 2 mg ml−1 trypsin inhibitor, 2 mg ml−1 bovine serum albumin (BSA) and 0.1 mg ml−1 protease (type XIV) for 10 min at 36 °C. Strips of gastrointestinal (GI) circular smooth muscle tissue were incubated in Ca2+-free PSS containing 230 units of collagenase, 2 mg ml−1 BSA, 2 mg ml−1 trypsin inhibitor and 0.11 mg ml−1 ATP at 37 °C for 8–12 min. Pulmonary arteries were digested in PSS containing 2 mg ml−1 collagenase (type XI), 0.4 mg ml−1 elastase (type III) and 2 mg ml−1 BSA for 16–18 h at 4 °C.
Preparation of isolated cardiac muscle cells
The mouse chest cavity was opened and the heart was quickly excised and mounted on a Langendorff-type apparatus. The perfusate was switched from normal Tyrode solution to Ca2+-free Tyrode solution, and then to the same solution containing 0.04 % collagenase (Type IV). After 10–15 min of collagenase treatment, the atria and ventricle were excised and cut into small strips (0.5–1 mm wide). The strips were incubated in Ca2+-free Tyrode solution containing 0.1 % collagenase and 0.01 % elastase (type IIA) for 5–0 min.
Collection of isolated cells for RT-PCR analysis
Following each enzymatic procedure, isolated smooth muscle cells were liberated by passing the digested tissue through a wide-bore Pasteur pipette, and stored at 4 °C in 50 μm Ca2+-containing PSS. Each cell suspension was placed in a Petri dish and transferred to the stage of a phase-contrast microscope. Single cells were collected through applied suction by aspirating them into a wide-bore borosilicate pipette and the pipette contents were ejected into a sterile 0.5 ml tube. Their characteristic spindle-shaped morphology differentiated smooth muscle cells. Cardiac cells were identified by their oblong shape and clear cross striations. Approximately 60 muscle cells were collected, flash-frozen in liquid nitrogen, and stored at −80 °C until use.
Electrophysiology
Voltage-clamp experiments were performed on freshly dispersed smooth muscle cells isolated from the portal veins of adult BALB/c mice (> 30 days old). Membrane currents were recorded at room temperature in the whole-cell configuration using an Axopatch 200B amplifier. Voltage clamp protocols were generated and analysed using pCLAMP 8 software (Axon Instruments, Foster City, CA, USA). In all experiments, cells were held at −60 mV (Vh) and currents were evoked by pipette solutions containing Ca2+ buffered at 100 nm, 500 nm or 1 μm (composition of solution is given below). This technique has been used to activate ICl(Ca) in studies on smooth muscle (Greenwood et al. 2001), endothelial (Nilius et al. 1997) and parotid acinar cells (Arreola et al. 1996) and directly activates the Cl− channel at a clamped concentration of Ca2+. The current-voltage relationship of the activated current was determined by stepping the cell from Vh to potentials between −100 mV and +140 mV for 1.5 s. Current amplitudes were recorded immediately after the settling of the capacitative transient (termed ‘instantaneous’ current) and just prior to the end of the test pulse (termed ‘late’ current). The ionic nature of the charge carrier was determined from reversal potential values elicited by a two-pulse protocol. Cells were stepped initially from Vh to a depolarised potential (+70 mV or +100 mV depending on the size of current) to increase the channel open probability and then stepped to various test potentials between −100 mV and +60 mV. The reversal potential was calculated from the amplitude of the instantaneous current at the different test potentials. The Goldman-Hodgkin-Katz (GHK) equation was applied to the shift in reversal potential produced by replacement of the normal external solution for one containing either NaSCN or sodium isethionate instead of NaCl to determine the relative permeability of the more permeable anion SCN− and the less permeable anion isethionate (see Greenwood & Large (1999) for a fuller description). Changes in junction potential were minimised by the use of 300 mm KCl agar bridge. All data are reported as the mean of n cells ± s.e.m. All means include data from at least three different mice.
Solutions
The composition of the Ca2+-free PSS was (mm): NaCl (125), KCl (5.4), NaHCO3 (15.4), Na2HPO4 (0.33), KH2PO4 (0.34), glucose (10), sucrose (3), Hepes (11). Enzymes were dissolved in the above solution containing 50 μm CaCl2. Tyrode solution contained (mm): NaCl (140), KCl (5.4), NaH2PO4 (0.33), CaCl2 (1.8), MgCl2 (0.5), glucose (5.5) and Hepes (5), and pH was adjusted to 7.4 with NaOH. The external solution used to bathe the cells had the following composition (mm): NaCl (126), Hepes (10), glucose (20), CaCl2 (1.8), MgCl2 (1.2), TEA-Cl (10) and pH was set to 7.2 with 10 M NaOH. The pipette solution used to activate Cl− currents contained (mm): TEA-Cl (20), CsCl (106), Hepes (5), BAPTA (10), MgATP (3), GTP.diNa (0.2), MgCl2 (0.42), and pH was set to 7.2 by addition of CsOH. [Ca2+] was buffered by adding the appropriate amount of CaCl2 determined by the EQCAL buffer program (Biosoft, Ferguson, MO, USA). All enzymes and DTT were purchased from Sigma Chemical Company (St Louis, MO, USA).
Total RNA isolation and RT-PCR
Total RNA was isolated from murine tissue and enzymatically dispersed smooth muscle and cardiac cells using the SNAP total RNA isolation kit (Invitrogen, Carlsbad, CA, USA), following the manufacturers instructions, including the use of polyinosinic acid (20 μg) as an RNA carrier. First-strand cDNA was prepared from the RNA using the Superscript II reverse transcriptase kit (Life Technologies, Rockville, MD, USA); 1 μg of total RNA was reverse transcribed with 200 units reverse transcriptase in a 20 μl reaction containing 25 ng oligo dT(12–18) primer, 500 μm each dNTP, 50 mm Tris-HCl, pH 8.3, 75 mm KCl, 3 mm MgCl2 and 10 mm DTT. PCR was performed with gene-specific primers for mCLCA1, mCLCA3 and β-actin on 2 μl or 10 μl cDNA (tissue or isolated cells) using AmpliTaq Gold reagents (PE Applied Biosystems, Foster City, CA, USA). The following PCR primers were used: mCLCA1 (GenBank accession no. AF047838), forward 5′-AAGAAGTCCCACCATGGAAC-3′ (sense nt 1781–1800) and reverse 5′-AAATCCTTGGCTGACCCGT-3′ (antisense nt 1886–1868), amplicon 105 bp; mCLCA3 (GenBank accession no. NM017474), forward 5′-TGACCTCTTTCACCCTGTCA-3′ (sense nt 2258–2278) and reverse 5′-CGATACTGGTGCTCATTCGGA-3′ (antisense nt 2403–2383), amplicon 145 bp; β-actin (GenBank accession no. V01217), sense nt 2384–2402 and antisense nt 3071–3091, amplicon 498 bp. The amplification profile for these primer pairs were as follows: 95 °C for 10 min to activate the AmpliTaq polymerase, then 40 cycles of 95 °C for 15 s and 60 °C for 1 min, performed in a GeneAmp 2400 thermal cycler (PE Applied Biosystems). RT-PCR with β-actin primers controlled for genomic DNA contamination in the source RNA, since these primers were designed to span two exons and an intron. The no-template control (NTC), a PCR reaction in which no template was added, controlled for primer contamination and non-specific amplification. PCR products generated from each pair of primers were gel-extracted and sequenced to confirm the specificity of the primers.
Quantitative RT-PCR
Real-time quantitative PCR was performed with the use of SYBR Green chemistry on an ABI 5700 sequence detector (PE Applied Biosystems). The same mCLCA1 primers used for qualitative analysis on isolated cells were used for quantitative RT-PCR. Total RNA was prepared from vascular and GI tract smooth muscle as well as atria and ventricle. The RNA was prepared from tissue with mucosa removed from the GI tissues and the endothelium and bulk connective tissue removed from the vascular muscles. However, these preparations contain muscle cells and other minor cell types (e.g. interstitial cells of Cajal, macrophages, neurones and fibroblasts) that would contribute to the quantitative measurement. Standard curves were generated for mCLCA1 and the constitutively expressed β-actin from regression analysis of the mean values of RT-PCRs for the log10 diluted cDNA. Unknown quantities relative to the standard curve for the mCLCA1 primers were calculated, yielding transcriptional quantitation of mCLCA1 cDNA relative to the endogenous standard (β-actin). Each cDNA sample was tested in triplicate and cDNA was obtained for each tissue from at least three different animals. The reproducibility of the assay was tested by analysis of variance (ANOVA) comparing repeat runs of samples, and mean values generated at individual time points were compared by Student's t test. All statistical analyses were performed using GraphPad Prism version 3 (GraphPad Software, San Diego, CA, USA).
Cloning of mCLCA1 from murine portal vein smooth muscle
The gene for the mCLCA1 channel was cloned from murine portal vein tissue by PCR amplification with specific primers designed against the published sequence for mCLCA1 (GenBank accession no. AF047838; Gandhi et al. 1998). mCLCA1 was first amplified as two fragments which span the entire coding region and contained an overlapping region of 301 bp. These fragments were then used as the template in an overlap extension PCR reaction (Horton et al. 1990) to obtain the complete coding region of mCLCA1. PCR was performed as described above with AmpliTaq Gold reagents. The primer pair, F1 (sense nt 3–22) 5′-TGGAGCAGTGCGACCATGGT-3′ and R1 (antisense nt 803–785) 5′-GTAGGTTTGGGGCTTCTGCA-3′ amplified a 800 bp fragment under the PCR conditions of 95 °C for 10 min, then 30 cycles of 95 °C for 15 s and 60 °C for 1 min. The primer pair, F2 (sense nt 502–521) 5′-GGGGAGTATTTGATGAGTAT-3′ and R2 (antisense nt 2741–2722) 5′-GTGCCATTCTATCTTCTAGT-3′ amplified a 2239 bp fragment with the amplification profile of 95 °C for 10 min, then 30 cycles of 95 °C for 15 s, 48 °C for 30 s and 60 °C for 2 min. The 800 bp and 2239 bp fragments were gel purified and subjected to overlap PCR reaction using the primers F1 and R2, with a PCR profile of 95 °C for 10 min, then 30 cycles of 95 °C for 30 s, 50 °C for 30 s and 60 °C for 2 min. The 2.7 kb PCR amplification product containing the entire protein coding sequence for mCLCA1 was gel purified and sub-cloned into the pcDNA3.1 vector (Invitrogen). Following transformation into E. coli, recombinant plasmid DNA was purified on resin spin columns (Qiagen, Valentcia, CA, USA). The correct orientation for translation and the mCLCA1 cDNA sequence was confirmed by sequencing using the ABI Prism cycle sequencing kit (PE Applied Biosystems) and analysed on an ABI DNA Sequencer, Model 310 (PE Applied Biosystems). Sequences were compared and analysed with Vector NTI software (Infomax, Bethesda, CA, USA).
Heterologous expression of mCLCA1 in HEK293 cells
CLCA1 isolated from murine portal vein was stably transfected into HEK293 cells by the calcium phosphate co-precipitation method followed by geneticine (Life Technologies, Rockville, MD, USA) antibiotic selection (Ohya et al. 1997). Transfected and untransfected HEK293 cells were seeded on to shards of glass 24 h before recording. In initial experiments, currents were recorded with either zero Ca2+ or 500 nm Ca2+ in the pipette solution using the pipette solution containing 10 mm BAPTA described above. Subsequent experiments on transfected and untransfected cells were recorded using a pipette solution containing 2 mm Ca2+, as used in the studies by (Gandhi et al. 1998) and (Gruber et al. 1999). The composition of this pipette solution was (mm): NMDG-Cl (126), sucrose (30), Hepes (5), MgCl2 (2) and CaCl2 (2). In all experiments, the external solution was the same as described above but with 30 mm sucrose included to reduce any possible contamination from swelling-activated currents. Membrane currents were generated by the same voltage protocols used on the portal vein smooth muscle cells.
RESULTS
Native currents in murine portal vein myocytes
ICl(Ca) activated by pipette solutions containing Ca2+ fixed at 500 nm or 1 μm (see Methods) were elicited in the majority of murine portal vein myocytes (42 out of 61 cells, 15 animals). On achieving the whole-cell configuration with a pipette solution containing 500 nm Ca2+, the mean whole-cell current evoked at −60 mV (IH) was −20 ± 3 pA (n = 11). The level of current elicited at the holding potential did not exhibit any rundown and remained constant for the duration of the experiment. Application of depolarising steps revealed that the evoked current had distinct voltage-dependent characteristics similar to currents evoked by this technique in rabbit vascular myocytes (Greenwood et al. 2001). Figure 1Ai shows an example of a family of membrane currents elicited by voltage steps from −100 mV to +120 mV in a single murine myocyte (protocol shown in Fig. 1Aii). In this cell, dialysis with 500 nm Ca2+ evoked a current of 33 pA at −60 mV. Steps to depolarised potentials resulted in an instantaneous current that reflected the conductance at −60 mV and then a progressive increase in outward current that followed a mono-exponential time course with a time constant (τ) at +120 mV of 302 ms. Repolarisation to −60 mV elicited rapidly declining tail currents that also followed an exponential time course (τ following depolarisation to +120 mV was 71 ms). The mean τ values at +120 mV and at −60 mV following depolarisation to +120 mV were 415 ± 27 ms and 71 ± 5 ms, respectively (n = 11). Figure 1B shows that the evoked current was Ca2+ dependent. Pipette solutions containing 1 μm Ca2+ elicited a marked increase in holding current at −60 mV (mean = −57 ± 8 pA; n = 7) and this was associated with the appearance of large outward relaxations following depolarisation to potentials greater than +20 mV and concomitant tail currents upon repolarisation to −60 mV. Figure 1B shows that all currents evoked by 1 μm Ca2+ were significantly larger than those elicited by 500 nm Ca2+. For example the amplitude of the late current at +100 mV normalised for cell size was 17 ± 2.5 pA pF−1 and 28 ± 7 pA pF−1 when the pipette solution contained 500 nm and 1 μm Ca2+, respectively. In comparison, intracellular dialysis with 100 nm did not evoke a significant current at −60 mV and small, time-dependent currents were only observed at extremely depolarised potentials (>+80 mV). Moreover, in cells isolated from murine colon, pipette solutions containing 1 μm Ca2+ failed to elicit a Cl− current exhibiting similar kinetics to those recorded in the portal vein in 24 out of 25 experiments (five animals).
Figure 1. Characteristics of ICl(Ca) evoked in murine portal vein myocytes.
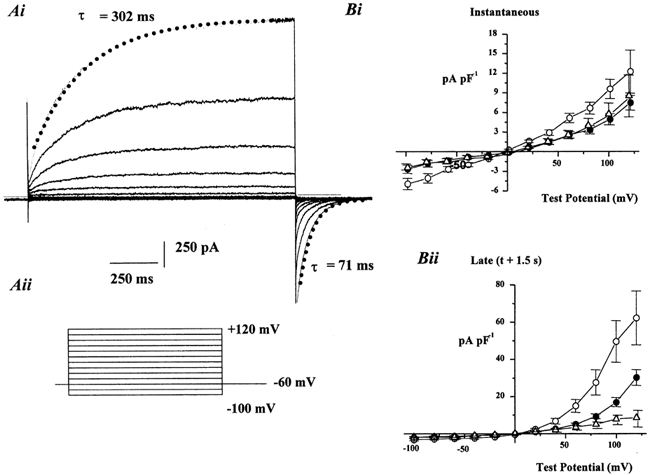
Ai, an example of a family of currents evoked by a pipette solution containing 500 nm Ca2+ at voltages between −100 mV and +120 mV (voltage protocol is shown in Aii). Superimposed lines show the exponential fit for the outward relaxation at +120 mV and the corresponding tail current recorded at −60 mV. The time constants (τ) for these fits are included. Dashed line represents the zero current level. Bi and Bii show the mean instantaneous and late current densities respectively evoked by 100 nm (▵), 500 nm (•) and 1 μm Ca2+ (○). Each point is the mean of between six and 10 cells with error bars representing s.e.m.
A double pulse protocol was utilised to determine the reversal potential (Vrev) of the activated current. Figure 2 shows a representative experiment where a single smooth muscle cell dialysed with a pipette solution containing 500 nm Ca2+ was stepped to an initial potential of +100 mV from Vh to increase the channel open probability and then stepped to various test potentials (Vt) between −100 mV and +60 mV (see inset of Fig. 2 for protocol). In normal Cl−-containing external solutions, the direction of the tail current reversed close to the theoretical Cl− equilibrium potential and the mean Vrev was +5 ± 1 mV (n = 9; see Fig. 2Ai for example). A similar reversal potential was recorded for currents evoked by 1 μm Ca2+ (mean Vrev = +3 ± 2 mV; n = 6). Replacement of the external solution for one containing NaSCN instead of NaCl caused a reduction in the holding current and a shift in Vrev to −44 ± 1.5 mV (n = 9) and −41 ± 3 mV for currents evoked by 500 nm and 1 μm Ca2+, respectively (Fig. 2Ai and 2B). Replacement of the external Cl− for the less permeable anion isethionate produced a depolarising shift in Vrev to +40 ± 2 mV (n = 5; an example is shown in Fig. 2Aii). The recorded shifts in Vrev when applied to the GHK equation gives a relative permeability (Px:PCl) of 5.8 ± 0.33 for SCN− and 0.16 ± 0.05 for isethionate. These values are identical to Px:PCl measurements for Ca2+-activated Cl− currents recorded in rabbit vascular myocytes (Greenwood & Large, 1999; Greenwood et al. 2001). Replacement of the external Cl− with SCN− also slowed the deactivation kinetics of the activated current consistent with previous reports in rabbit portal vein myocytes (Greenwood & Large, 1999). The mean time constant for the tail current at −80 mV was 66 ± 9 ms (n = 6) when the cell was bathed in an external solution containing NaCl and 126 ± 15 ms (n = 7) when the bathing solution contained NaSCN. These data show that murine portal vein myocytes exhibit a Ca2+-activated Cl− current that has characteristics identical to Ca2+-activated Cl− conductances in rabbit vascular smooth muscle cells.
Figure 2. Ionic nature of the current evoked in portal vein myocytes.

Ai and Aii show families of currents evoked in external solutions containing NaCl, NaSCN or sodium isethionate by 500 nm Ca2+ in the pipette solution. The inset shows the voltage protocol used to determine the voltage dependence of the activated current under different external anionic conditions. B, the mean tail current amplitude evoked by 1 μm Ca2+ at different test potentials in the presence of external NaCl (•); NaSCN (▴) and sodium isethionate (○).
Heterologous expression of CLCA isoforms has yielded a Ca2+-activated anion conductance that is rapidly inhibited by the reducing agent DTT (Cunningham et al. 1995; Gandhi et al. 1998; Gruber et al. 1998a, 1999). We performed experiments to see if reducing conditions inhibited the native Ca2+-activated Cl− current in murine portal vein cells. Figure 3A shows an ensemble of currents recorded at test potentials between −100 mV and +120 mV under control conditions and after 5 min application of 2 mm DTT. It can be seen that there is no depression of the current amplitude after exposure to DTT and the mean data from four such experiments is shown in Fig. 3B.
Figure 3. Lack of effect of the reducing agent DTT on ICl(Ca) in portal vein myocytes.

A, the amplitude of the instantaneous current (•) and late current (○) recorded at +70 mV in the absence and presence of 1 mm DTT. Insets show ensembles of currents recorded at potentials between −100 mV and +120 mV in the absence and presence of DTT. B, the mean normalised amplitude of the instantaneous and late currents after 5 min application of 1 mm DTT (n = 4).
Tissue expression of CLCA family members in smooth muscles
The expression of two members of the murine CLCA family (mCLCA1 and mCLCA3), were examined by performing RT-PCR on isolated muscle cells from several murine tissues. PCR products were generated using gene-specific primers for mCLCA1 and mCLCA3 that were designed to be non-homologous to other members of the CLCA family of genes. The mCLCA2 isoform; GenBank no. NM017474 (Komiya et al. 1999) is 97 % identical to mCLCA1 at the nucleotide level; therefore the mCLCA1 primers will not differentiate between these two isoforms. Total RNA was prepared from individually selected smooth muscle cells to avoid the contaminating effects of other cell types as reported previously (Epperson et al. 2000). A NTC reaction was included to control for primer contamination. In addition, RT-PCR with β-actin primers was performed on all isolated smooth muscle cell preparations as both a control for the integrity of the cDNA and as a control for genomic DNA contamination, since these primers were designed to span an intron as well as two exons. If DNA contamination was noted with either β-actin or in the NTC, these samples were discarded. Detectable amplicons for mCLCA1 (105 bp) were observed in all murine smooth muscle cell preparations (Fig. 4A). The β-actin amplicon (498 bp; Fig. 4B) confirmed that the PCR products generated were representative of RNA and not contaminated with genomic DNA (an intron-containing amplicon would be 708 bp). The PCR amplified fragments were sequenced to confirm that PCR produced specific amplification for mCLCA1. The expression of mCLCA3 was not detected in any of the isolated muscle cell preparations tested, even with 30 additional cycles of PCR. RT-PCR performed on RNA isolated from whole tissue did produce an amplicon of the correct size for mCLCA3 in each vascular, gastrointestinal and cardiac tissue tested (data not shown). Therefore, mCLCA3 must be expressed in a non-smooth muscle cell type in these preparations. This indicates that the primers designed for mCLCA3 were functional and we had not observed a false negative in the isolated cell preparations.
Figure 4. mCLCA1 expression in murine isolated muscle cells.

A, mCLCA1 expression was determined by RT-PCR on isolated smooth muscle and cardiac cell preparations. RT-PCR products were generated through the use of gene-specific primers for mCLCA1. RT-PCR products were resolved on 4 % agarose gels alongside a 100 bp marker. The mCLCA1 cDNA band is indicated at 105 bp. B, the constitutively expressed β-actin was used as a control gene to test the integrity of the cDNA and as a control for genomic DNA contamination since these primers were designed to span an intron as well as two exons. The β-actin amplicon, indicated at 498 bp, confirmed that RT-PCR products were representative of RNA and not contaminated with genomic DNA (an intron-containing amplicon would be 708 bp). C, quantitative levels of mCLCA1 expression in several murine tissues relative to β-actin. mCLCA1 expression was analysed by real-time quantitative PCR using SYBR Green chemistry on an ABI 5700 genetic detector. The same mCLCA1 primers used for qualitative analysis were used for quantitative RT-PCR. The expression of mCLCA1 gene transcripts were calculated from a standard curve (see Methods) and reported relative to β-actin gene expression within the same tissue (arbitrary units). Results are expressed as means ±s.e.m. (n = 3 for each tissue). NTC = no-template control.
Quantitative determination of mCLCA1 transcripts in smooth muscles
mCLCA1 expression was further analysed by the use of real time quantitative RT-PCR. The ABI 5700 Genetic Analyser was used to determine the relative expression levels of mCLCA1 channels in several smooth muscle preparations. RNA was reverse transcribed to cDNA, and steady-state transcripts were determined relative to an endogenous control housekeeping gene (β-actin). The relative transcriptional expression of mCLCA1 (the data expressed as mCLCA1/β-actin), in several murine muscles is shown in Fig. 4C. mCLCA1 mRNA expression relative to β-actin (arbitrary units) was calculated to be 0.057 ± 0.005 for colon, 0.045 ± 0.0035 for stomach, 0.145 ± 0.115 for jejunum, 0.043 ± 0.013 for portal vein, 0.035 ± 0.002 for pulmonary artery, 0.161 ± 0.018 for atrium and 0.059 ± 0.006 for ventricle (mean ± s.e.m., n = 3 for each tissue).
Cloning of mCLCA1 and heterologous expression in HEK293 cells
mCLCA1 was cloned from murine portal vein by PCR amplification with gene-specific primers designed according to the published sequence of mCLCA1 (Gandhi et al. 1998) and which span the open reading frame of the mCLCA1 gene. The cDNA encoding mCLCA1 was subcloned into the mammalian expression vector pcDNA3.1, so that it could be stably transfected and expressed in HEK293 cells. Stable expression of CLCA1 isolated from murine portal vein in HEK293 cells yielded a Cl− current that was not present in untransfected HEK293 cells (Fig. 5), and this was concomitant with the amplification of a PCR product for mCLCA1 only in the stably transfected cells (Fig. 5A). Figure 5B shows an example of currents recorded in transfected cells using pipette solutions containing either 500 nm Ca2+ (Fig. 5Bi) or 2 mm Ca2+ (Fig. 5Bii). Currents evoked with pipette solutions containing 500 nm Ca2+ were not significantly different than currents recorded with zero Ca2+ (Fig. 5B). For example the mean current densities at +60 mV were 2.0 ± 0.7 pA pF−1 and 1.2 ± 0.5 pA pF−1 for zero Ca2+ and 500 nm Ca2+, respectively (n = 6). Inclusion of 2 mm Ca2+ in the pipette solution evoked a current that was outwardly rectifying and exhibited no time dependence, which is similar to mCLCA1 and hCLCA1 shown previously (Gandhi et al. 1998; Gruber et al. 1998a). The amplitude of the current evoked by 2 mm Ca2+ in transfected cells was significantly larger at all potentials than currents evoked by the same pipette solution in untransfected cells or in transfected cells when lower Ca2+ were used (Fig. 5C). For example the mean current density at +60 mV in transfected cells dialysed with a pipette solution containing 2 mm Ca2+ was 9.8 ± 1.8 pA pF−1 (n = 14). The currents evoked in transfected cells by pipette solution containing 2 mm Ca2+ reversed close to the theoretical Cl− equilibrium potential (mean = −2.8 ± 1.2 mV, n = 8; Fig. 5D) and the reversal potential was shifted by replacement of the external anion by the more permeable SCN− (mean = −39 ± 1.5 mV, n = 7), or the less permeable isethionate (mean = +18.5 ± 3 mV, n = 5, see Fig. 5D). These changes in reversal potential are concomitant with a relative permeability of SCN− and isethionate of 5.3 ± 1.0 and 0.3 ± 0.07, respectively.
Figure 5. Characteristics of ICl(Ca) recorded in HEK293 cells stably transfected with mCLCA1.
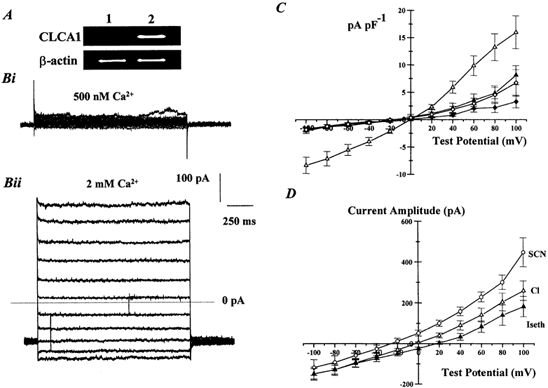
A, the lack of mCLCA1 PCR products in untransfected HEK293 cells (lane 1) but the presence of mCLCA1 amplicons in stably transfected HEK 293 cells (lane 2). β-actin PCR products were detected in both cell types. Bi and Bii show families of currents evoked by pipette solutions containing 500 nm Ca2+ (Bi) or 2 mm Ca2+ (Bii) recorded at potentials between −100 mV and +100 mV from HEK293 cells transfected with mCLCA1 cloned from portal vein. Dotted line represents the zero current level. C, the mean current density immediately before the end of the test step, evoked by pipette solutions containing 10 mm BAPTA only (zero Ca2+, ♦, n = 5); 500 nm Ca2+ (⋄; n = 6); and 2 mm Ca2+ (▵, n = 14) in transfected HEK293 cells. The density of currents evoked by 2 mm Ca2+ in untransfected cells is represented by ▴ (n = 7). D, mean current-voltage relationship for currents evoked by 2 mm Ca2+ in HEK293 cells transfected with mCLCA1 in external solutions containing 126 mmNaCl (▵), 126 mmNaSCN (○) or 126 mm sodium isethionate (▴). Each point is the mean of between five and eight cells with error bars representing the s.e.m.
Similar to the reports of Gandhi et al. (1998) and Gruber et al. (1998a), the current recorded in HEK293 cells stably expressing mCLCA1 was inhibited by external application of the reducing agent DTT. Figure 6A shows mCLCA1 currents evoked before and after 5 min application of 1 mm DTT that produced a marked inhibition of the current amplitude. The mean data from four such experiments are shown in Fig. 6B. In conclusion, expression of mCLCA1 isolated from mouse portal vein produced a Cl− current that had a relatively poor Ca2+ sensitivity, exhibited no time-dependent kinetics and was inhibited by bath application of DTT.
Figure 6. DTT inhibits ICl(Ca) recorded in HEK293 cells stably transfected with mCLCA1.
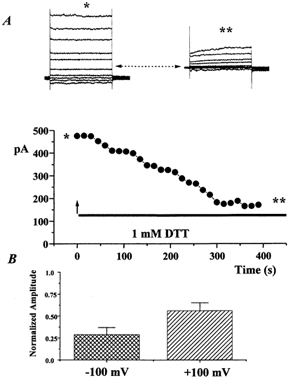
A, amplitude of the current recorded at +100 mV in the absence and presence of 1 mm DTT. Inserts show ensembles of currents recorded at potentials between −100 mV and +120 mV in the absence (at the point denoted by *) and presence of DTT (denoted by **). B, mean normalised amplitude of currents recorded at −100 mV ( ) and +100 mV (
 ) after 5 min application of 1 mm DTT (n = 4).
DISCUSSION
In the present study RT-PCR techniques were used to investigate the expression of mCLCA isoforms in isolated smooth muscle preparations, a cell type that has not been shown previously to exhibit CLCA isoforms. In addition, the characteristics of the native Ca2+-activated Cl− current in murine portal vein myocytes were determined and compared to currents recorded in HEK293 cells stably expressing mCLCA1 isolated from murine portal vein. We show that the expression of mCLCA1, but not mCLCA3, is present in smooth muscle cells and that a large Ca2+-activated Cl− current is present in murine vascular myocytes.
Characteristics of native Ca2+-activated Cl− currents in murine portal vein cells
In the present study Ca2+-activated Cl− current were evoked by pipette solutions containing clamped [Ca2+]i. This technique removes any reliance on functional Ca2+ influx or Ca2+ release and allows comparison between different cell types. Cl− currents evoked by this technique have been recorded in various non-smooth muscle cell types (Ishikawa & Cook, 1993; Arreola et al. 1996, 1998; Nilius et al. 1997) and more recently in smooth muscle cells from three different vascular preparations of the rabbit (Greenwood et al. 2001). In all cases, the evoked currents exhibit distinctive voltage-dependent characteristics with depolarisation to positive potentials yielding a slowly developing outward current that was followed by a rapidly decaying inward current upon repolarization, reflecting closure of the channels opened during the depolarising step (see Arreola et al. 1996; Nilius et al. 1997; Kuruma & Hartzell, 2000; Greenwood et al. 2001 for full discussion of the underlying mechanisms). Cl− currents activated by pipette solutions of known [Ca2+] in murine portal vein smooth muscle cells exhibited remarkably similar voltage-dependent kinetics to those described above. Moreover, the mean time constants for the activating and deactivating exponential fits were quantitatively similar to those reported previously in rabbit portal vein and pulmonary artery (Greenwood et al. 2001) and the deactivation kinetics of the murine Ca2+-activated Cl− currents was slowed markedly by substitution of the normal external solution for one that contained NaSCN. This is consistent with recent observations in rabbit portal vein smooth muscle cells that the kinetics of Ca2+-activated Cl− channels are modulated by anions binding to an external binding site (Greenwood & Large, 1999). In addition, the relative permeability of the underlying channel to the more permeable anion, SCN−, and the less permeable anion, isethionate, were comparable to values reported previously for Ca2+-activated Cl− channels in rabbit portal vein, pulmonary artery and coronary artery smooth muscle cells activated by pipette solutions containing clamped [Ca2+]i or by changing Ca2+ increments produced by Ca2+ influx or Ca2+ release from intracellular stores (Greenwood & Large, 1999; Greenwood et al. 2001). Of further interest, Greenwood et al. (2001) have shown previously that although ICl(Ca) could be recorded in the majority of rabbit pulmonary and coronary artery smooth muscle cells, only 33 % of rabbit portal vein cells exhibited Ca2+-activated Cl− currents. This, however, was not the case with murine portal vein smooth muscle cells since 70 % of the cells exhibited a Ca2+-activated Cl− current. This study provides the first characterisation of Ca2+-activated Cl− currents in murine vascular smooth muscle cells, an important preparation for future transgenic studies. The data shows that the kinetics and pore properties of the Cl− channel in murine cells are very similar to Ca2+-activated Cl− channels recorded from smooth muscle cells studied previously.
Expression of mCLCA isoforms in murine isolated cells
Gandhi et al. (1998) used homology cloning to identify a murine isoform (mCLCA1) of the bovine tracheal Ca2+-activated Cl− channel (bCLCA1; Cunningham et al. 1995), from a lung cDNA library. Other family members of related mouse proteins have since been identified. mCLCA2 described by Lee et al. (1999) is 97 % identical to mCLCA1 and is most probably encoded by the same gene. mCLCA3, previously called m-gob5 gene (Komiya et al. 1999) represents an independent isoform of the family. Each mCLCA family member has been reported to possess a distinct tissue expression pattern in murine tissues (Gruber et al. 1998b; Gandhi et al. 1998; Romio et al. 1999; Lee et al. 1999; Komiya et al. 1999).
In this study on isolated smooth muscle cells, mCLCA1 gene transcripts were expressed in murine muscle cells that were dispersed from portal vein, pulmonary artery, colon, stomach and jejunum, as well as individual myocytes isolated from atria and ventricle. mCLCA3 transcripts were not found to be expressed in any of these isolated cell preparations, but were detected when RT-PCR was performed using RNA isolated from whole tissue. The use of RNA from individually selected muscle cells avoids the contaminating effects of other cell types (Epperson et al. 2000), and thus provides a more accurate examination of gene expression. Indeed, Komiya et al. (1999) demonstrated previously that although northern blot analysis indicated that mCLCA3 was expressed in stomach, intestine and colon, in situ hybridisation revealed that mCLCA3 is located only in the mucous-secreting cells (goblet cells) in these tissues.
This study provides the first identification of mCLCA1 transcripts in individual vascular smooth muscle cells that have been isolated away from other contaminating cells types such as neurones and fibroblasts. Our expression results indicate that the mCLCA1 gene is expressed, at the mRNA level, in a variety of tissues. This is consistent with the expression patterns of mCLCA1 determined by Gruber et al. (1998b), who examined the tissue and cellular expression pattern of mCLCA1 by in situ hybridisation, RT-PCR and northern blotting. Their data indicated strong expression in tissues with secretory or ion regulatory functions, such as mammary gland, respiratory and intestinal epithelia, gall bladder, pancreas, kidney, uterus and epididymis. We further subjected the sequence of the mCLCA1 gene to a homology search using the BLASTN algorithm (Altschul et al. 1990) on the National Centre for Biotechnology Information web server (http://www.ncbi.nlm.nih.gov/BLAST/) against the murine EST database (dbEST). Computer analysis revealed the presence of 93 EST clones with > 98 % identity to mCLCA1. Several of these EST clones were derived from murine colon, heart, aorta and vein cDNA libraries that further confirm our expression analysis of mCLCA1 in these tissues.
Real time quantitative RT-PCR further determined the levels of mCLCA1 channel expression relative to the β-actin housekeeping gene, in several muscle preparations. Interestingly, although higher transcriptional levels of mCLCA1 were found in colon and jejunum, we failed to detect a Ca2+-activated Cl− current in 24 out of 25 isolated murine colon cells. The discrepancy is evidence against an association between functional ICl(Ca) and mCLCA1 expression.
Comparison of native currents and expressed, cloned CLCA isoforms
Species-dependent isoforms of CLCA gene products have been expressed in HEK293 cells in various studies (Gandhi et al. 1998; Gruber et al. 1998a, 1999). In all cases the expressed current required a high concentration of Ca2+ (2 mm) for activation, reversed at 0 mV, exhibited some outward rectification but no time-dependent kinetics and was inhibited by DTT. In the present study, we have stably expressed CLCA1 isolated from murine portal vein smooth muscle, a preparation that we show in this study has robust Ca2+-activated Cl− currents with distinctive characteristics. The currents recorded in HEK293 cells transfected with mCLCA1 shared all of the characteristics of CLCA1 isoforms isolated from other preparations highlighted above. The current evoked in transfected cells was a Cl− current as determined by the shifts in reversal potential produced by isomolar changes in the external anion and the relative permeabilities of SCN− and isethionate are comparable to the permeability ratios of these anions through the native Ca2+-activated Cl− current in portal vein smooth muscle cells. However, there were a number of differences between the Cl− current recorded from mCLCA1-transfected HEK293 cells and the native current in portal vein myocytes. Firstly, the Ca2+ required to activate a current in transfected HEK293 cells was markedly higher than that required to evoke a Ca2+-activated Cl− current in smooth muscle cells although the maximal current amplitude evoked in HEK cells by 500 nm Ca2+ was similar in magnitude to the level of instantaneous current recorded with the same pipette solution in portal vein cells. Secondly, the native current in portal vein smooth muscle cells exhibited distinctive outward relaxations upon repolarisation that are characteristic of this conductance in smooth muscle cells and other cell types (see above) and that were not observed for currents generated in transfected HEK293 cells. Finally, we show that the native Ca2+ -activated Cl− current in murine portal vein myocytes is not inhibited by a 5 min application of DTT. In comparison, application of DTT to HEK293 cells expressing mCLCA1 for the same period of time produce a profound inhibition of current amplitude that was consistent with earlier reports on expressed CLCA gene products (Gandhi et al. 1998; Gruber et al. 1998a, 1999). Consequently, whilst some similarities exist in the pore properties of mCLCA1 and native Ca2+-activated Cl− currents, there are considerable differences in the channel kinetics, Ca2+ sensitivity and modulation.
In conclusion, we have characterised fully for the first time a Ca2+-activated Cl− current in murine vascular smooth muscle cells that had considerable similarities to Ca2+-activated Cl− conductances recorded in other species. We also show that smooth muscle cells express CLCA1 and that the characteristics of CLCA1 isolated from murine portal vein stably expressed by HEK293 cells are not comparable to the native current. These data suggest that CLCA1 alone does not comprise the channel underlying the Ca2+-activated Cl− current in smooth muscle cells. Recently, Papassotiriou et al. (2001) have shown that Erlich ascites exhibit Ca2+-activated Cl− currents with characteristics similar to the native Cl− currents described in the present study and in previous reports (Arreola et al. 1996; Nilius et al. 1997; Greenwood et al. 2001). However, these cells did not show expression of any of the CLCA isoforms. It is also worth noting that in the present study, whilst the level of mCLCA1 was quantitatively higher in murine colonic smooth muscle cells compared to portal vein cells, the ability to record a Ca2+-activated Cl− current was considerably higher in the latter cell type. Therefore, as with Papassotiriou et al. (2001), some discrepancy exists between the expression of CLCA genes and the ability to recorded time-dependent Cl− currents.
The one consistent feature between mCLCA1 and the native ICl(Ca) is relative anion permeability. One might speculate that a similarity in this distinctive pore property might be due to a similar pore structure as other Cl− channels (e.g. cystic fibrosis transmembrane conductance regulator (CFTR) or swelling-activated) have different and distinctive anion permeability profiles that most probably result from a diversity in the structure of their respective pore domains. The structural similarities of the ClC Cl− channel family results in the most identical family members having very similar anion permeability profiles. The two possibilities for the relationship between mCLCA1 and ICl(Ca) are: (1) they are distinctive molecular forms with no relationship between them, and (2) an accessory protein modulates the properties of mCLCA1 to become that of ICl(Ca). The similarity in anion permeability gives some plausibility to the latter possibility and experiments to test that hypothesis should be conducted.
Acknowledgments
National Institutes of Health grants DK 41315, HL 49254 and P20 RR15581 supported this work. I. A. G. is a Wellcome Trust Research Fellow. The authors would like to thank Lisa Miller, Heather Beck and Deanne Denmark for excellent technical assistance.
REFERENCES
- Agnel M, Vermat T, Culouscou JM. Identification of three novel members of the calcium-dependent chloride channel (CaCC) family predominantly expressed in the digestive tract and trachea. FEBS Letters. 1999;455:295–301. doi: 10.1016/s0014-5793(99)00891-1. [DOI] [PubMed] [Google Scholar]
- Altschul SF, Gish W, Miller W, Myers EW, Lipman DJ. Basic local alignment search tool. Journal of Molecular Biology. 1990;215:403–410. doi: 10.1016/S0022-2836(05)80360-2. [DOI] [PubMed] [Google Scholar]
- Arreola J, Melvin JE, Begenisich T. Activation of calcium-dependent chloride channels in rat parotid acinar cells. Journal of General Physiology. 1996;108:35–47. doi: 10.1085/jgp.108.1.35. [DOI] [PMC free article] [PubMed] [Google Scholar]
- Arreola J, Melvin JE, Begenisich T. Differences in regulation of Ca2+-activated Cl− channels in colonic and parotid secretory cells. American Journal of Physiology. 1998;274:C161–166. doi: 10.1152/ajpcell.1998.274.1.C161. [DOI] [PubMed] [Google Scholar]
- Cunningham SA, Awayda MS, Bubien JK, Ismailov II, Arrate MP, Berdiev BK, Benos DJ, Fuller CM. Cloning of an epithelial chloride channel from bovine trachea. Journal of Biological Chemistry. 1995;270:31016–31026. doi: 10.1074/jbc.270.52.31016. [DOI] [PubMed] [Google Scholar]
- Elble RC, Widom J, Gruber AD, Abdel-Ghany M, Levine R, Goodwin A, Cheng HC, Pauli BU. Cloning and characterization of lung-endothelial cell adhesion molecule-1 suggest it is an endothelial chloride channel. Journal of Biological Chemistry. 1997;272:27853–27861. doi: 10.1074/jbc.272.44.27853. [DOI] [PubMed] [Google Scholar]
- Epperson A, Hatton WJ, Callaghan B, Doherty P, Walker RL, Sanders KM, Ward SM, Horowitz B. Molecular markers expressed in cultured and freshly isolated interstitial cells of Cajal. American Journal of Physiology - Cell Physiology. 2000;279:C529–539. doi: 10.1152/ajpcell.2000.279.2.C529. [DOI] [PubMed] [Google Scholar]
- Evans MG, Marty A. Calcium-dependent chloride currents in isolated cells from rat lacrimal glands. Journal of Physiology. 1986;378:437–460. doi: 10.1113/jphysiol.1986.sp016229. [DOI] [PMC free article] [PubMed] [Google Scholar]
- Gandhi R, Elble RC, Gruber AD, Schreur KD, Ji HL, Fuller CM, Pauli BU. Molecular and functional characterization of a calcium-sensitive chloride channel from mouse lung. Journal of Biological Chemistry. 1998;273:32096–32101. doi: 10.1074/jbc.273.48.32096. [DOI] [PubMed] [Google Scholar]
- Greenwood IA, Large WA. Modulation of the decay of Ca2+-activated Cl− currents in rabbit portal vein smooth muscle cells by external anions. Journal of Physiology. 1999;516:365–376. doi: 10.1111/j.1469-7793.1999.0365v.x. [DOI] [PMC free article] [PubMed] [Google Scholar]
- Greenwood I, Ledoux J, Leblanc N. Differential regulation of Ca2+-activated Cl− currents in rabbit arterial and portal vein smooth muscle cells by Ca2+-calmodulin- dependent kinase. Journal of Physiology. 2001;534:395–408. doi: 10.1111/j.1469-7793.2001.00395.x. [DOI] [PMC free article] [PubMed] [Google Scholar]
- Gruber AD, Elble RC, Ji HL, Schreur KD, Fuller CM, Pauli BU. Genomic cloning, molecular characterization, and functional analysis of human CLCA1, the first human member of the family of Ca2+-activated Cl− channel proteins. Genomics. 1998a;54:200–214. doi: 10.1006/geno.1998.5562. [DOI] [PubMed] [Google Scholar]
- Gruber AD, Gandhi R, Pauli BU. The murine calcium-sensitive chloride channel (mCaCC) is widely expressed in secretory epithelia and in other select tissues. Histochemistry and Cell Biology. 1998b;110:43–49. doi: 10.1007/s004180050263. [DOI] [PubMed] [Google Scholar]
- Gruber AD, Pauli BU. Molecular cloning and biochemical characterization of a truncated, secreted member of the human family of Ca2+-activated Cl− channels. Biochimica et Biophysica Acta. 1999;1444:418–423. doi: 10.1016/s0167-4781(99)00008-1. [DOI] [PubMed] [Google Scholar]
- Gruber AD, Schreur KD, Ji HL, Fuller CM, Pauli BU. Molecular cloning and transmembrane structure of hCLCA2 from human lung, trachea, and mammary gland. American Journal of Physiology. 1999;276:C1261–1270. doi: 10.1152/ajpcell.1999.276.6.C1261. [DOI] [PubMed] [Google Scholar]
- Hogg RC, Wang Q, Helliwell RM, Large WA. Properties of spontaneous inward currents in rabbit pulmonary artery smooth muscle cells. Pflügers Archiv. 1993;425:233–240. doi: 10.1007/BF00374172. [DOI] [PubMed] [Google Scholar]
- Horton RM, Cai ZL, Ho SN, Pease LR. Gene splicing by overlap extension: tailor-made genes using the polymerase chain reaction. Biotechniques. 1990;8:528–535. [PubMed] [Google Scholar]
- Ishikawa T, Cook DI. A Ca2+-activated Cl− current in sheep parotid secretory cells. Journal of Membrane Biology. 1993;135:261–271. doi: 10.1007/BF00211098. [DOI] [PubMed] [Google Scholar]
- Komiya T, Tanigawa Y, Hirohashi S. Cloning and identification of the gene gob-5, which is expressed in intestinal goblet cells in mice. Biochemical and Biophysical Research Communications. 1999;255:347–351. doi: 10.1006/bbrc.1999.0168. [DOI] [PubMed] [Google Scholar]
- Kuruma A, Hartzell HC. Bimodal control of a Ca2+-activated Cl− channel by different Ca2+ signals. Journal of General Physiology. 2000;115:59–80. doi: 10.1085/jgp.115.1.59. [DOI] [PMC free article] [PubMed] [Google Scholar]
- Large WA, Wang Q. Characteristics and physiological role of the Ca2+-activated Cl− conductance in smooth muscle. American Journal of Physiology. 1996;271:C435–454. doi: 10.1152/ajpcell.1996.271.2.C435. [DOI] [PubMed] [Google Scholar]
- Lee D, Ha S, Kho Y, Kim J, Cho K, Baik M, Choi Y. Induction of mouse Ca2+-sensitive chloride channel 2 gene during involution of mammary gland. Biochemical and Biophysical Research Communications. 1999;264:933–937. doi: 10.1006/bbrc.1999.1583. [DOI] [PubMed] [Google Scholar]
- Nilius B, Prenen J, Voets T, Van den Bremt BK, Eggermont J, Droogmans G. Kinetic and pharmacological properties of the calcium-activated chloride-current in macrovascular endothelial cells. Cell Calcium. 1997;22:53–63. doi: 10.1016/s0143-4160(97)90089-0. [DOI] [PubMed] [Google Scholar]
- Ohya S, Tanaka M, Oku T, Asai Y, Watanabe M, Giles WR, Imaizumi Y. Molecular cloning and tissue distribution of an alternatively spliced variant of an A-type K+ channel alpha-subunit, Kv4. 3 in the rat. FEBS Letters. 1997;420:47–53. doi: 10.1016/s0014-5793(97)01483-x. [DOI] [PubMed] [Google Scholar]
- Pacaud P, Loirand G, Gregoire G, Mironneau C, Mironneau J. Calcium-dependence of the calcium-activated chloride current in smooth muscle cells of rat portal vein. Pflügers Archiv. 1992;421:125–130. doi: 10.1007/BF00374818. [DOI] [PubMed] [Google Scholar]
- Papassotiriou J, Eggermont J, Droogmans G, Nilius B. Ca2+-activated Cl- channels in Ehrlich ascites tumor cells are distinct from mCLCA1, 2 and 3. Pflügers Archiv. 2001;442:273–279. doi: 10.1007/s004240100526. [DOI] [PubMed] [Google Scholar]
- Pauli BU, Abdel-Ghany M, Cheng HC, Gruber AD, Archibald HA, Elble RC. Molecular characteristics and functional diversity of CLCA family members. Clinical and Experimental Pharmacology and Physiology. 2000;27:901–905. doi: 10.1046/j.1440-1681.2000.03358.x. [DOI] [PubMed] [Google Scholar]
- Romio L, Musante L, Cinti R, Seri M, Moran O, Zegarra-Moran O, Galietta LJ. Characterization of a murine gene homologous to the bovine CaCC chloride channel. Gene. 1999;228:181–188. doi: 10.1016/s0378-1119(98)00620-9. [DOI] [PubMed] [Google Scholar]
- Wang Q, Hogg RC, Large WA. Properties of spontaneous inward currents recorded in smooth muscle cells isolated from the rabbit portal vein. Journal of Physiology. 1992;451:525–537. doi: 10.1113/jphysiol.1992.sp019177. [DOI] [PMC free article] [PubMed] [Google Scholar]