

Abstract
The glutamine transporter SN1 has recently been identified as one of the major glutamine transporters in hepatocytes and brain astrocytes. It appears to be the molecular correlate of system N amino acid transport. Two different transport mechanisms have been proposed for this transporter. These are an electroneutral mechanism, in which glutamine uptake is coupled to an exchange of 1Na+ and 1H+, or an electrogenic mechanism coupled to the exchange of 2Na+ against 1H+. This study was performed to solve these discrepancies and to investigate the reversibility of the transporter. When SN1 was expressed in Xenopus laevis oocytes, glutamine uptake was accompanied by a cotransport of 2–3 Na+ ions as determined by 22Na+ fluxes. However, at the same time a rapid release of intracellular Na+ was observed indicating an active exchange of Na+ ions. The driving force of the proton electrochemical gradient was equivalent to that of the sodium electrochemical gradient. Acidification of the extracellular medium caused the transporter to run in reverse and to release glutamine. Determination of accumulation ratios at different driving forces were in agreement with an electroneutral 1Na+-glutamine cotransport-1H+ antiport. Inward currents that were observed during glutamine uptake were much smaller than expected for a stoichiometric cotransport of charges. A slippage mode in the transporter mechanism and pH-regulated endogenous oocyte cation channels are likely to contribute to the observed currents.
Intercellular transfer of glutamine plays a crucial role in brain, liver and muscle metabolism (Rennie et al. 1996; Häussinger, 1998; Bröer & Brookes, 2001). It is generally accepted that the neurotransmitter glutamate is recycled via the glutamate-glutamine cycle in the brain. After being released during neurotransmission, glutamate is taken up largely by astrocytes. There it is converted into glutamine and subsequently released into the extracellular space. Glutamine is then taken up by neurons and converted into glutamate (Bröer & Brookes, 2001). Similarly, perivenous scavenger cells in the liver take up glutamate and use glutamine synthetase to convert it into glutamine which is then released into the blood (Häussinger, 1998). Striated muscle cells, depending on the metabolic state, may also take up or release glutamine (Rennie et al. 1996). Recently, the glutamine transporter SN1 has been identified on a molecular basis (Chaudhry et al. 1999; Gu et al. 2000; Fei et al. 2000). The transporter is expressed mainly in brain astrocytes and the liver and its substrate specificity is identical to the substrate specificity of the well-characterized amino acid transport system N (Kilberg et al. 1980). The mechanism of the transporter is still controversial. Chaudhry et al. (1999) suggested an electroneutral transport mechanism in which uptake of glutamine is accompanied by the cotransport of 1Na+ and the antiport of 1H+. In contrast, an electrogenic transport mechanism was proposed by Fei et al. (2000) in which glutamine uptake was accompanied by the cotransport of 2Na+. The antiport of H+ was not addressed in that study, but was assumed to take place because of the pH dependence of the transport activity. The difference between both proposed mechanisms has important physiological implications. The electroneutral mechanism would allow only a 10- to 20-fold accumulation of glutamine inside the cell, and it would allow a reversal of the transporter at acidic pH. The electrogenic mechanism, by contrast, would exert a strong inwardly directed driving force, allowing a 1000-fold accumulation of glutamine in the cytosol. If SN1 couples glutamine transport to the cotransport of 2Na+, it would be unlikely to participate in release of glutamine from astrocytes or liver cells.
To clarify the discrepancies of the proposed SN1 mechanisms, we have expressed this transporter in Xenopus laevis oocytes and analysed its properties by flux studies and electrophysiological techniques. Our data suggest that SN1 mediates an electroneutral transport mechanism and that pH and the intracellular Na+ concentration are the main regulators of the mechanism. A kinetic model is presented that accounts for all experimental observations.
METHODS
Materials
l-[U-14C]glutamine (9.36 GBq mmol−1), and 22NaCl were purchased from Amersham/Pharmacia (Bulkham Hills, NSW, Australia). The RNA cap structure analog m7G(5′)ppp(5′)G, restriction enzymes, nucleotides and RNA polymerases were from Life Technologies (Mulgrave, Victoria, Australia). Collagenase (EC 3.4.24.3; 0.3 U mg−1 from C. histolyticum) was from Roche (Castle Hill, NSW, Australia); lots were tested for their suitability for oocyte expression. All other chemicals were of analytical grade and purchased from Merck (Kilsyth, Victoria, Australia) or ICN Biomedicals (Aurora, OH, USA).
Oocytes and injections
Xenopus laevis females were purchased from the South African Xenopus facility (Knysna, Republic of South Africa). Oocytes (stages V and VI) were isolated by collagenase treatment as described (Wagner et al. 2000) and allowed to recover overnight. The surgical removal of ovarian tissue was performed under anaesthetic (20 min immersion in 1% MS-222) and was approved by the animal ethics committee of the Australian National University (File F.BMB.81–00).
The cloning of the rSN1 cDNA was described earlier (Chaudhry et al. 1999). For expression in oocytes the coding sequence was excised with BamHI and HindIII and subcloned into pGEM-He-Juel. The rat ATA1 cDNA was cloned as described recently (Albers et al. 2001).
Plasmid DNA was linearized with Sal I (all cDNAs) and transcribed in vitro using the T7 mMessageMachine Kit (Ambion, Austin, TX, USA). Template plasmid was removed by digestion with RNase-free DNase I. The complementary RNA (cRNA) was purified twice by phenol-chloroform extraction followed by precipitation with 0.5 volumes 7.5 m ammonium acetate and 2.5 volumes of ethanol to remove unincorporated nucleotides. The integrity of the transcript was checked by denaturing agarose gel electrophoresis. Oocytes were microinjected with 5–20 nl rSN1 or ATA1 cRNA in water at a concentration of 1 μg μl−1, by using a microinjection device (WPI, Sarasota, FL, USA) or remained uninjected in the controls.
Flux measurements
For each determination, groups of 7–10 cRNA- or non-injected oocytes were washed twice with 4 ml ND96 buffer (96 mmNaCl, 2 mm KCl, 1 mm MgCl2, 1.8 mm CaCl2, 5 mm Hepes, adjusted with NaOH to pH 7.4). In some experiments the slightly different OR2+ buffer (82.5 mmNaCl; 2.5 mm KCl; 1 mm CaCl2; 1 mm MgCl2; 1 mm Na2HPO4; 5 mm Hepes, adjusted with NaOH to pH 7.8) was used. Oocytes were then incubated at room temperature in a 5 ml polypropylene tube containing 100 μl of the same buffer containing 5 kBq [14C]-labelled amino acid plus unlabelled substrates as required. Transport was stopped after the appropriate interval by washing oocytes three times with 4 ml ice-cold ND96 buffer (or OR2+ buffer). Single oocytes were placed in scintillation vials and lysed by addition of 200 μl 10% SDS. After lysis, 3 ml scintillation fluid was added, and the radioactivity determined by liquid scintillation counting. The uptake of glutamine was proportional to time for 10 min (data not shown). Therefore flux measurements were usually performed using incubation times of 5 or 10 min. When accumulation was determined, the incubation time was extended to 120 min. For efflux experiments oocytes were injected with 40 nl of a mixture of one volume 30 mm glutamine and two volumes [14C]glutamine. This results in a final glutamine concentration of 1 mm in the oocyte cytosol (assuming 400 nl water accessible volume; Stegen et al. 2000). Subsequently oocytes were placed in multiwell plates and washed three times with cold ND96 buffer. Efflux was initiated by addition of 300 μl ND96 buffer. Aliquots were removed after different incubation times and radioactivity was determined by liquid scintillation counting.
For 22Na+ efflux experiments, oocytes were preloaded with 22Na+ by incubation in ND10 (10 mmNaCl, 86 mmN-methyl-d-glucamine chloride, 2 mm KCl, 1 mm MgCl2, 1.8 mm CaCl2, 5 Hepes-NaOH, pH 7.4) in the presence of 22Na+ and 10 mm glutamine for 10 min. Subsequently, oocytes were washed three times with 4 ml ice-cold incubation buffer to remove labelled sodium. Efflux was initiated by replacing the ice-cold incubation buffer by 1 ml ND10 (with or without 10 mm unlabelled glutamine) at room temperature. Aliquots of 100 μl were removed at intervals for counting. The efflux curves were calculated by integration of the measured radioactivity in the supernatant over time.
To induce a pH jump without altering other ion gradients, an acidic and an alkaline ND96 solution was prepared. Untitrated Tris-base was used as a buffer in alkaline ND96, whereas untitrated 2-[N-morpholino]ethanesulphonic acid (Mes) was used as a buffer substance in the acidic ND96. The solution contained 100 μm [14C]glutamine at the same specific activity as the preloading buffer. Oocytes were preloaded with labelled glutamine (100 μm) in 100 μl ND96 at pH 7.4 for 30 min. Subsequently 35 μl Mes-ND96, 5 μl Mes-ND96 or 37 μl Tris-ND96 were added to adjust the buffer to a final value of pH 6.0, pH 7.0 or pH 8.0, respectively.
Electrophysiological measurements
Two-electrode voltage-clamp recordings were performed at a holding potential of −50 mV as described recently (Wagner et al. 2000) unless otherwise stated. The data were filtered at 10 Hz and recorded with a MacLab digital-to-analog converter and software for data acquisition and analysis (ADInstruments, Castle Hill, Australia). During measurements oocytes were superfused with ND96 buffer at a flow rate of 20 ml min−1 and a complete exchange of the bath was reached within about 10 s.
pH-sensitive electrodes
pH-sensitive electrodes were made and calibrated as described previously (Bröer et al. 1998). In brief, borosilicate electrodes were pulled, silanized with 5% tributylchlorosilane in carbon tetrachloride and baked at 400–450 °C for 15 min. A column of H+ cocktail (hydrogen ionophore I-cocktail A, Fluka Chemicals) of ∼300 μm in length, was established at the tip of the electrode. The electrode was back-filled with a solution of 100 mm KCl buffered with 10 mm Hepes at pH 7.0. The electrode was calibrated using solutions with pH 6.0, 7.0 and 8.0. Only electrodes with a linear slope > 50 mV/pH unit and stable calibration before and after the experiment were used. Signals were amplified with an electrometer (FD223, WPI, Sarasota, FL, USA) and subsequently recorded with a MacLab digital-to-analog converter. On the basis of the calibration curve for the pH-sensitive electrode, the intracellular pH of oocytes was calculated as the difference between the membrane potential in millivolts measured simultaneously with a 3 m KCl microelectrode and the potential of the pH-sensitive electrode. To measure the membrane potential, only the KCl-filled electrode was used.
Calculations
For radioactive flux measurements each data point represents the difference between the mean uptake activity (± s.d.) of 7–10 rSN1 or ATA1 expressing oocytes and 7–10 non-injected oocytes. The s.d. of this difference was calculated using Gauss's law of error propagation. Electrophysiological recordings were similarly performed on 7–10 oocytes, the whole experiment being repeated at least twice with different oocyte batches. Accumulation ratios were calculated using the formula
for the electrogenic mechanism and
for the electroneutral mechanism (Heinz, 1978).
RESULTS
To analyse the properties of the glutamine transporter SN1 its cRNA was expressed in Xenopus laevis oocytes. At a substrate concentration of 0.1 mm, SN1-expressing oocytes took up glutamine at a rate of 82 ± 5 pmol (5 min)−1 oocyte−1 (n = 10), whereas non-injected oocytes took up 2 ± 0.2 pmol (5 min)−1 oocyte−1 (n = 10). The transporter displayed a low affinity for its substrate. A Km of 1.5 mm was determined for glutamine at pH 7.4 in ND96 transport buffer.
How many sodium ions are cotransported with glutamine by SN1?
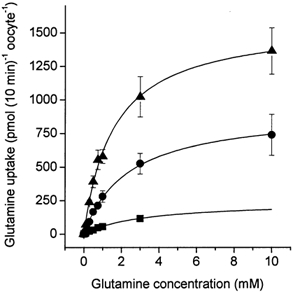
Transport of glutamine into SN1-expressing oocytes was Na+ dependent. When glutamine uptake was determined at a substrate concentration of 100 μm, a Km for Na+ of 31 ± 10 mm was determined at pH 7.0. The Km varied with pH. At pH 6 a similar Km of 38 ± 12 mm was determined, whereas SN1 showed a strong increase in the affinity for Na+ with a Km of 6.3 ± 1 mm at pH 8.0 (Fig. 1). The derived curves could be well fitted using the hyperbolic Michaelis-Menten equation; the fit was not improved when a Hill equation was used to analyse the data. However, in Eadie-Hofstee plots a high-affinity component of the Na+ dependence was observed, particularly at pH 7.0 and 8.0. The Km of this high-affinity component was in the order of 0.3–0.4 mm. To gain a more direct insight into Na+ cotransport we used 22Na+ to determine the cotransport stoichiometry of SN1. Although we could not clamp oocytes at a specified voltage during these experiments, any depolarization of the oocytes that occurs during transport affects both glutamine uptake and Na+ uptake to the same extent. In two independent experiments we determined a cotransport of 2–3 Na+ ions together with glutamine (Table 1). In these oocytes, SN1 is the major pathway of Na+ transport; thus the effect of depolarization on other pathways is unlikely to affect results significantly. We have recently shown that the Na+ electrochemical gradient used by a transporter can be overestimated when the possibility of Na+ exchange is not taken into account (Bröer et al. 2000a). To determine whether such an exchange takes place during glutamine transport, we first preloaded oocytes for 10 min with 22Na+ by cotransporting it with unlabelled glutamine (10 mm) under Vmax conditions. Oocytes were then washed to remove extracellular 22Na+ and subsequently incubated in transport buffer containing unlabelled glutamine. The subsequent uptake of unlabelled glutamine was accompanied by a rapid release of 22Na+ (Fig. 2A). In a parallel experiment with oocytes of the same batch we checked whether the preloading period had any influence on glutamine uptake. In the preloading phase we determined a transport activity of 1.12 ± 0.07 nmol glutamine (10 min)−1 oocyte−1 that compared to a transport activity of 1.25 ± 0.14 nmol glutamine (10 min)−1 oocyte−1 in the second phase of the experiment, where the efflux of Na+ was observed. These data suggested that the net cotransport stoichiometry was significantly less than 2–3 because some of the inwardly transported Na+ ions are immediately being exchanged back to the extracellular space. A significant part of 22Na+ efflux depended on the presence of extracellular glutamine and thus was not mediated by the endogenous Na+-K+-ATPase (Fig. 2B).
Figure 1. Dependence of glutamine uptake via SN1 on the extracellular Na+ concentration at different pH values.
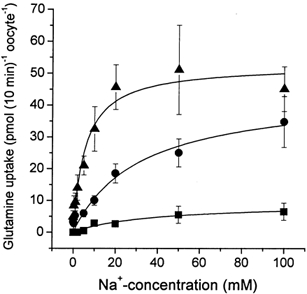
Oocytes were injected with 20 ng SN1 cRNA or remained uninjected. After an incubation period of 4 days, uptake of labelled glutamine (100 μm) was determined over a period of 10 min in buffers of different NaCl concentration (NaCl replaced by NMDG-chloride) at pH 6.0 (filled squares), pH 7.0 (filled circles) and pH 8.0 (filled triangles). The transport activity of non-injected oocytes is already subtracted. The mean transport activity of 10 oocytes was determined for each datapoint.
Table 1.
Cotransport of22Na+with glutamine
| Expressed cRNA | Addition | Uptake of [14C ]glutamine (pmol(10 min)−1oocyte−1) | Uptake of 22Na+ (pmol(10 min)−1 oocyte−1) | 22Na+/Gln ratio |
|---|---|---|---|---|
| None | None | — | 241 ± 27 | n.m. |
| SN1 | None | — | 368 ± 27 | n.m. |
| None | 10mm Gln | 6 ± 9 | 219 ± 19 | n.m. |
| SN1 | 10mm Gln | 928 ± 86 | 2978 ± 307 | 3.0 |
Oocytes were injected with 20ng SN1 cRNA or remained uninjected. After an expression period of 3days uptake of [14C ] glutamine (10m glutamine) and uptake of 22Na+(10mmNaCl) were determined over an incubation period of 10 min. Glutamine transport and uptake of 22Na+ were compared in oocytes of the same batch in parallel experiments.n.m.,not meaningful.
Figure 2. Release of 22Na+ during glutamine uptake.
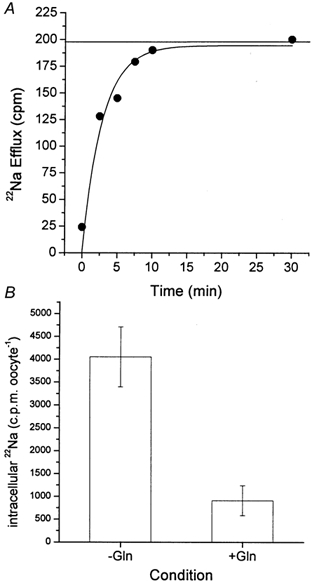
Oocytes were injected with 20 ng SN1 cRNA or remained uninjected. A, after an incubation period of 6 days, 10 oocytes were first preloaded with 22Na+ (10 mmNaCl, 86 mm NMDG-Cl) at pH 7.4 in the presence of 10 mm glutamine. After 10 min oocytes were washed and the transport buffer was replaced by the same unlabelled buffer in the continued presence of 10 mm glutamine. Release of 22Na+ was followed by taking samples from the supernatant. In 10 control oocytes of the same batch the level of 22Na+ preloading was determined. The maximum releasable pool of 22Na+ is shown by the horizontal line in the graph. B, in a different experiment 10 oocytes were first preloaded with 22Na+ (10 mmNaCl, 86 mm NMDG-Cl) at pH 7.4 in the presence of 10 mm glutamine (preloading level 14600 ± 2500 c.p.m.). After 10 min oocytes were washed and the transport buffer was replaced by the same unlabelled buffer with or without addition of 10 mm glutamine. The intracellular Na+ that remained after 30 min of efflux in the oocytes was determined under both conditions. The difference in scale between experiments A and B resulted from the differing specific activity of the 22NaCl batches.
Is the pH gradient a driving force of SN1?
The transport activity of SN1 significantly increased with increasing pH (Fig. 3). In contrast to the related isoforms of the system A amino acid transporter family (Reimer et al. 2000; Albers et al. 2001), we found that transport of glutamine via SN1 caused an increase of the intracellular pH as monitored by intracellular pH electrodes (Fig. 4). The intracellular alkalization was correlated with the glutamine transport activity, being more extensive at alkaline extracellular pH values. Uptake of glutamine was therefore clearly associated with an antiport of protons. We also observed a significant depolarization of oocytes during glutamine transport, that will be discussed below. The increase of the transport velocity with increasing pH could be attributed to changes of the Vmax of glutamine transport, whereas the Km of glutamine remained largely constant, being 3.3 ± 2.4, 2.4 ± 0.6 and 1.6 ± 0.6 mm at pH 6.0, 7.0 and 8.0, respectively (Fig. 5).
Figure 3. Glutamine transport via SN1 is pH dependent.
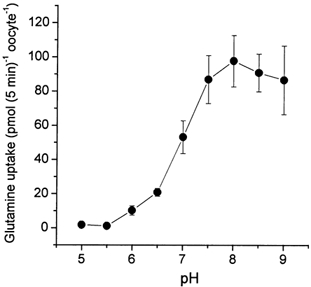
Oocytes were injected with 20 ng SN1 cRNA or remained uninjected. After an incubation period of 4 days, uptake of labelled glutamine (100 μm) was determined over a period of 5 min. The transport activity of non-injected oocytes is already subtracted. The mean transport activity of 10 oocytes was determined for each pH value.
Figure 4. Uptake of glutamine via SN1 increases the cytosolic pH of oocytes.
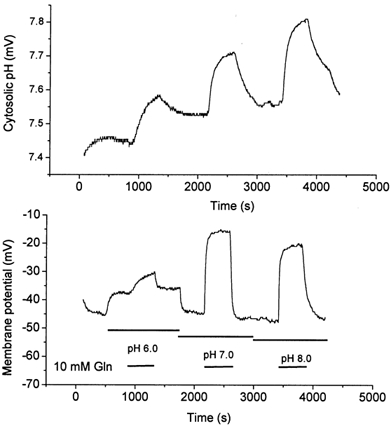
Oocytes were injected with 20 ng SN1 cRNA or remained uninjected. After an incubation period of 3 days, oocytes were superfused with glutamine (10 mm)-containing or glutamine-free solutions of different pH values. The cytosolic pH (upper panel) and the membrane potential (lower panel) were recorded with microelectrodes. Substrate superfusion periods are indicated by horizontal bars. Non-injected oocytes did not respond to superfusion of glutamine.
Figure 5. Determination of the glutamine Km at different pH values.
Oocytes were injected with 20 ng SN1 cRNA or remained uninjected. After an incubation period of 4 days, uptake of labelled glutamine was determined over a period of 10 min. The glutamine concentration was varied between 0 and 10 mm in transport buffers titrated to pH 6.0 (filled squares), pH 7.0 (filled circles) and pH 8.0 (filled triangles). The transport activity of non-injected oocytes is already subtracted. The mean transport activity of 10 oocytes was determined for each datapoint. The 10 mm data point in the pH 6.0 set could not be evaluated due to the low specific activity.
To determine to what extent protons contributed to the driving force used by the transporter, we switched the pH under static head conditions, i.e. when net flow of substrate is negligible. In these experiments, oocytes were first preloaded for 30 min at pH 7.4 with labelled glutamine (100 μm). Subsequently a small amount of ‘pH-switch’ buffer was added to adjust the resulting buffer to final values of pH 6.0, 7.0 or 8.0 (Fig. 6). Apart from the different pH, the pH-switch buffer contained all other components, including labelled glutamine, at identical concentrations to the uptake buffer. Thus only the pH gradient was changed in these experiments, whereas substrate (including specific activity), sodium, chloride and potassium gradients remained constant. A switch to pH 8.0 caused further accumulation of glutamine in the oocyte cytosol. When switched to pH 7.0, accumulation ceased. However, a switch to pH 6.0 caused a significant release of glutamine (Fig. 6). The reversal of the transporter at pH 6.0 suggested that the proton electrochemical gradient was equivalent to the sodium electrochemical gradient.
Figure 6. Glutamine transport via SN1 reverses at acidic pH.
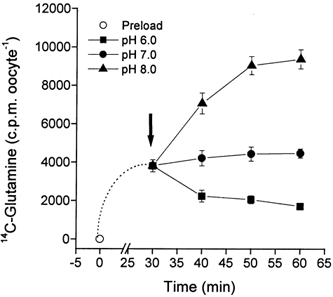
Oocytes were injected with 20 ng SN1 cRNA or remained uninjected. After an incubation period of 3 days, oocytes were first preloaded with labelled glutamine (100 μm) at pH 7.4 (open circle). After 30 min preloading, the ‘pH switch buffer’ was added to the samples to adjust the final pH to 6.0 (filled squares), pH 7.0 (filled circles) or pH 8.0 (filled triangles). The ‘pH switch buffer’ differed in pH from the preloading buffer, but otherwise had an identical substrate concentration, specific activity and salt concentration.
Are other ions involved in the transport mechanism?
To elucidate whether other ions might be involved in the transport mechanism of SN1, substitution experiments were performed. In agreement with the known properties of SN1, Li+ can replace Na+ as the cotransported ion, but this reduces transport activity by 35%. Replacement of chloride ions by gluconate did not alter the uptake activity of labelled glutamine (Table 2). Similarly, glutamine transport remained largely constant when the extracellular potassium concentration was changed from 0 to 30 mm KCl (Table 2). However, higher potassium concentrations (50 mm) always caused a reduction of glutamine transport activity. In eight different experiments we observed a reduction of the transport activity of between 11 and 60%.
Table 2.
Influence of the ion composition on glutamine transport
| NaCl(mm) | Replacement salts(mm) | KCl | Transport activity (pmol glutamine(10 min)−1oocyte−1) |
|---|---|---|---|
| 82.5 | — | 2.5 | 78 ±11a |
| 0 | LiCl (82.5) | 2.5 | 51 ± 9a |
| 0 | Choline choride(82.5) | 2.5 | 4.4 ± 0.6a |
| 0 | Sodium gluconate(82.5) | 0 | 69 ± 12a |
| 82.5 | — | 0 | 99 ± 16b |
| 82.5 | — | 0.3 | 95 ± 18b |
| 82.5 | — | 1 | 100 ± 15b |
| 82.5 | — | 3 | 108 ± 16b |
| 82.5 | — | 10 | 88 ± 12b |
| 82.5 | — | 30 | 80 ± 14b |
Oocytes were injected with 20 ng SN1 cRNA or remained uninjected. After an expression period of 3 days uptake of [14C]glutamine (0.1 mm) was determined over an incubation period of 10 min in oocyte ringer OR2+ of the indicated modified ion composition. The table contains data from independent sets of experiments that are indicated by superscripts a and b. The transport activity of non-injected oocytes is already subtracted.
Determination of the Na+ cotransport and H+ antiport stoichiometry
The kinetic data described above suggested that the driving forces of Na+ and H+ are of similar capacity. However, the net cotransport stoichiometry of Na+ was difficult to derive under the experimental conditions as uptake and efflux of Na+ occurred at the same time. Moreover, uptake of glutamine depolarized oocytes (Fig. 4 and see below) suggesting a net transport of charges by SN1. To discriminate between an electroneutral 1Na+-glutamine cotransport-1H+ antiport and an electrogenic 2Na+- glutamine cotransport-1H+ antiport we determined the glutamine accumulation ratio in oocytes at different extracellular pH and intracellular Na+ concentrations. Glutamine uptake reached equilibrium after 2 h under most experimental conditions. When the extracellular pH was raised to pH 8.0 full equilibration could not be achieved within the experimental time (Fig. 7). To allow maximum accumulation we used an extracellular concentration of 10 μm glutamine (Fig. 7). We have shown recently that glutamine metabolism in oocytes is still negligible under these conditions (Bröer et al. 2000b). The accumulation ratios were calculated using a water accessible volume of 400 nl oocyte−1 (Stegen et al. 2000). We determined the equilibration level at different proton-motive forces by varying the extracellular pH and at different sodium electrochemical gradients by varying the intracellular Na+ concentration. We have recently shown that the intracellular pH of oocytes remains constant around pH 7.3 irrespective of the extracellular pH (Rahman et al. 1999). The intracellular Na+ concentration was adjusted by injection of concentrated NaCl solutions. The glutamine accumulation ratios determined under these conditions were in very good agreement with the electroneutral 1Na+-glutamine cotransport-1H+ antiport mechanism (Table 3). The exception was observed at pH 8.0 where the accumulation ratio fell short of the predicted value because the equilibration level was not reached after 2 h incubation.
Figure 7. Accumulation of glutamine at different extracellular pH values.
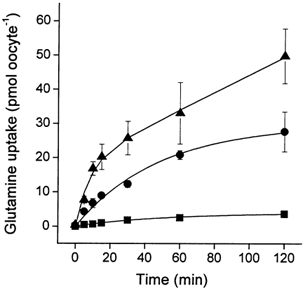
Oocytes were injected with 20 ng SN1 cRNA or remained uninjected. After an incubation period of 4 days, uptake of labelled glutamine (10 μm) was determined in transport buffers adjusted to pH 6.0 (filled squares), pH 7.0 (filled circles) or pH 8.0 (filled triangles). Samples were taken at the indicated time points. The transport activity of non-injected oocytes is already subtracted. The mean transport activity of 10 oocytes was determined for each datapoint. The glutamine accumulation of non-injected oocytes is already subtracted.
Table 3.
Accumulation of glutamine at different driving forces
| [Na+]o/[Na+]i | pHi/pHo | Accumulation (experimental) | Predicted accumulation 2 Na+/1 H+ | Predicted accumulation 1 Na+/1H+ |
|---|---|---|---|---|
| 85mm/5mm | 7.3/6 | 1 ± 0.1 | 70 | 0.85 |
| 85mm/5mm | 7.3/7 | 10.5 ± 2.0 | 704 | 8.5 |
| 85mm/5mm | 7.3/8 | 27 ± 4 | 7036 | 85 |
| 96mm/5mm | 7.3/7.3 | 10 ± 2.4 | 1790 | 19 |
| 96mm/10mm | 7.3/7.3 | 8 ± 1.6 | 448 | 9.6 |
| 96mm/30mm | 7.3/7.3 | 2.7 ± 0.4 | 50 | 3.2 |
| 96mm/100mm | 7.3/7.3 | 1.1 ± 0.4 | 5 | 1.0 |
Glutamine efflux depends on extracellular pH and the intracellular Na+ concentration
To determine whether the exchange of Na+ is tightly coupled to glutamine transport, we pre-injected oocytes with labelled glutamine (final concentration 1 mm) and determined the efflux of labelled glutamine at different extracellular pH values in the presence and absence of Na+ (Table 4 and Fig. 8).
Table 4.
Efflux of glutamine under different ion gradients
| [Na+]i/[Na+]o | pHi/pHo | Percentage efflux of preloaded glutamine | Significance | |
|---|---|---|---|---|
| 1 | 35mm/85mm | 7.3/5.0 | 81 ± 10 | n = 9 |
| 2 | 35mm/85mm | 7.3/6.0 | 83 ± 11 | n = 10 |
| 3 | 35mm/85mm | 7.3/8.0 | 74 ±5 | n = 10 |
| 4 | 35mm/85mm | 7.3/9.0 | 22 ± 6 | n = 7, P < 0.01 compared to lane 1, 2 or 3 |
| 5 | 5mm/85mm | 7.3/6.0 | 75 ± 11 | n = 7 |
| 6 | 5mm/85mm | 7.3/8.0 | 55 ± 4 | n = 8, P < 0.01 compared to lane 3 |
| 7 | 5mm/0mm | 7.3/5.0 | 82 ± 12 | n = 6 |
| 8 | 5mm/0mm | 7.3/6.0 | 70 ± 10 | n = 7 |
| 9 | 5mm/0mm | 7.3/8.0 | 86 ± 7 | n = 8 |
Oocytes were injected with 20ng SN1 cRNA or remained uninjected. After an expression period of 3 days oocytes were injected with [14C]glutamine at a final cytosolic concentration of 1mm or with [14C] glutamine plus NaCl at final concentrations of 1mm and 30mm, respectively. The intracellular Na+concentration under physiological conditions is 5mm, the intracellular pH is stable at 7.3. Oocytes were placed in multiwell plates, washed and subsequently suspended in 300μl transport buffer. After 30 min both the amount of released and intracellular [14C]glutamine were determined by liquid scintillation counting. Efflux in non-injected oocytes was less than 10% of efflux observed in SN1 expressing oocytes.
Figure 8. Efflux of glutamine at different extracellular pH values.
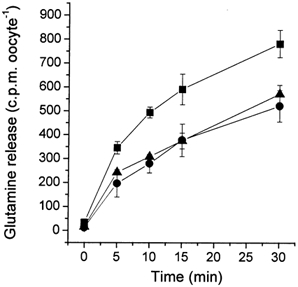
Oocytes were injected with 20 ng SN1 cRNA or remained uninjected. After an incubation period of 4 days, oocytes were injected with [14C]glutamine (final concentration 1 mm). Oocytes were washed with 4 ml ND96 buffer and then suspended in 1 ml transport buffer adjusted to pH 6.0 (filled squares), pH 7.0 (filled circles) or pH 8.0 (filled triangles). Samples were taken from the supernatant at the indicated time points. The mean efflux activity of four different experiments is shown in the graph. Efflux in non-injected oocytes was less than 10% of efflux observed in SN1 expressing oocytes.
Efflux depended only weakly on the extracellular pH or the presence and absence of Na+. We observed a slight increase of efflux at pH 6.0, which is in agreement with the pH-switch experiment described above (Fig. 8). We also observed a small but significant increase of efflux when the intracellular NaCl concentration was raised to 35 mm at extracellular pH 8.0. A significant drop of the efflux activity was observed when the experiment was performed at an extracellular pH 9.0 and at a physiological intracellular Na+ concentration of 5 mm (Table 4).
What generates currents during glutamine transport?
The accumulation ratios and static head experiments favoured an electroneutral transport mechanism. However, glutamine uptake was clearly accompanied by inward currents, that depolarized the oocytes (Fig. 4). To determine whether the glutamine-induced currents reflected a stoichiometric cotransport of charges we compared the depolarization of oocytes transporting glutamine via the glutamine transporter ATA1 with those expressing SN1. We have recently shown that ATA1 has a cotransport stoichiometry of 1Na+ per glutamine and that currents are generated largely by the flux of cotransported Na+ (Albers et al. 2001). If SN1 cotransported one net charge together with glutamine, both transporters should generate similar currents when fluxes of labelled glutamine were similar. At a concentration of 0.2 mm glutamine oocytes expressing ATA1 took up glutamine at a rate of 54 ± 5 pmol (5 min)−1, slightly less than oocytes expressing SN1 that took up glutamine at 83 ± 12 pmol (5 min)−1. To compare the electrogenicity of both transporters we used current clamp conditions as these are identical to the flux measurements. At a concentration of 0.2 mm glutamine, uptake via ATA1 significantly depolarized the membrane potential of oocytes (Fig. 9B) whereas in SN1-expressing oocytes uptake of glutamine was almost electroneutral (Fig. 9A). Only when the glutamine concentration was raised to 10 mm, where the Vmax of SN1 is reached, a significant depolarization occurred. Thus although both transporters were transporting similar amounts of glutamine, only ATA1 caused significant depolarization. Replacement of chloride ions with gluconate did not affect glutamine-induced currents indicating that the conductance was not permeable to chloride (data not shown). Currents reversed at slightly negative membrane potentials, indicating that they were not coupled to substrate transport (Fig. 10). The reversal potential changed by about 10 mV when the current-voltage relationship was analysed at two different pH values, indicating that protons may contribute to the observed current (Fig. 10).
Figure 9. Depolarization of the membrane potential during transport of glutamine via SN1 and ATA1.
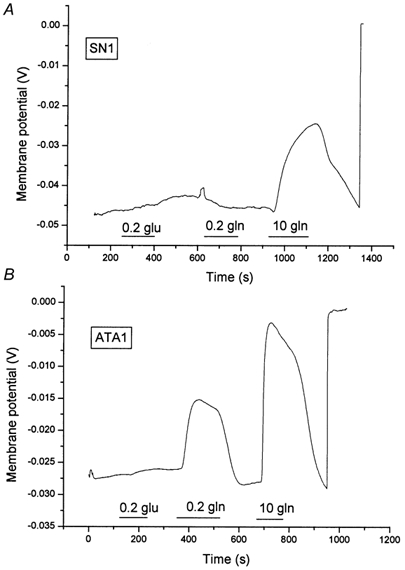
Oocytes were injected with 20 ng SN1 cRNA (A) or 20 ng ATA1 cRNA (B). After an incubation period of 4 days, oocytes were superfused with glutamine (0.2 mm and 10 mm) and glutamate containing solutions (0.2 mm). The membrane potential was recorded with microelectrodes. At the end of each recording microelectrodes were pulled out of the oocyte to record the bath potential. Superfusion periods are indicated by the horizontal bars. Non-injected oocytes did not respond to glutamate or glutamine.
Figure 10. Voltage dependence of glutamine-induced currents at different pH values.
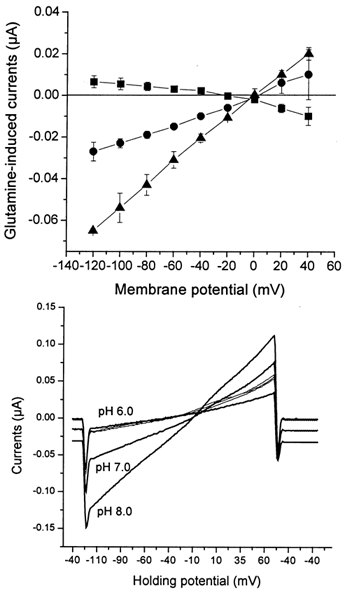
Oocytes were injected with 20 ng SN1 cRNA. After an expression period of 3 days oocytes were superfused with ND96 containing 10 mm glutamine or control solution (ND96) adjusted to pH 6.0 (filled squares), pH 7.0 (filled circles) and pH 8.0 (filled triangles). Once currents (in the absence or presence of substrate) remained stable, voltage ramps were run clamping the membrane potential from −120 mV to + 60 mV. The graph (upper panel) depicts the difference of the elicited currents in the presence and absence of substrate. The lower panel shows recordings from a representative oocyte. The thick lines show traces recorded in the presence of 10 mm glutamine (pH indicated to left), the thin traces were recorded in the absence of substrate. The holding potential during recording is given on the abscissa.
DISCUSSION
Two different mechanisms have been proposed for the glutamine transporter SN1. When expressed in mammalian cells which had an impaired regulation of the cytosolic pH, uptake of glutamine was found to cause an alkalization of the cytosolic pH. This suggested antiport of protons was occuring. As glutamine uptake was Na+ dependent and was not affected by addition of valinomycin to the cells, it was concluded that uptake of glutamine was accompanied by electroneutral Na+-H+ antiport (Chaudhry et al. 1999). Subsequently, the human SN1 was shown to cause currents when expressed in oocytes (Fei et al. 2000). Therefore, it was suggested that the mechanism of SN1 involved the electrogenic cotransport of 2Na+ ions rather than one. As the potassium concentration was not raised in the valinomycin experiment described above, the mammalian cells might not have been completely depolarized. This leaves open the possibility that transport via SN1 is indeed electrogenic.
In the context of the glutamate-glutamine cycle it is essential that glutamine can be released from astrocytes under physiological conditions. Assuming a 2 Na+-glutamine cotransport-1H+ antiport mechanism, SN1 would allow an about 1000-fold intracellular accumulation of glutamine, as calculated by the following formula:
The electroneutral mechanism
by contrast would generate only a 10-fold accumulation in the absence of a pH gradient, which is close to the prevalent gradient in the brain (Bröer & Brookes, 2001). In these equations [S], [Na+] and [H+] are the intracellular or extracellular concentrations of the substrate, Na+ and H+, respectively. R, T (in K), z and F have their usual meanings and ΔΨ is the membrane potential in volts.
Although we confirmed the presence of glutamine-induced inward currents in SN1-expressing oocytes, all flux measurements clearly support an electroneutral transport mechanism. First, acidification of the extracellular pH reverses the direction of transport. Secondly, accumulation ratios were in agreement with a 1Na+- glutamine cotransport-1H+ antiport. And thirdly, the observed inward currents were much smaller than the stoichiometric currents induced by ATA1, indicating the transfer of far less than one charge per substrate molecule. In fact, when determined at a glutamine concentration of 0.2 mm, SN1-mediated currents were negligible compared with ATA1-mediated currents, the latter being generated by a stoichiometric 1Na+-substrate cotransport (Albers et al. 2001). The almost perfect coincidence between predicted and experimentally determined accumulation ratios also indicates that the depolarization that does occur during glutamine transport does not appear to have a major influence on the transporter. A remarkable feature of the SN1 transporter is the strong Na+ exchange activity, that does not generate any currents. A model that can account for this, as well as all other observations, assumes binding of Na+ after the substrate molecule (Fig. 11). Thus, Na+ can exchange in the presence of substrate but not in its absence. This binding order also explains why preloading of cells with 10 mm glutamine for 10 min did not increase subsequent uptake of [14C]glutamine (trans-stimulation, data not shown) because Vmax is determined by Na+ binding. The Eadie-Hofstee transformation of the Na+ dependence indicates the presence of a high-affinity binding site on the transporter. At the prevalent Na+ concentrations this binding site would always be saturated and thus would not contribute to the electrochemical driving force. It could, however, be involved in Na+ exchange, similar to the situation observed in the ASCT2 transporter (Bröer et al. 2000a). The model also proposes a coupled H+ antiport. Although formally difficult to prove, this model is supported by the accumulation experiments, the drop of efflux velocity at pH > 8.0 and the alkalization of the cytosol during glutamine uptake. The extent of alkalization is in good agreement with the proposed stoichiometry. The observed changes of the intracellular pH are in the order of 0.1–0.2 pH units. We have recently shown that the buffering capacity at intracellular pH 7.0 is about 20 mm per pH unit (Bröer et al. 1998). Thus 0.1–0.2 pH units are equivalent to 2–4 mm substrate, which in turn is equivalent to an uptake of 0.8–1.6 nmol glutamine. At a glutamine concentration of 10 mm, which was used during the pH recordings, we measured uptake rates of about 1 nmol glutamine (10 min)−1 (for example see Table 1), which is in very good agreement with the time course of alkalization. The weak extracellular pH dependence of glutamine efflux between pH 5 and 8 indicates to us that the strong pH dependence of the influx is an allosteric effect on the transporter similar to that observed in oocytes expressing ATA1 (Albers et al. 2001). The drop of efflux activity at an extracellular pH 9.0 could reflect the catalytic pH dependence of the transporter. Thus, under physiological conditions it is the allosteric pH dependence that regulates the transporter, rather than the catalytic pH dependence.
Figure 11. A kinetic model of glutamine transport via SN1.
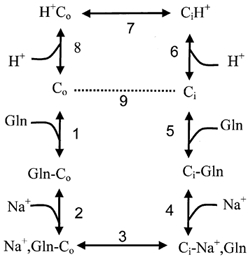
Experimental observations can be explained with an ordered binding model in which glutamine binds before Na+, allowing Na+ exchange (steps 2, 3 and 4). Slippage of the unloaded transporter (dotted line), creates an electrogenic transport mode that is similar to system A (steps 1, 2, 3, 4, 5 and 9). The normal transport cycle includes steps 1–8.
Two mechanisms can account for the inward currents that we and others observed during glutamine transport. One is a slippage mechanism in the transport cycle and the second is an activation of oocyte endogenous cation channels by intracellular pH. Since Na+ is suggested to bind after the substrate, there is no slippage of the Na+-loaded transporter as for example suggested for the glucose transporter SGLT1 (Mackenzie et al. 1998). Thus if slippage occurs it must be the empty carrier that returns without binding protons. The whole transport cycle would generate inward currents due to the influx of Na+ ions and the lack of proton efflux. This does not seem unlikely, because the slippage mode is nothing else than the mechanism of the related system A amino acid transporter (Reimer et al. 2000; Sugawara et al. 2000; Yao et al. 2000; Albers et al. 2001). This mode is also sensitive to depolarization which explains the small decrease of transport activity at increased potassium concentrations. The stronger inhibition that we observed in the presence of 50 mm KCl, is likely to result from a competition at the Na+-binding site that also recognizes other cations such as Li+. However, it is expected that currents generated by slippage do not reverse as they are substrate dependent. It is worth noting in this respect that asparagine-induced currents indeed did not show reversal at positive holding potentials (Fei et al. 2000) and that asparagine-induced alkalization is smaller than glutamine-induced alkalization (data not shown). The second scenario that could contribute to the observed currents is the activation of oocyte-endogenous channels by alkalization of the intracellular pH. In favour of this we found that first, substrate-induced currents varied from oocyte preparation to oocyte preparation, although substrate fluxes remained fairly constant. Secondly, injection of alkaline buffer into oocytes results in a complete depolarization of the membrane potential (data not shown). Thirdly, other pH changing electroneutral transporters, such as the 1H+- monocarboxylate cotransporter MCT1, also generate substrate-induced currents when expressed in oocytes (Bröer et al. 1998) and fourthly, the onset of the inward currents is rather slow compared to the rapid onset of substrate-induced currents in ATA1 expressing oocytes. Our experiments indicate that the currents are likely to be carried by cations. Currents remained unchanged when chloride was replaced by gluconate and are thus unlikely to be carried by anions. An increase of the potassium concentration from 0 to 30 mm decreased the inward currents slightly (data not shown). Changing the proton concentration altered the reversal potential of the currents by about 10 mV per pH unit. A participation of Na+ ions is difficult to prove because of the Na+ dependence of the transporter itself. We suggest that both slippage and oocyte endogenous channels contribute to the inward currents observed during glutamine transport.
In summary we found strong support for an electroneutral transport mechanism of SN1, in which glutamine uptake is coupled to a Na+-H+ exchange. Acidic extracellular pH and increased intracellular Na+ concentrations favour reversal of glutamine transport via SN1. Both parameters are thus likely to be significant regulators of glutamine uptake or efflux in the brain, liver and muscle.
Acknowledgments
This work was supported by start-up funds and an FRGS fund (F01049) of the Australian National University to S.B. and by grants of the Deutsche Forschungsgemeinschaft to S.B. (Br1318/2–4) and F.L. (La315/4–4). C.A.W. is a fellow of the Alexander von Humboldt foundation, Germany.
REFERENCES
- Albers A, Bröer A, Wagner CA, Setiawan I, Lang P, Kranz EU, Lang F, Bröer S. Na+ transport by the neural glutamine transporter ATA1. Pflügers Archiv. 2001;443:92–101. doi: 10.1007/s004240100663. [DOI] [PubMed] [Google Scholar]
- Bröer S, Brookes N. Transfer of glutamine between astrocytes and neurons. Journal of Neurochemistry. 2001;77:705–719. doi: 10.1046/j.1471-4159.2001.00322.x. [DOI] [PubMed] [Google Scholar]
- Bröer S, Schneider HP, Broer A, Rahman B, Hamprecht B, Deitmer JW. Characterization of the monocarboxylate transporter 1 expressed in Xenopus laevis oocytes by changes in cytosolic pH. Biochemical Journal. 1998;333:167–174. doi: 10.1042/bj3330167. [DOI] [PMC free article] [PubMed] [Google Scholar]
- Bröer A, Wagner C, Lang F, Bröer S. Neutral amino acid transporter ASCT2 displays substrate-induced Na+ exchange and a substrate-gated anion conductance. Biochemical Journal. 2000a;346:705–710. [PMC free article] [PubMed] [Google Scholar]
- Bröer A, Wagner C, Lang F, Bröer S. The heterodimeric amino acid transporter 4F2hc/y+LAT2 mediates arginine efflux in exchange with glutamine. Biochemical Journal. 2000b;349:787–795. doi: 10.1042/bj3490787. [DOI] [PMC free article] [PubMed] [Google Scholar]
- Chaudhry FA, Reimer RJ, Krizaj D, Barber D, Storm-Mathisen J, Copenhagen DR, Edwards RH. Molecular analysis of system N suggests novel physiological roles in nitrogen metabolism and synaptic transmission. Cell. 1999;99:769–780. doi: 10.1016/s0092-8674(00)81674-8. [DOI] [PubMed] [Google Scholar]
- Fei YJ, Sugawara M, Nakanishi T, Huang W, Wang H, Prasad PD, Leibach FH, Ganapathy V. Primary structure, genomic organization, and functional and electrogenic characteristics of human system N 1, a Na+- and H+-coupled glutamine transporter. Journal of Biological Chemistry. 2000;275:23707–23717. doi: 10.1074/jbc.M002282200. [DOI] [PubMed] [Google Scholar]
- Gu S, Roderick HL, Camacho P, Jiang JX. Identification and characterization of an amino acid transporter expressed differentially in liver. Proceedings of the National Academy of Sciences of the USA. 2000;97:3230–3235. doi: 10.1073/pnas.050318197. [DOI] [PMC free article] [PubMed] [Google Scholar]
- Häussinger D. Hepatic glutamine transport and metabolism. Advances in Enzymology and Related Areas of Molecular Biology. 1998;72:43–86. doi: 10.1002/9780470123188.ch3. [DOI] [PubMed] [Google Scholar]
- Heinz E. Mechanics and energetics of biological transport. In: Kleinzeller A, Springer GF, Wittman HG, editors. Molecular Biology, Biochemistry and Biophysics. Vol. 29. Berlin, Heidelberg, New York: Springer-Verlag; 1978. pp. 3–9. [DOI] [PubMed] [Google Scholar]
- Kilberg MS, Handlogten ME, Christensen HN. Characteristics of an amino acid transport system in rat liver for glutamine, asparagine, histidine, and closely related analogs. Journal of Biological Chemistry. 1980;255:4011–4019. [PubMed] [Google Scholar]
- Mackenzie B, Loo DD, Wright EM. Relationships between Na+/glucose cotransporter (SGLT1) currents and fluxes. Journal of Membrane Biology. 1998;162:101–106. doi: 10.1007/s002329900347. [DOI] [PubMed] [Google Scholar]
- Rahman B, Schneider HP, Broer A, Deitmer JW, Broer S. Helix 8 and helix 10 are involved in substrate recognition in the rat monocarboxylate transporter MCT1. Biochemistry. 1999;38:11577–11584. doi: 10.1021/bi990973f. [DOI] [PubMed] [Google Scholar]
- Reimer RJ, Chaudhry FA, Gray AT, Edwards RH. Amino acid transport system A resembles system N in sequence but differs in mechanism. Proceedings of the National Academy of Sciences of the USA. 2000;97:7715–7720. doi: 10.1073/pnas.140152797. [DOI] [PMC free article] [PubMed] [Google Scholar]
- Rennie MJ, Khogali SE, Low SY, McDowell HE, Hundal HS, Ahmed A, Taylor PM. Amino acid transport in heart and skeletal muscle and the functional consequences. Biochemical Society Transactions. 1996;24:869–873. doi: 10.1042/bst0240869. [DOI] [PubMed] [Google Scholar]
- Stegen C, Matskevich I, Wagner CA, Paulmichl M, Lang F, Bröer S. Swelling-induced taurine release without chloride channel activity in Xenopus laevis oocytes expressing anion channels and transporters. Biochimica et Biophysica Acta. 2000;1467:91–100. doi: 10.1016/s0005-2736(00)00209-1. [DOI] [PubMed] [Google Scholar]
- Sugawara M, Nakanishi T, Fei YJ, Huang W, Ganapathy ME, Leibach FH, Ganapathy V. Cloning of an amino acid transporter with functional characteristics and tissue expression pattern identical to that of system A. Journal of Biological Chemistry. 2000;275:16473–16477. doi: 10.1074/jbc.C000205200. [DOI] [PubMed] [Google Scholar]
- Wagner CA, Friedrich B, Setiawan I, Lang F, Bröer S. The use of Xenopus laevis oocytes for the functional characterization of heterologously expressed membrane proteins. Cellular Physiology and Biochemistry. 2000;10:1–12. doi: 10.1159/000016341. [DOI] [PubMed] [Google Scholar]
- Yao D, Mackenzie B, Ming H, Varoqui H, Zhu H, Hediger MA, Erickson JD. A novel system A isoform mediating Na+/neutral amino acid cotransport. Journal of Biological Chemistry. 2000;275:22790–22797. doi: 10.1074/jbc.M002965200. [DOI] [PubMed] [Google Scholar]