

Abstract
To examine possible interactions between fast depression and modulation of inhibitory synaptic transmission in the hippocampus, we recorded from pairs of synaptically connected basket cells (BCs) and granule cells (GCs) in the dentate gyrus of rat brain slices at 34 °C. Multiple-pulse depression (MPD) was examined in trains of 5 or 10 inhibitory postsynaptic currents (IPSCs) evoked at frequencies of 10–00 Hz under several conditions that inhibit transmitter release: block of voltage-dependent Ca2+ channels by Cd2+ (10 μm), activation of γ-amino-butyric acid type B receptors (GABABRs) by baclofen (10 μm) and activation of muscarinic acetylcholine receptors (mAchRs) by carbachol (2 μm). All manipulations led to a substantial inhibition of synaptic transmission, reducing the amplitude of the first IPSC in the train (IPSC1) by 72 %, 61 % and 29 %, respectively. However, MPD was largely preserved under these conditions (0.34 in control versus 0.31, 0.50 and 0.47 in the respective conditions at 50 Hz). Similarly, a theta burst stimulation (TBS) protocol reduced IPSC1 by 54 %, but left MPD unchanged (0.40 in control and 0.39 during TBS). Analysis of both fractions of transmission failures and coefficients of variation (CV) of IPSC peak amplitudes suggested that MPD had a presynaptic expression site, independent of release probability. In conclusion, different types of presynaptic modulation of inhibitory synaptic transmission converge on a reduction of synaptic strength, while short-term dynamics are largely unchanged.
The dynamic properties of synaptic transmission are of critical importance for information processing in neuronal networks (O'Donovan & Rinzel, 1997). Short-term depression during repetitive activation confers low-pass filtering properties to synapses and makes postsynaptic target cells sensitive to changes in activity. In contrast, facilitation conveys high-pass filtering properties and sensitivity to mean firing rates (O'Donovan & Rinzel, 1997). At glutamatergic synapses in the neocortex, short-term dynamics and long-term regulation of synaptic transmission appear to be highly interrelated. For example, induction of long-term potentiation leads to an increase in rate and extent of short-term depression, resulting in a ‘redistribution’ of synaptic efficacy within a train of synaptic events (Markram & Tsodyks, 1996; Abott et al. 1997; but see Selig et al. 1999). Thus long-term regulation of synaptic transmission may change the signal content, but not the gain (Markram & Tsodyks, 1996). Whether similar rules of synaptic modification apply to other synapses, however, has remained uncertain.
The mechanisms leading to short-term facilitation (Salin et al. 1996; Dobrunz & Stevens, 1997) and depression (Davies et al. 1990; Lambert & Wilson, 1994; Galarreta & Hestrin, 1998; Bellingham & Walmsley, 1999; Kraushaar & Jonas, 2000; Bartos et al. 2001) at central synapses are diverse. Facilitation has been mainly attributed to an increase in the resting Ca2+ concentration in synaptic terminals (Neher, 1998). In contrast, depression has been interpreted as activation of presynaptic autoreceptors (Davies et al. 1990), depletion of the readily releasable pool of synaptic vesicles (Debanne et al. 1996; Dobrunz & Stevens, 1997), or desensitization of postsynaptic receptors (Jones & Westbrook, 1995). As depression caused by all of these mechanisms is dependent on previous release, manipulations that reduce release probability are expected to decrease the amount of depression, thereby uncovering facilitation.
Recent studies have suggested that short-term depression is release-independent at some synapses, suggesting that it is mediated by a ‘gating mechanism’ or ‘refractoriness’ rather than autoreceptor activation, depletion, or desensitization (Brody & Yue, 2000b; Waldeck et al. 2000; Kraushaar & Jonas, 2000; Kim & Alger, 2001). At the BC- GC synapse in the hippocampus, short-term depression consists of a fast, release-independent and a slow, release-dependent component, which can be distinguished by changing the external Ca2+/Mg2+ concentration ratio (Kraushaar & Jonas, 2000). However, it has remained unclear whether fast depression is generally independent of release probability, under various conditions that modulate release. We therefore tested the effects of blocking presynaptic Ca2+ channels, activating presynaptic receptors and theta burst stimulation. To maximize the extent of fast depression, high-frequency trains of multiple stimuli were used.
METHODS
Paired recordings from synaptically connected basket cells and granule cells
Paired recordings from synaptically connected BCs and GCs in the dentate gyrus were made as described previously (Geiger et al. 1997; Kraushaar & Jonas, 2000; Bartos et al. 2001; also see Miles & Wong, 1984). This approach avoided the complicating influence of stimulation of multiple presynaptic cells and potential problems of heterogeneity of presynaptic interneurons. In brief, transverse hippocampal slices (300 μm thickness) were cut from brains of 20- to 24-day-old Wistar rats using a vibratome (DTK-1000, Dosaka, Kyoto, Japan). Animals were killed by rapid decapitation without anaesthesia, in accordance with national and institutional guidelines. Experiments were approved by the animal care committee Freiburg according to paragraph 15 of the Tierschutzgesetz (Az 142Z). Infrared differential interference contrast videomicroscopy was used for visual identification of cells. BCs were selected on the basis of location and fast-spiking (> 200 Hz) as described previously (Kraushaar & Jonas, 2000). Pairs were only accepted when the resting potentials were more negative than −55 mV for BCs and −75 mV for GCs. The recording temperature was 34 ± 2 °C.
Two Axopatch 200A amplifiers (Axon Instruments, Foster City, CA, USA) were used for recording. Presynaptic action potentials were evoked by brief current pulses applied at a frequency of 0.17 Hz, unless specified differently. IPSCs were recorded in the voltage-clamp mode (holding potential −70 or −80 mV) using series resistance (RS) compensation (65–0 %, lag 10–00 μs; RS before compensation 5–20 MΩ). In the majority of experiments, signals were filtered at 5 kHz and digitized at 10 kHz, using a 1401plus interface (Cambridge Electronic Design, CED, Cambridge, UK).
Solutions and chemicals
The physiological extracellular solution contained (mm): 125 NaCl, 25 NaHCO3, 25 glucose, 2.5 KCl, 1.25 NaH2PO4, 2 CaCl2, and 1 MgCl2 (bubbled with 95 % O2-5 % CO2). Slices were stored in a solution containing (mm): 87 NaCl, 25 NaHCO3, 2.5 KCl, 1.25 NaH2PO4, 0.5 CaCl2, 7 MgCl2, 25 glucose, and 75 sucrose. The intracellular solution used for the presynaptic BC contained (mm): 135 potassium gluconate, 20 KCl, 0.1 EGTA, 2 MgCl2, 2 Na2ATP, 10 Hepes, and 0.1 % or 0.2 % biocytin. The intracellular solution used for the postsynaptic GC contained (in mm) 100 KCl, 35 potassium gluconate, 10 EGTA, 2 MgCl2, 2 Na2ATP, and 10 Hepes. In some experiments a solution containing (mm): 145 KCl, 0.1 EGTA, 2 MgCl2, 2 Na2ATP, and 10 Hepes was used for both pre- and postsynaptic cells. In all internal solutions, pH was adjusted to 7.2 with KOH and osmolarity was adjusted to 310–20 mosmol l−1 by sucrose. Baclofen and carbachol were applied at concentrations of 10 μm and 2 μm, respectively, close to saturating concentrations (S. Hefft, unpublished results). Baclofen and carbachol were obtained from Sigma, biocytin was from Molecular Probes, other chemicals were from Merck, Sigma, Riedel-de Haën, or Gerbu.
Data analysis
To avoid spurious facilitation due to random response fluctuations (Kim & Alger, 2001), MPD was calculated from average IPSCs. 20–80 traces were averaged (failures included) and IPSC amplitudes were measured as differences between peak amplitudes and baselines preceding the rising phases. Coefficients of variation (CV, standard deviation/mean) of unitary IPSC peak amplitudes were calculated from 301–0 traces during stationary periods (failures included, no correction for baseline noise). Values are given as mean ± s.e.m. Error bars in figures also indicate s.e.m. values. Significance of differences was assessed by a two-sided Wilcoxon signed rank test or a Kruskal-Wallis test at the significance level (P) indicated.
Morphological analysis
The morphological identity of presynaptic BCs was examined as described previously, staining biocytin-filled neurons by either 3,3′-diaminobenzidine (Bartos et al. 2001) or fluorescein-conjugated avidin (Koh et al. 1995). Data included in this paper were obtained from 61 pairs. In 18 of 19 sufficiently stained pairs, the axons of the presynaptic neurons were largely confined to the granule cell layer, identifying the presynaptic neurons as BCs.
RESULTS
Multiple-pulse depression is preserved during block of voltage-gated Ca2+ channels
Figure 1 shows the effects of Cd2+, a blocker of voltage-gated Ca2+ channels, on MPD. Cd2+ (10 μm) reversibly reduced the peak amplitude of the first unitary IPSC (IPSC1) by 72 ± 9 % (Fig. 1A and B). However, the time course and extent of MPD were largely unaffected. For 50-Hz trains the extent of MPD, quantitated as the ratio IPSC10/IPSC1, was 0.36 ± 0.03 in control and 0.31 ± 0.06 in the presence of 10 μm Cd2+ (Fig. 1C), not significantly different between the two conditions (P = 0.69). To examine a possible frequency dependence of the effects of Cd2+ on MPD, 10- or 100-Hz trains were applied (not illustrated). For 10-Hz stimulation, MPD was less pronounced than for 100-Hz stimulation, but there was no significant difference between control and Cd2+ (IPSC10/IPSC1 = 0.48 ± 0.05 in control versus 0.50 ± 0.08 in Cd2+; P = 0.69). For 100-Hz stimulation, however, MPD was more pronounced and slightly smaller in Cd2+ than in control (IPSC10/IPSC1 = 0.25 ± 0.07 in control versus 0.38 ± 0.09 in Cd2+; P = 0.03). In conclusion, these results indicate that block of voltage-gated Ca2+ channels reduces IPSC1 substantially, but leaves MPD largely unaffected, resulting in a scaling of IPSC amplitudes within the train.
Figure 1. Effects of Cd2+ on release and MPD at the BC-GC synapse.

A, train of presynaptic action potentials evoked by brief current pulses (top trace) and corresponding average IPSCs (bottom traces) in control, in the presence of 10 μm Cd2+ and after wash. Lowermost traces show the first and the last IPSC of the train in control and Cd2+ on an expanded time scale, superimposed after normalization of IPSC1 to the same peak amplitude. Average IPSCs were obtained from 50 individual sweeps. B, plot of peak amplitude of first IPSC (IPSC1; single traces) against time during Cd2+ application. Same pair as in A. C, mean ratio of IPSCn/IPSC1, plotted against the number within the train (n). ○, data in control; •, data in 10 μm Cd2+; □, data after wash (all normalized to IPSC1 in control). ▪, data in 10 μm Cd2+ (normalized to IPSC1 in Cd2+). The stimulation frequency during the train was 50 Hz in all experiments. Curves represent exponential fits to control data points (continuous; τ= 25 ms, offset 0.34) and data points in Cd2+ (dashed; τ= 20 ms, offset 0.29). Data from 7 (control), 7 (10 μm Cd2+) and 6 pairs (wash).
MPD is preserved in the presence of two modulators of inhibitory synaptic transmission
Previous studies have suggested that activation of presynaptic receptors shifts depression towards facilitation at some synapses (Davies et al. 1990; Brenowitz et al. 1998; Jensen et al. 2000). We therefore tested a variety of agonists of presynaptic receptors, which were shown to modulate release at other synapses (Fig. 2). The GABABR agonist baclofen, applied at a saturating concentration (10 μm), reduced IPSC1 reversibly by 61 ± 9 % (Fig. 2A). Similarly, the mAChR agonist carbachol, also applied at a saturating concentration (2 μm), reduced IPSC1 by 29 ± 8 % (Fig. 2C). In contrast, the mGluR1 agonist quisqualate (1 μm), the mGluR2 agonist DCG-4 (2 μm), the mGluR3 agonist L-AP4 (10 μm) and the GluR5 kainate receptor agonist ATPA (1 μm) had no significant effects on the amplitudes of evoked IPSCs in BC-GC pairs (< 13 % change; P > 0.2 in all cases). This suggests that synaptic transmission at the BC-GC synapse is regulated primarily by the fast transmitter GABA itself and by the neuromodulator ACh.
Figure 2. MPD is largely preserved during activation of GABABRs and mAChRs.

A, train of presynaptic action potentials evoked by brief current pulses (top trace) and corresponding average IPSCs (bottom traces) in control, in the presence of 10 μm baclofen and after wash. Average IPSCs were obtained from 50 individual sweeps. B, mean ratio of IPSCn/IPSC1, plotted against the number within the train (n). ○, data in control; •, data in 10 μm baclofen; □, data after wash (all normalized to IPSC1 in control). ▪, data in 10 μm baclofen (normalized to IPSC1 in baclofen). Curves represent exponential fits to control data points (continuous; τ= 28 ms, offset 0.31) and data points in baclofen (dashed; τ= 41 ms, offset 0.50). Data from 7 (control), 7 (10 μm baclofen) and 4 pairs (wash). C and D, data similar to those shown in A and B, with 2 μm carbachol instead of baclofen. Curves represent exponential fits to control data points (continuous; τ= 34 ms, offset 0.38) and data points in carbachol (dashed; τ= 37 ms, offset 0.50). Data from 8 pairs. The stimulation frequency during the train was 50 Hz in all experiments.
To investigate possible interactions between fast depression and the degree of inhibition of unitary IPSCs by neuromodulators, we compared MPD in the presence of 10 μm baclofen and 2 μm carbachol, respectively, with MPD in control in the same pairs (Fig. 2B, D). Although both neuromodulators reduced the amplitude of IPSC1 significantly, MPD persisted in both conditions. However, in comparison to the effects of Cd2+, the effects of baclofen and carbachol on MPD appeared to be slightly different. For 50-Hz trains, the IPSC10/IPSC1 ratio in 10 μm baclofen was 0.50 ± 0.08, significantly larger than IPSC10/IPSC1 in control (0.27 ± 0.02, P = 0.02). Similarly, in 2 μm carbachol the IPSC10/IPSC1 ratio was 0.47 ± 0.05, slightly larger than IPSC10/IPSC1 in control of the same pairs (0.37 ± 0.04, P = 0.05). To examine the frequency-dependence of the baclofen effects on MPD, we also applied 10- or 100-Hz trains (not illustrated). For 10-Hz stimulation, MPD was not significantly different between control and baclofen (IPSC10/IPSC1 = 0.44 ± 0.04 in control versus 0.48 ± 0.03 in baclofen; P = 0.31). For 100-Hz stimulation, however, MPD was markedly smaller in baclofen than in control (IPSC10/IPSC1 = 0.24 ± 0.03 in control versus 0.51 ± 0.10 in baclofen; P = 0.004). In conclusion, these results indicate that the phenomenon of MPD persists, but its extent is slightly reduced in the presence of both modulators.
MPD is independent of slow depression induced by a theta burst stimulation protocol
Next, we tested the effects of a TBS protocol (Fig. 3), which mimics activity patterns of BCs in vivo during exploration (Ylinen et al. 1995) and allows us to examine possible effects of slow depression on MPD at the BC-GC synapse (Kraushaar & Jonas, 2000). TBS (5 stimuli at 100 Hz, applied at a frequency of 4 Hz for 30 s) resulted in a marked decrease of IPSC1, consisting of a fast (almost instantaneous) and a slow component. At the end of the TBS period, IPSC1 was inhibited by 54 ± 5 % (Fig. 3B and C). Figure 3D compares MPD in the control epoch, in the TBS period and during recovery. The time course and extent of MPD were very similar during all periods. The ratio IPSC5/IPSC1 was 0.40 ± 0.05 during control, 0.47 ± 0.04 at the beginning and 0.39 ± 0.06 at the end of the TBS period (see Fig. 3C), without any significant differences among the periods (P = 0.30). These results suggest that slow depression induced by TBS results in a scaling of IPSC amplitudes within the train.
Figure 3. MPD is preserved during slow depression induced by repetitive patterned stimulation.
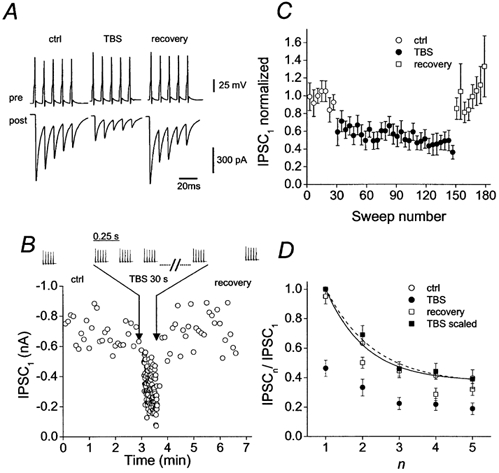
A, train of presynaptic action potentials evoked by brief current pulses (top traces) and corresponding average IPSCs (bottom traces) in control (ctrl), in the late phase of slow depression (TBS) and after recovery from slow depression (recovery). Average IPSCs were obtained from 30, 30 and 20 individual sweeps, respectively. B, plot of peak amplitude of first IPSC (IPSC1; single traces) against time. Traces show presynaptic action potentials, with TBS period indicated between arrows. Trains of action potentials (5 stimuli at 100 Hz) were applied at a frequency of 0.17 Hz or 0.2 Hz (ctrl and recovery) and 4 Hz (TBS). Data in A and B were from the same pair. C, plot of IPSC1 against sweep number. Each point represents the mean peak amplitude of 4 consecutive traces, averaged over ten pairs. D, mean ratio of IPSCn/IPSC1, plotted against the number within the train (n). Symbol code for C and D: ○, data in control; •, data during slow depression (last 30 sweeps of TBS period); □, data after recovery from slow depression (last 20 sweeps; all normalized to IPSC1 in control). ▪, data during slow depression (normalized to IPSC1 during slow depression). Curves represent exponential functions fitted to control data points (continuous; τ= 11 ms, offset 0.38) and data points during slow depression (dashed; τ= 13 ms, offset 0.36). Data from 10 pairs.
MPD and scaling have presynaptic sites of expression
To determine the site of inhibition of IPSC1 by Cd2+, baclofen, carbachol and slow depression induced by TBS, we analysed the fractions of failures and the coefficients of variation of peak amplitudes of IPSC1 at the BC-GC synapse (Fig. 4A and B; Kraushaar & Jonas, 2000). In all conditions, the fraction of failures increased reversibly (Fig. 4A; P < 0.05 for Cd2+ and baclofen). Likewise, a plot of CV−2 against the mean of IPSC1, both normalized to the corresponding control values, suggested a presynaptic site of inhibition (Fig. 4B). Thus, all manipulations appear to converge on a presynaptic locus.
Figure 4. Both MPD and modulation appear to be expressed presynaptically.
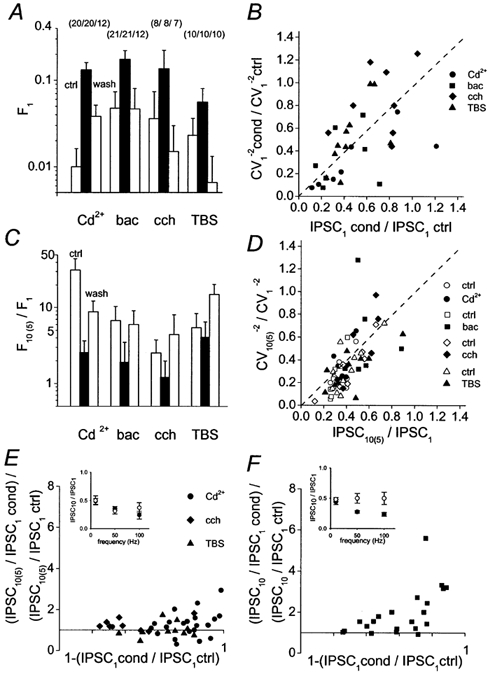
A, mean fraction of failures during the first stimulus (F1) in 10 μm Cd2+, 10 μm baclofen, 2 μm carbachol and during slow depression induced by TBS. Open bars on the left represent control, filled bars in the centre the respective condition, and open bars on the right wash or recovery. Numbers of pairs indicated in parentheses. B, coefficient of variation of IPSC1 raised to power −2, plotted against mean peak amplitude of IPSC1 in the same conditions as in A, both normalized to the respective control values. •, 10 μm Cd2+; ▪, 10 μm baclofen; ♦, 2 μm carbachol; ▴, during TBS. Dashed line indicates identity line. C, mean ratio of fraction of failures during tenth or fifth stimulus (F10(5)) over mean fraction of failures during first stimulus (F1). A binomial model of release with release probability of 0.53 in control and 5 release sites (Kraushaar & Jonas, 2000) predicts the following F10(5)/F1 ratios: 15.1, 20.1, 14.6 and 13.2 for control and 1.7, 2.4, 5.0 and 2.4 for condition, respectively, in approximate agreement with the data. D, coefficient of variation of IPSC10(5) raised to power −2, plotted against mean peak amplitude of IPSC10(5) in the same conditions as in A, both normalized to the respective values for IPSC1. Open symbols, data in control; filled symbols, data in the corresponding condition (•, 10 μm Cd2+; ▪, 10 μm baclofen; ♦, 2 μm carbachol; ▴, during TBS; one data point for carbachol with CV ratio > 1.4 not depicted). E and F, plot of MPD depression ratio [(IPSC10(5)/IPSC1) in condition/(IPSC10(5)/IPSC1) in control] against the extent of inhibition [1 - (IPSC1 in condition/IPSC1 in control)] by Cd2+ (10–5 μm, 23 pairs), carbachol (2 μm, 8 pairs), TBS (10 pairs) (E) and baclofen (10 μm, 22 pairs; one data point with amplitude increase in baclofen not depicted) (F). Insets in E and F indicate the frequency dependence of MPD in control, Cd2+ (E) and baclofen (F). Stimulation frequency during the train 50 Hz (B, C, D) and 10, 50 and 100 Hz (A, E, F).
To examine the site of expression of MPD, we analysed the ratio of fractions of failures for the last and the first stimulus within a train (F10/F1 or F5/F1) in control, in a given condition and after recovery. In all conditions including control, F10 or F5 was significantly larger than F1 (P < 0.05 in all conditions except in carbachol), implying a presynaptic mechanism of MPD (Fig. 4C). Additionally, a plot of CV−2 against the mean of IPSC10 or IPSC5, both normalized to the corresponding values of IPSC1, was consistent with a presynaptic site of expression of MPD (Fig. 4D).
To analyse the observed subtle differences among Cd2+, baclofen, carbachol and TBS, we plotted the ratio of MPD in these conditions to that in control against inhibition of IPSC1 (Fig. 4E and F; 10-, 50- and 100-Hz stimulation). Rank correlation analysis revealed no significant correlation between these two parameters for Cd2+, carbachol and TBS (Fig. 4E; P > 0.1), whereas a significant positive correlation was found for baclofen (Fig. 4F; P < 0.01). Furthermore, plots of depression ratios against stimulation frequency in Cd2+ and baclofen revealed that the frequency dependencies of the effects were clearly different (Fig. 4E and F, insets). Thus, although all types of suppression of inhibition converge on a presynaptic scaling of IPSC amplitudes, slight differences between conditions are apparent.
DISCUSSION
The present results shed light on both the mechanisms of fast depression at inhibitory synapses and the role of inhibition during dynamic changes of activity in neuronal networks.
Two major lines of evidence suggest that a simple, use-dependent model of depression (e.g. a model based on depletion of a releasable pool of vesicles) cannot be applied to the BC-GC synapse. First, the use-dependent model of depression implies that a decrease of release probability should lead to a consistent increase in paired-pulse ratio. In contrast, we find that fast depression is largely preserved during various conditions that reduce release probability (reduction of Ca2+/Mg2+ concentration ratio; Kraushaar & Jonas, 2000; Cd2+, baclofen, carbachol and TBS; this paper). Second, the use-dependent model of depression implies a correlation between IPSC2 and IPSC1 in individual traces, which is not observed experimentally (Kraushaar & Jonas, 2000). In contrast, the present results are consistent with the hypothesis that fast depression is generated by an activity-dependent, release-independent process (‘gating’ or ‘refractoriness’; Kraushaar & Jonas, 2000; Waldeck et al. 2000; Kim & Alger, 2001).
While the dynamic properties of the BC-GC synapse differ clearly from those of many excitatory (Markram & Tsodyks, 1996; Dobrunz & Stevens, 1997; Brenowitz et al. 1998) and some inhibitory synapses (Jensen et al. 1999; 2000), a minimal use dependence was observed at high stimulation frequencies, especially for baclofen (Fig. 4F). This may be explained by the mechanisms of action of baclofen. Baclofen is thought to suppress transmitter release by G-protein-mediated inhibition of presynaptic Ca2+ channels. High-frequency stimulation may lead to a relief from G-protein-mediated inhibition, which will reduce the apparent extent of depression (Park & Dunlap, 1998; Brody & Yue, 2000a).
In vivo, BCs generate high-frequency trains of spikes in a theta-modulated manner during exploratory activity (Ylinen et al. 1995). Due to depression of BC output, inhibition will be large at the beginning and reduced at the end of each train. As spiking of interneurons precedes that of principal neurons (Skaggs et al. 1996), depression of the interneuron output may influence timing and number of action potentials generated in principal neurons during the positive phase of each theta cycle. Therefore, depression of inhibition could influence phase precession of spike activity as the animal passes through a principal neuron's place field (O'Keefe & Recce, 1993). Thus, the specific properties of depression of inhibition may be important for temporal encoding of space in the hippocampal principal neuron-interneuron network (McBain & Fisahn, 2001). The presynaptic scaling reported here implies that important functions of depression in the network are preserved, even if inhibition is downregulated during various neuromodulatory states.
Acknowledgments
We thank Drs M. Bartos, J. Bischofberger, M. Heckmann and I. Vida for critically reading the manuscript, Dr K. Götz for providing information about pharmacological properties of inhibitory hippocampal synapses, and A. Blomenkamp and K. Winterhalter for technical assistance. This work was supported by Deutsche Forschungsgemeinschaft grants to P.J. (Jo-248/2–2; SFB 505/C5) and the Alexander-von-Humboldt foundation.
REFERENCES
- Abott LF, Varela JA, Sen K, Nelson SB. Synaptic depression and cortical gain control. Science. 1997;275:220–224. doi: 10.1126/science.275.5297.221. [DOI] [PubMed] [Google Scholar]
- Bartos M, Vida I, Frotscher M, Geiger JRP, Jonas P. Rapid signaling at inhibitory synapses in a dentate gyrus interneuron network. Journal of Neuroscience. 2001;21:2687–2698. doi: 10.1523/JNEUROSCI.21-08-02687.2001. [DOI] [PMC free article] [PubMed] [Google Scholar]
- Bellingham MC, Walmsley B. A novel presynaptic inhibitory mechanism underlies paired pulse depression at a fast central synapse. Neuron. 1999;23:159–170. doi: 10.1016/s0896-6273(00)80762-x. [DOI] [PubMed] [Google Scholar]
- Brenowitz S, David J, Trussell L. Enhancement of synaptic efficacy by presynaptic GABAB receptors. Neuron. 1998;20:135–141. doi: 10.1016/s0896-6273(00)80441-9. [DOI] [PubMed] [Google Scholar]
- Brody DL, Yue DT. Relief of G-protein inhibition of calcium channels and short-term synaptic facilitation in cultured hippocampal neurons. Journal of Neuroscience. 2000a;20:889–898. doi: 10.1523/JNEUROSCI.20-03-00889.2000. [DOI] [PMC free article] [PubMed] [Google Scholar]
- Brody DL, Yue DT. Release-independent short-term synaptic depression in cultured hippocampal neurons. Journal of Neuroscience. 2000b;20:2480–2494. doi: 10.1523/JNEUROSCI.20-07-02480.2000. [DOI] [PMC free article] [PubMed] [Google Scholar]
- Davies CH, Davies SN, Collingridge GL. Paired-pulse depression of monosynaptic GABA-mediated inhibitory postsynaptic responses in rat hippocampus. Journal of Physiology. 1990;424:513–531. doi: 10.1113/jphysiol.1990.sp018080. [DOI] [PMC free article] [PubMed] [Google Scholar]
- Debanne D, Guérineau NC, Gähwiler BH, Thompson SM. Paired-pulse facilitation and depression at unitary synapses in rat hippocampus: quantal fluctuation affects subsequent release. Journal of Physiology. 1996;491:163–176. doi: 10.1113/jphysiol.1996.sp021204. [DOI] [PMC free article] [PubMed] [Google Scholar]
- Dobrunz LE, Stevens CF. Heterogeneity of release probability, facilitation, and depletion at central synapses. Neuron. 1997;18:995–1008. doi: 10.1016/s0896-6273(00)80338-4. [DOI] [PubMed] [Google Scholar]
- Galarreta M, Hestrin S. Frequency-dependent synaptic depression and the balance of excitation and inhibition in the neocortex. Nature Neuroscience. 1998;1:587–594. doi: 10.1038/2822. [DOI] [PubMed] [Google Scholar]
- Geiger JRP, Lübke J, Roth A, Frotscher M, Jonas P. Submillisecond AMPA receptor-mediated signaling at a principal neuron-interneuron synapse. Neuron. 1997;18:1009–1023. doi: 10.1016/s0896-6273(00)80339-6. [DOI] [PubMed] [Google Scholar]
- Jensen K, Lambert JDC, Jensen MS. Activity-dependent depression of GABAergic IPSCs in cultured hippocampal neurons. Journal of Neurophysiology. 1999;82:42–49. doi: 10.1152/jn.1999.82.1.42. [DOI] [PubMed] [Google Scholar]
- Jensen K, Lambert JDC, Jensen MS. The effect of internal GTP γS on GABA-release in cultured hippocampal neurons. Experimental Brain Research. 2000;134:204–211. doi: 10.1007/s002210000447. [DOI] [PubMed] [Google Scholar]
- Jones MV, Westbrook GL. Desensitized states prolong the GABAA channel responses to brief agonist pulses. Neuron. 1995;15:181–191. doi: 10.1016/0896-6273(95)90075-6. [DOI] [PubMed] [Google Scholar]
- Kim J, Alger BE. Random response fluctuations lead to spurious paired-pulse facilitation. Journal of Neuroscience. 2001;21:9608–9618. doi: 10.1523/JNEUROSCI.21-24-09608.2001. [DOI] [PMC free article] [PubMed] [Google Scholar]
- Koh D-S, Geiger JRP, Jonas P, Sakmann B. Ca2+-permeable AMPA and NMDA receptor channels in basket cells of rat hippocampal dentate gyrus. Journal of Physiology. 1995;485:383–402. doi: 10.1113/jphysiol.1995.sp020737. [DOI] [PMC free article] [PubMed] [Google Scholar]
- Kraushaar U, Jonas P. Efficacy and stability of quantal GABA release at a hippocampal interneuron-principal neuron synapse. Journal of Neuroscience. 2000;20:5594–5607. doi: 10.1523/JNEUROSCI.20-15-05594.2000. [DOI] [PMC free article] [PubMed] [Google Scholar]
- Lambert NA, Wilson WA. Temporally distinct mechanisms of use-dependent depression at inhibitory synapses in the rat hippocampus in vitro. Journal of Neurophysiology. 1994;72:121–130. doi: 10.1152/jn.1994.72.1.121. [DOI] [PubMed] [Google Scholar]
- McBain CJ, Fisahn A. Interneurons unbound. Nature Reviews Neuroscience. 2001;2:11–23. doi: 10.1038/35049047. [DOI] [PubMed] [Google Scholar]
- Markram H, Tsodyks M. Redistribution of synaptic efficacy between neocortical pyramidal neurons. Nature. 1996;382:807–810. doi: 10.1038/382807a0. [DOI] [PubMed] [Google Scholar]
- Miles R, Wong RKS. Unitary inhibitory synaptic potentials in the guinea-pig hippocampus in vitro. Journal of Physiology. 1984;356:97–113. doi: 10.1113/jphysiol.1984.sp015455. [DOI] [PMC free article] [PubMed] [Google Scholar]
- Neher E. Vesicle pools and Ca2+ microdomains: New tools for understanding their roles in neurotransmitter release. Neuron. 1998;20:389–399. doi: 10.1016/s0896-6273(00)80983-6. [DOI] [PubMed] [Google Scholar]
- O'Donovan MJ, Rinzel J. Synaptic depression: a dynamic regulator of synaptic communication with varied functional roles. Trends in Neurosciences. 1997;20:431–433. doi: 10.1016/s0166-2236(97)01124-7. [DOI] [PubMed] [Google Scholar]
- O'Keefe J, Recce ML. Phase relationship between hippocampal place units and the EEG theta rhythm. Hippocampus. 1993;3:317–330. doi: 10.1002/hipo.450030307. [DOI] [PubMed] [Google Scholar]
- Park D, Dunlap K. Dynamic regulation of calcium influx by G-proteins, action potential waveform, and neuronal firing frequency. Journal of Neuroscience. 1998;18:6757–6766. doi: 10.1523/JNEUROSCI.18-17-06757.1998. [DOI] [PMC free article] [PubMed] [Google Scholar]
- Salin PA, Scanziani M, Malenka RC, Nicoll RA. Distinct short-term plasticity at two excitatory synapses in the hippocampus. Proceedings of the National Academy of Sciences of the USA. 1996;93:13304–13309. doi: 10.1073/pnas.93.23.13304. [DOI] [PMC free article] [PubMed] [Google Scholar]
- Selig DK, Nicoll RA, Malenka RC. Hippocampal long-term potentiation preserves the fidelity of postsynaptic responses to presynaptic bursts. Journal of Neuroscience. 1999;19:1236–1246. doi: 10.1523/JNEUROSCI.19-04-01236.1999. [DOI] [PMC free article] [PubMed] [Google Scholar]
- Skaggs WE, McNaughton BL, Wilson MA, Barnes CA. Theta phase precession in hippocampal neuronal populations and the compression of temporal sequences. Hippocampus. 1996;6:149–172. doi: 10.1002/(SICI)1098-1063(1996)6:2<149::AID-HIPO6>3.0.CO;2-K. [DOI] [PubMed] [Google Scholar]
- Waldeck RF, Pereda A, Faber DS. Properties and plasticity of paired-pulse depression at a central synapse. Journal of Neuroscience. 2000;20:5312–5320. doi: 10.1523/JNEUROSCI.20-14-05312.2000. [DOI] [PMC free article] [PubMed] [Google Scholar]
- Ylinen A, Soltész I, Bragin A, Penttonen M, Sik A, Buzsáki G. Intracellular correlates of hippocampal theta rhythm in identified pyramidal cells, granule cells, and basket cells. Hippocampus. 1995;5:78–90. doi: 10.1002/hipo.450050110. [DOI] [PubMed] [Google Scholar]