

Abstract
Inhibition of presynaptic voltage-gated calcium channels by direct G-protein βγ subunit binding is a widespread mechanism that regulates neurotransmitter release. Voltage-dependent relief of this inhibition (facilitation), most likely to be due to dissociation of the G-protein from the channel, may occur during bursts of action potentials. In this paper we compare the facilitation of N- and P/Q-type Ca2+ channels during short trains of action potential-like waveforms (APWs) using both native channels in adrenal chromaffin cells and heterologously expressed channels in tsA201 cells. While both N- and P/Q-type Ca2+ channels exhibit facilitation that is dependent on the frequency of the APW train, there are important quantitative differences. Approximately 20 % of the voltage-dependent inhibition of N-type ICa was reversed during a train while greater than 40 % of the inhibition of P/Q-type ICa was relieved. Changing the duration or amplitude of the APW dramatically affected the facilitation of N-type channels but had little effect on the facilitation of P/Q-type channels. Since the ratio of N-type to P/Q-type Ca2+ channels varies widely between synapses, differential facilitation may contribute to the fine tuning of synaptic transmission, thereby increasing the computational repertoire of neurons.
In most cases neurotransmitter release is triggered by calcium influx through N- and/or P/Q-type voltage-gated calcium channels which open in response to depolarization of the presynaptic nerve terminal (Luebke et al. 1993; Takahashi & Momiyama, 1993; Regehr & Mintz, 1994; Wheeler et al. 1994; Wu & Saggau, 1994; Waterman, 1996; Wright & Angus, 1996). Given their pivotal role in the release process, it is not surprising that a ubiquitous form of presynaptic inhibition involves G-protein-mediated inhibition of N- and P/Q-type Ca2+ channels.
Voltage-dependent inhibition is perhaps the most common and best studied of multiple modulatory pathways known to converge on N-type Ca2+ channels (Hille, 1994; Dolphin, 1995; Jones & Elmslie, 1997; Zamponi & Snutch, 1998; Ikeda & Dunlap, 1999). The membrane delimited inhibition is thought to be mediated by direct binding of activated G-protein βγ subunits to discrete regions of the pore-forming α1 subunit of the channel (Herlitze et al. 1996; Ikeda, 1996; De Waard et al. 1997; Zamponi et al. 1997; Delmas et al. 1998; Stephens et al. 1998). In addition to reducing the peak amplitude of the calcium channel current (ICa), the inhibition also produces characteristic shifts in channel gating that are manifest in slowed activation kinetics, a diminution of inhibition at depolarized membrane potentials and partial relief of the inhibition (also termed facilitation) by a conditioning prepulse (Bean, 1989; Elmslie et al. 1990; Penington et al. 1991). These effects have been incorporated into models in which the channels exhibit two functional gating states, one in the presence (‘reluctant’) and the other in the absence (‘willing’) of inhibition (Bean, 1989; Elmslie et al. 1990; Boland & Bean, 1993; Golard & Siegelbaum, 1993; Colecraft et al. 2000a; Lee & Elmslie, 2000). It is envisioned that the transient facilitation produced by a conditioning prepulse reflects a state-dependent change in affinity and dissociation of the G-protein βγ subunit from the channel at depolarized potentials. In addition to the facilitation observed during step depolarizations, which are clearly unphysiological, it has long been suggested that facilitation may occur during high frequency trains of action potentials leading to increased Ca2+ influx and neurotransmitter release (Bean, 1989; Elmslie et al. 1990; Kasai, 1992). Relatively few studies have directly tested this possibility and not all of those found an effect (Penington et al. 1991; Toth & Miller, 1995). However, there have been reports of facilitation of N-type ICa during trains of short (2–5 ms) step depolarizations or action potential-like voltage commands (Womack & McCleskey, 1995; Williams et al. 1997; Park & Dunlap, 1998; Tosetti et al. 1999). Recombinant P/Q-type (α1A) channels expressed in HEK 293 cells were found to exhibit facilitation during trains of action potential-like depolarizations (Brody et al. 1997). Moreover, it has been proposed that this phenomenon underlies short term synaptic facilitation at autapses in cultured hippocampal neurons (Brody & Yue, 2000).
In this study we systematically compared the facilitation of N-type and P/Q-type Ca2+ channels during trains of action potential-like waveforms, using both native and recombinant channels. Heretofore, there has been no explicit comparison of the factors governing facilitation for the two channel types, such as action potential amplitude, duration and frequency, which are known to vary between different neurons. The importance of this comparison lies in the observation that the relative proportion of N- and P/Q-type Ca2+ channels varies at different synapses (Luebke et al. 1993; Takahashi & Momiyama, 1993; Regehr & Mintz, 1994; Reuter, 1995; Wheeler et al. 1996; Poncer et al. 1997; Reid et al. 1997). Our results identify several important differences in the facilitation of N- and P/Q-type Ca2+ channels that may contribute to the synapse specific control of neurotransmitter release and plasticity.
METHODS
Cell culture and transfection
Bovine adrenal glands were obtained from a local slaughterhouse: chromaffin cells were prepared by digestion with collagenase followed by density gradient centrifugation as previously described (Artalejo et al. 1992). The cells were plated at a density of (0.15–0.2) × 106 cells ml−1 onto collagen-coated coverslips and maintained in an incubator at 37 °C in an atmosphere of 93 % air and 7 % CO2 with a relative humidity of 90 %. Fibroblasts were effectively suppressed with cytosine-arabinoside (10 μm), leaving relatively pure chromaffin cell cultures. Half of the culture medium was exchanged every day. This medium consisted of Dulbecco's modified Eagle's medium (DMEM)-F12 (1:1) (Gibco) supplemented with fetal bovine serum (10 %), glutamine (2 mm), penicillin-streptomycin (100 u ml−1 (100 μg ml)−1), cytosine arabinoside (10 μm) and 5-fluorodeoxyuridine (10 μm).
tsA201 cells used for transient transfection were grown in minimum essential medium (Life Technologies) supplemented with fetal bovine serum (10 %), glutamine (2 mm) and penicillin-streptomycin (100 u ml−1 (100 μg ml)−1). Cells were maintained in an incubator (37 °C in 95 % air and 5 % CO2 at 90 % humidity) and passaged every 3–5 days for up to 20 passages. Cloning of the bovine chromaffin cell α1B and β2a (GenBank nos. AF174417 and AF174418) subunit cDNAs from a chromaffin cell library was previously described (Cahill et al. 2000). The rat α1A subunit cDNA was a gift from T. P. Snutch (University of British Columbia, Vancouver, Canada) and the human α2δ subunit cDNA was kindly provided by R. J. Miller (Northwestern University, Chicago, IL). All subunits were subcloned into pcDNA3.1(+) (Invitrogen, Carlsbad, CA, USA) for transfection except the α1A which was in pMT2. Transfection with Qiagen purified plasmids (Hilden, Germany) was performed using lipofectamine Plus (Life Technologies, Grand Island, NY, USA). Cells were transfected with either α1A or α1B subunits along with β2a, α2δ and either enhanced green fluorescent protein (EGFP) or CD8 (a T lymphocyte cell surface protein) in a ratio of 5:5:5:1. Recording was performed 50–70 h after transfection on cells that had been replated on poly-l-lysine coated glass coverslips the previous day. Transfected cells were visually identified using either fluorescence of EGFP or by binding of anti-CD8 beads (Dynal, Great Neck, NY, USA).
Electrophysiology
For recording action potential waveforms chromaffin cells were current clamped using an Axopatch-1D amplifier (Axon Instruments, Foster City, CA) in the standard whole cell recording configuration. Action potentials were elicited by short current injection steps and the data were filtered at 5 kHz and sampled every 20 μs. Note that action potentials were recorded at 22 °C. For these experiments the intracellular patch pipette solution contained (mm): KCl 140, EGTA 0.1, Hepes 20, ATP 2, MgCl2 2, GTP 0.35. The extracellular solution was NaCl based (see below) but had no added TTX or nitrendipine. A typical action potential which peaked at +40 mV from a resting potential close to −70 mV was selected to serve as the template from which to generate the action potential-like waveform (APW) commands used in voltage clamp. In all voltage-clamp experiments reported in this paper the holding potential was −60 mV. The APW parameters are illustrated in Fig. 1A. This ‘normal’ action potential was of the same duration as the recorded template but was altered such that the holding potential was −60 mV and the peak was +35 mV. The duration of this APW at half-maximal amplitude was 4 ms. The repolarization phase of the APW was digitally shortened to produce the ‘brief’ APW, which had a duration of 2.48 ms at half-maximal amplitude (illustrated in Fig. 4 and Fig. 5). Cells were stimulated by a single APW every 10–15 s throughout the experiment to monitor the amplitude of ICa. The duration of the entire voltage template (including a small after-depolarization) was 20 ms for the ‘normal’ APW and 10 ms for the ‘brief’ APW, and the shortest interval between stimuli within a train was 2 ms. Therefore the ‘normal’ APW trains could be applied at frequencies up to 45 Hz and the ‘brief’ APW at frequencies up to 83 Hz. Trains of 20 APW were applied periodically to the cells but were always separated by at least 45 s and usually by several minutes. The frequency and peak amplitude of the APW within the train were changed as noted in the text. To determine the maximum facilitation possible a conditioning prepulse was used. The depolarizing voltage step command (to +100 mV for 50 ms) preceded an individual APW by 10 ms. Leak currents were generated by scaling and averaging 16 hyperpolarizing APW waveforms of reduced amplitude. The trains of currents illustrated in Fig. 1A and Fig. 3A were not leak subtracted but all data were leak subtracted before quantitative analysis.
Figure 1. Trains of APWs partially relieve the inhibition of ICa in adrenal chromaffin cells.

Chromaffin cells were stimulated with trains of 20 APWs applied at 45 Hz in the absence (control) or in the presence of 100 μm ATP. To determine the maximum voltage-dependent facilitation, a single APW was preceded by a conditioning prepulse to +100 mV for 50 ms. A, the upper left panel shows the voltage commands applied to the cell and the lower left panel shows the currents elicited by those voltage stimuli. An APW train was applied before (labelled ‘control’), and during application of 100 μm ATP (labelled ‘ATP’). ‘P’ indicates the ICa activated by a single APW preceded by a prepulse in the continued presence of ATP (the outward current elicited by the prepulse is also shown, but note that the tail current has been suppressed). The dashed lines indicate the amplitude of ICa for the 1st step within the APW trains and the amplitude of the current following a prepulse. The prepulse protocol was used to distinguish between voltage-dependent (marked ‘VD’) and voltage-independent (marked ‘VI’) inhibition as detailed in the text. The panel to the right illustrates an individual APW and leak subtracted ICa on an expanded time scale. B, mean facilitation produced by each APW during a train under control conditions and with ATP present. Facilitation was calculated by normalizing the peak amplitude of ICa to the first current within each train. C, the peak facilitation produced by a prepulse, the train of APWs and the train of APWs corrected for the decrease seen under control conditions. Note, the dashed line represents the theoretical facilitation that would be achieved if all the inhibition produced by ATP were reversed.
Figure 4. Shortening the APW duration has greater effects on N-type ICa facilitation than on P/Q-type ICa facilitation.

Cells were stimulated with a train of 20 ‘normal’ APWs at 45 Hz (see Fig. 1 for details) and then by a train of 20 ‘brief’ APWs at 45 Hz (the duration of the repolarization phase of the ‘brief’ APWs was digitally shortened as illustrated in the inset below panel A). A, the facilitation produced by trains in pharmacologically isolated P/Q-type (left) and N-type (right) Ca2+ channels from adrenal chromaffin cells. ATP (100 μm) was present to inhibit ICa. B, the facilitation of α1A (left) and α1B (right) type channels (coexpressed with β2a and α2δ in tsA201 cells). Inhibition of ICa was produced by including GTPγS in the intracellular solution. C, the mean peak facilitation produced by the ‘normal’ APW train (filled bars) and the ‘brief’ APW train (hatched bars) for each of the two channel types. P/Q-type/α1A channels are shown on the left and N-type/α1B channels are shown on the right. * Statistical significance between the ‘normal’ and ‘brief’ trains (P ≤ 0.001).
Figure 5. Dependence of facilitation on the frequency of APW trains.
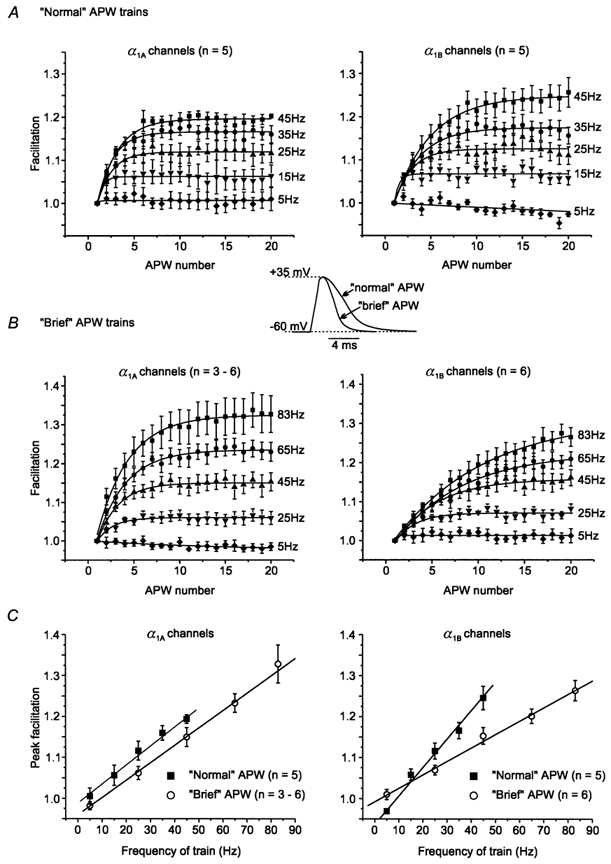
tsA201 cells were transiently transfected with either α1A or α1B channels (along with β2a and α2δ) and inhibition was elicited by inclusion of GTPγS in the intracellular pipette solution. Cells were stimulated by multiple trains of 20 APWs (either ‘normal’ or ‘brief’) at various frequencies (see inset below panel A for APW parameters). A, the facilitation produced by ‘normal’ APW trains applied at frequencies of 5–45 Hz. B, the facilitation produced by ‘brief’ APW trains applied at frequencies of 5–83 Hz. C, peak facilitation is plotted against train frequency for ‘normal’ and ‘brief’ APW trains. Linear regression fits to the data are shown.
Figure 3. Differential facilitation of recombinant α1A and α1B channels by APW trains.

Currents were recorded from tsA201 cells transiently transfected with either α1A or α1B along with β2a and α2δ subunits. GTPγS was included in the intracellular solution to tonically activate G-proteins and inhibit ICa. A, α1A channel currents (left) or α1B channel currents (right) in response to a train of 20 ‘normal’ APWs applied at 45 Hz. Following the train (indicated by ‘P’) is a current elicited by a single APW that was preceded by a conditioning prepulse of +100 mV for 50 ms. (Note that the outward current elicited during the prepulse is not shown.) The current amplitudes have been scaled to aid in comparison (note the different scale bars). Dashed lines indicate the amplitude of the first current within the train and the amplitude of the current preceded by a prepulse. B, the mean peak facilitation produced by the prepulse and train for both channel types. Note the difference in the ordinate.
Calcium channel currents (ICa) were recorded in standard whole cell voltage clamp configuration and the data were filtered at 2 kHz and sampled every 20 μs. Series resistance was partially compensated using the compensation circuit of the Axopatch-1D amplifier. The data were also captured on a second computer running in a continual acquisition mode (using Axotape software). These data were sampled every 200 μs, which allowed entire trains to be captured for display purposes and to ensure there were no interruptions during the stimulus train. Electrodes were pulled from microhaematocrit capillary tubes (Drummond Scientific, Broomall, PA, USA) and coated with Sylgard (Dow Corning, Midland, MI, USA). After fire polishing, electrodes had resistances of approximately 1.3–2.0 MΩ. Voltage protocols and data analysis were carried out using custom Axobasic software and Origin (OriginLab Corp., Northampton, MA, USA). Data are presented as means ± standard error of the mean and statistical analysis was performed using Student's t test (paired or independent where appropriate). All recordings were performed at room temperature (approx 22–24 °C).
Solutions
For voltage clamp recording of ICa, electrodes were filled with (mm): CsCl 110, MgCl2 4, Hepes 20, EGTA 10, GTP 0.35, ATP 4, creatine phosphate 14, pH 7.3, osmolarity approximately 310–315 mosmol l−1. For recordings with tsA201 cells the patch pipette solution contained 70 μm GTPγS to directly activate G-proteins and elicit inhibition of ICa. The recording bath had a volume of approximately 300–400 μl and was continually washed with fresh medium from gravity fed reservoirs at 3–4 ml min−1. The extracellular NaCl-based solution used to bathe cells before and during seal formation consisted of (mm): NaCl 150, KCl 2, MgCl2 2, glucose 10, Hepes 10, CaCl2 2, TTX 0.01–0.1, pH 7.3, osmolarity approx. 315 mosmol l−1. For recording ICa from chromaffin cells, once in voltage clamp mode the extracellular solution was switched to one in which the NaCl was replaced with N-methyl-d-glucamine-Cl to suppress TTX-insensitive Na+ currents, which were present in some cells. Inhibition of ICa was elicited by perfusing the bath with a supramaximal dose of ATP (100 μm) which was prepared daily. To pharmacologically isolate N- and P/Q-type ICa, peptide toxins (Alomone Labs, Jerusalem, Israel) (35–40 μl) were added directly to the bath at 10 times the desired final concentration with the flow of extracellular solution stopped. Thus ω-conotoxin GVIA (Cgtx) was added at 10 μm to give a final concentration of ∼1–2 μm and ω-Agatoxin IVA (AgaIVA) was added at 1–1.5 μm to give a final concentration of ∼100–300 nm. After complete block (1–4 min) the bath was continually washed with fresh medium for the remainder of the experiment. No washout of block was observed over the time course of the experiments. Nitrendipine (1–2 μm) (Calbiochem, La Jolla, CA, USA) was present in all voltage-clamp experiments performed on chromaffin cells to block any L-type channels that may be present. It was prepared daily from a 10 mm stock prepared in ethanol.
For recording from tsA201 cells, seals were formed in NaCl-based medium and then the bath solution was switched to one containing (mm): tetraethylammonium-Cl 155, glucose 10, Hepes 10, CaCl2 2, TTX 0.01–0.02 nm, pH 7.3, 315 mosmol l−1.
RESULTS
Trains of action potential waveforms partially relieve the inhibition of ICa in adrenal chromaffin cells
Bovine adrenal chromaffin cells provide a convenient model system in which to compare the modulation of native N- and P/Q-type ICa. Due to their small size and lack of neurites, chromaffin cells are readily voltage clamped, an important consideration when using fast voltage commands that mimic action potentials. Furthermore, the N- and P/Q-type channels are expressed in a ratio of roughly 1:1 and can be easily isolated pharmacologically (Currie & Fox, 1997). We, as well as other labs, have previously shown that ATP coreleased with catecholamines is a negative feedback inhibitor of ICa in bovine adrenal chromaffin cells (Albillos et al. 1996; Currie & Fox, 1996, 1997). Both N- and P/Q-type channels are targeted, although the N-type channels are inhibited to a greater extent than are the P/Q-type channels. The inhibition, mediated by pertussis toxin-sensitive G-proteins, slows the activation kinetics of ICa and can be partially relieved by strongly depolarizing voltage step commands (prepulse facilitation). For all experiments in which chromaffin cells were used, 1–2 μm nitrendipine was included in the extracellular recording media to prevent activity-dependent recruitment of L-type ICa that could mask the relief of G-protein inhibition that is the focus of this study. A description of the action potential parameters is found in the methods and they are illustrated in Fig. 1 and Fig. 4.
Chromaffin cells were voltage clamped at a holding potential of −60 mV and stimulated by a train of 20 APWs at a frequency of 45 Hz under control conditions and in the presence of a supramaximal dose of ATP (100 μm). Figure 1A shows an example of the calcium currents recorded from a cell in response to each of the trains. Under control conditions (before application of ATP) there was a small reversible decline in current amplitude during the train, probably due to channel inactivation. Application of 100 μm ATP inhibited ICa by approximately 50 %. In the presence of ATP the amplitude of ICa increased and reached a plateau during the APW train due to partial relief of the inhibition.
To quantify the extent of relief from inhibition (facilitation) within a train, the amplitude of ICa was normalized relative to the first current within that train (Fig. 1B). The values for the peak facilitation that are reported were determined by averaging the last four currents within each train. This produced a value of 1.14 ± 0.01 (n = 27) for trains applied in the presence of ATP. In other words 14 ± 1.3 % (n = 27) of the inhibition produced by ATP was relieved during the APW train. This may be an underestimate of the true facilitation since under control conditions there was a decrease in the current of around 7 % during the train (to 0.93 ± 0.01 of initial amplitude; n = 27). When corrected for this decrease, the train relieved 22 ± 1 % (n = 27) of the inhibition produced by ATP.
Neurotransmitters can activate multiple inhibitory pathways that converge on Ca2+ channels (Hille, 1994). Voltage-dependent inhibition is thought to be produced by activated G-protein βγ subunits binding directly to the channel (Herlitze et al. 1996; Ikeda, 1996; De Waard et al. 1997; Zamponi et al. 1997) while facilitation is likely to reflect dissociation of the βγ from the channels (see Discussion for model). Other inhibitory pathways are voltage independent and are not subject to reversal during APW trains or conditioning prepulses (Hille, 1994). Although it is not clear if there is a true mechanistic difference, the voltage-dependent inhibition can be functionally defined as the component that is maximally relieved by a conditioning prepulse. By comparing the facilitation produced by APW trains to that produced by the prepulse (which represents 100 % relief of the voltage-dependent inhibition) we were able to determine the percentage of the voltage-dependent inhibition that was relieved by the APW trains (Fig. 1). The conditioning prepulse consisted of a 50 ms duration voltage step command to +100 mV, applied to the cell 10 ms prior to an APW (Fig. 1A). We have previously shown that this protocol maximally relieves the inhibition produced by ATP (Currie & Fox, 1997). Under control conditions (no ATP present) the prepulse had no significant effect on the amplitude of ICa elicited by an APW (prepulse facilitation = 0.99 ± 0.01; n = 11). ATP inhibited ICa by 50.5 ± 1.5 % (n = 18) and approximately 70 % of this inhibition was operationally voltage dependent (i.e. reversed by the prepulse, Fig. 1A and C). The mean facilitation produced by the prepulse was 1.73 ± 0.04 (n = 18). The train produced a facilitation of 1.12 ± 0.01, which after correction for the decline seen in control conditions became 1.21 ± 0.01 (Fig. 1C). The facilitation produced by a train was compared to the facilitation produced by a prepulse in the same cell. This revealed that on average 17 ± 1.3 % (n = 18, Fig. 1C) of the voltage-dependent inhibition was relieved during the train or 30 ± 1.5 % (n = 18) when corrected for the decrease in current amplitude observed during a train under control conditions.
Trains of action potential waveforms differentially relieve the inhibition of N- and P/Q-type ICa in adrenal chromaffin cells
Having established that APW trains partially relieved the voltage-dependent inhibition produced by ATP, N- and P/Q-type ICa were compared. Under our recording conditions (L-type channels blocked) the calcium current was composed of roughly half N-type and half P/Q-type ICa (Currie & Fox, 1996, 1997). The two channel types were pharmacologically isolated using selective calcium channel blockers. Consistent with our previous results, ω-conotoxin GVIA (Cgtx) (1–2 μm), a selective blocker of N-type ICa, irreversibly reduced the peak amplitude of ICa by 50 ± 2.3 % (n = 12). In another group of cells ω-Agatoxin IVA (100–300 nm), a selective blocker of P/Q-type channels, reduced ICa by 46 ± 3.8 % (n = 12). For this study we ignored the small (4–7 %) toxin-resistant component of ICa that is sometimes found in these cells. Hence, N-type ICa was defined as the current remaining after block with AgaIVA, and P/Q-type ICa was defined as the current remaining after application of Cgtx.
As shown in Fig. 2A both channel types exhibited facilitation when stimulated with a train of 20 APWs at 45 Hz in the presence of ATP, and a small decline in amplitude under control conditions (Fig. 2A). Closer analysis revealed important quantitative differences. The inhibition produced by ATP was 63 ± 2 % for the N-type channels (n = 5), while it was 36 ± 3 % for the P/Q-type channels (n = 8; P < 0.001). The APW train (after correction for the decline seen in control conditions) relieved 15 ± 2.0 % (n = 5) of the inhibition of the N-type ICa produced by ATP (facilitation = 1.24 ± 0.03) and a significantly greater proportion, 34 ± 4.9 % (n = 8; P < 0.02), of the inhibition of P/Q-type ICa (facilitation = 1.18 ± 0.02).
Figure 2. Differential facilitation of native N- and P/Q-type ICa by APW trains.

N- and P/Q-type ICa were pharmacologically isolated in adrenal chromaffin cells using selective channel blockers. A, the mean facilitation for each ICa within a train of 20 APWs applied at 45 Hz under control conditions (before application of ATP) or when ICa was inhibited (ATP present). The graph on the left shows isolated P/Q-type channels (the current component remaining after block with 1–2 μm ω-conotoxin GVIA). The graph on the right shows the data for isolated N-type channels (the current component remaining after block with 100–300 nm ω-Agatoxin IVA). Control currents showed a progressive decrease in amplitude whereas inhibited currents showed facilitation (1.19 ± 0.02, n = 12 for N-type and 1.15 ± 0.02, n = 12 for P/Q-type). B, the peak facilitation produced for each channel type by a prepulse, the train of APWs and the train of APWs corrected for the decrease seen under control conditions. The dashed lines represent the theoretical level of facilitation if all the inhibition produced by ATP was reversed. Note the difference in the ordinates.
As previously described, a prepulse was used to distinguish the voltage-dependent inhibition for the two channel types. Approximately 70 % of the N-type inhibition was voltage dependent while ∼63 % of the P/Q-type inhibition was voltage dependent. The difference in magnitude of voltage-dependent inhibition was reflected in the prepulse facilitation which was 2.2 ± 0.1 (n = 5) for N-type channels and 1.37 ± 0.04 (n = 8) for P/Q-type channels (Fig. 2B). Figure 2B illustrates that the APW train relieved a much greater proportion of the voltage-dependent inhibition of P/Q-type channels than of N-type channels. When corrected for the decrease in current amplitude that occurs during a train in control conditions, the APW train relieved 21 ± 3.1 % (n = 5) of the voltage-dependent inhibition of N-type channels and 54 ± 8.2 % (n = 8; P < 0.02) of the voltage-dependent inhibition of P/Q-type channels. Overall, these data show that although P/Q-type channels were inhibited to a lesser extent than were N-type channels, a greater proportion of this inhibition was relieved during APW trains.
Trains of action potential waveforms differentially relieve the inhibition of recombinant α1A and α1B calcium channels expressed in tsA201 cells
The use of recombinant channels transiently expressed in tsA201 cells has the advantage that one can unequivocally record from a single population of channels of known subunit composition. We performed these experiments to corroborate the data obtained for pharmacologically isolated channels in adrenal chromaffin cells. Either α1A (P/Q-type) or α1B (N-type) subunits were transiently expressed in tsA201 cells along with β2a and α2δ subunits and either GFP or CD8 to allow visual identification of transfected cells. At least five different β subunits are found in chromaffin cells (β1b, β1c, β2a, β2b and β3a) but we chose the β2a subunit for these experiments as it has been shown to produce relatively non-inactivating currents that most closely resemble the native channels found in chromaffin cells (Cahill et al. 2000). Although tsA201 cells express endogenous somatostatin receptors which couple to the exogenous calcium channels, this response desensitizes during prolonged or repeated agonist application (K. P. M. Currie and A. P. Fox, unpublished observation). To avoid the problems associated with receptor desensitization, GTPγS was included in the intracellular patch pipette solution to directly activate G-proteins and tonically inhibit ICa. The data in Fig. 3 show that a 45 Hz train of 20 APWs produced a facilitation of both the α1A and the α1B channel currents. The α1B channels were inhibited to a greater extent than were the α1A channels, as illustrated in the magnitude of the prepulse facilitation (2.28 ± 0.11, n = 15 for α1B compared to 1.45 ± 0.03, n = 13 for α1A; Fig. 3). As with the native ICa, a greater proportion of the voltage-dependent inhibition of α1A channels (43 ± 2.4 %; n = 13) was relieved by the APW train compared to the α1B channels (20 ± 1.5 %; n = 15; P < 1 × 10⁻⁶) (note that because the channels were tonically inhibited by GTPγS, APW trains could not be applied under control conditions so there is no ‘correction’ for channel inactivation). These data support the idea that the inhibition of P/Q-type/α1A Ca2+ channels is more easily relieved by APW trains than is the inhibition of N-type/α1B Ca2+ channels.
Facilitation of N-type ICa shows greater sensitivity to action potential waveform duration than does P/Q-type ICa
Since the duration of action potentials can vary dramatically between cells, we assessed the impact on facilitation of reducing APW duration by digitally shortening the repolarization phase of the APW (as detailed in Methods and illustrated in the inset of Fig. 4A). The facilitation produced by a 45 Hz train of these ‘brief’ APWs was compared to the facilitation produced by a 45 Hz train of ‘normal’ APWs in the same cells. Experiments were performed on pharmacologically isolated P/Q- and N-type ICa in chromaffin cells and on recombinant α1A and α1B channels transiently expressed in tsA201 cells (along with β2a and α2δ). Reducing the duration of the APWs produced only a small decrease in facilitation of recombinant α1A or native P/Q-type ICa, which was not statistically significant (Fig. 4A, B and C, left panels). In contrast the facilitation of recombinant α1B and native N-type ICa was dramatically reduced (Fig. 4A, B and C, right panels).
The dependence of facilitation on action potential frequency
tsA201 cells transiently transfected with either α1A or α1B channels were used to investigate the effect of train frequency on facilitation. The cells were stimulated by a series of trains (20 ‘normal’ APWs) applied at 45 Hz, 35 Hz, 25 Hz, 15 Hz and 5 Hz, and finally the 45 Hz train was repeated. There was no statistical difference in the facilitation produced by the two trains applied at 45 Hz indicating that facilitation remained constant throughout the experiment. Similar experiments were performed using trains of 20 ‘brief’ APWs to stimulate the cells at frequencies of 83 Hz, 65 Hz, 45 Hz, 25 Hz and 5 Hz. As shown in Fig. 5 reducing the frequency of the train caused a progressive linear decrease in the amount of facilitation in both channel types. The relationship between facilitation and frequency was similar using ‘normal’ or ‘brief’ APW trains for α1A channels (slopes are roughly parallel). For α1B channels the relationship between facilitation and frequency was less steep when ‘brief’ APW trains were used.
Changing the peak voltage of the action potential waveform differentially affects facilitation of N- and P/Q-type Ca2+ channels
The amplitude of action potentials varies among different kinds of neurons, so we used transiently transfected tsA201 cells expressing either α1A or α1B channels to compare the effect of changing the peak voltage of the APWs on facilitation (Fig. 6). The holding potential remained at −60 mV throughout the experiment and each cell was stimulated by a series of trains (20 ‘normal’ APWs applied at 45 Hz). The peak voltage of the APWs was varied between trains in 5 mV increments from +15 mV to +45 mV. Prior to each train, the facilitation produced by a prepulse (+100 mV for 50 ms applied 10 ms before the APW) was determined. Changing the peak voltage of the APWs over this 30 mV range had no significant effect on the facilitation of α1A channels. In contrast there was a dramatic effect seen on α1B channels, with progressively more facilitation produced by a train when the voltage was increased from +15 to +45 mV. Over this voltage range the facilitation increased by 141 % from 1.17 ± 0.04 to 1.41 ± 0.04 (n = 6; P < 0.001).
Figure 6. The facilitation of α1B channels shows a greater voltage dependence than do α1A channels.

tsA201 cells were transiently transfected with α1A or α1B channels (along with β2a and α2δ subunits) and inhibition was elicited by inclusion of GTPγS in the intracellular pipette solution. Cells were stimulated by multiple trains applied at 45 Hz in which the peak voltage of the APW was changed in 5 mV increments from +15 mV to +45 mV (see inset to panel A). A, the facilitation produced by trains of ‘normal’ APWs. Changing the peak voltage of the APW had no effect on the facilitation of α1A channels (left) but greatly altered the facilitation of α1B channels (right). B, the mean peak facilitation produced by each train plotted against the peak voltage of the APW for that train. The filled bars are for ‘normal’ APWs (* statistical significance relative to +45 mV; P < 0.004). Cells were also stimulated with ‘brief’ APW trains, shown by the hatched bars (# statistical significance relative to +45 mV; P < 0.01).
The same experiment was repeated using trains of 20 ‘brief’ APWs applied at 45 Hz. As expected the facilitation of α1B channels showed a strong dependence on the peak voltage of the APWs. The facilitation increased 243 % over the 30 mV range (+15 to +45 mV) from 1.07 ± 0.01 to 1.24 ± 0.03 (n = 6; P < 0.001). Use of the ‘brief’ APW uncovered a modest voltage dependence of the α1A channel facilitation which increased by 36 % (between +15 and +45 mV) from 1.14 ± 0.01 to 1.19 ± 0.02 (n = 6; P < 0.04).
DISCUSSION
Relief of presynaptic Ca2+ channel inhibition (facilitation) during bursts of action potentials could augment Ca2+ influx and thereby neurotransmitter release. Although a few papers have addressed the question of whether such relief can occur, there has been no explicit comparison of the parameters determining facilitation, like action potential amplitude, duration or frequency, on the two channels types most intimately coupled to transmitter release, the N- and P/Q-type Ca2+ channels. In this paper we provide such a comparison and identify several important differences in the facilitation of N-type and P/Q-type Ca2+ channels during APW trains. The use of both heterologously expressed channels (in tsA201 cells) and primary cultures of adrenal chromaffin cells allowed us to corroborate results between recombinant and native channels.
Voltage-dependent inhibition is thought to be produced by activated G-protein βγ subunits binding directly to the channel (Herlitze et al. 1996; Ikeda, 1996; De Waard et al. 1997; Zamponi et al. 1997) while facilitation may reflect dissociation of the βγ from the channels (see below for model). However, neurotransmitters commonly activate other inhibitory pathways that are voltage independent, so are not subject to reversal during APW trains or conditioning prepulses (Hille, 1994). To functionally define the amount of voltage-dependent inhibition of ICa, we used a conditioning prepulse (+100 mV for 50 ms) that maximally relieves the inhibition of ICa in chromaffin cells (Currie & Fox, 1997). By comparing the facilitation produced by APW trains to that produced by the prepulse (which represents 100 % relief of the voltage-dependent inhibition) we were able to determine the percentage of the voltage-dependent inhibition that was relieved by APW trains.
In adrenal chromaffin cells, pharmacologically isolated N- and P/Q-type ICa both exhibited reliable facilitation during a short train of APWs when ATP was present to inhibit ICa. The facilitation clearly reached a plateau after approximately 10 APWs, which probably reflects (at least in part) the kinetics of the G-protein βγ subunit unbinding from and rebinding to the channel. Under control conditions there was a progressive, reversible decline in the amplitude of ICa during a train (Fig. 1 and Fig. 2, control), most likely to be due to channel inactivation. If this also occurs in the presence of ATP then the true extent of facilitation would be partially masked. We have attempted to account for this decline by including estimates of ‘corrected’ facilitation in the text and Fig. 1 and Fig. 2. However, it should be noted that this assumes that inactivation proceeds at the same rate in the presence of ATP, which remains to be determined. Modulation of the channels by G-proteins and inactivation will ‘superimpose physiologically’, assuming that the two processes develop simultaneously during APW trains. Therefore, it will be of interest to determine whether they interact or proceed independently.
Although both channel types exhibit facilitation there are important quantitative differences. In agreement with previous studies that used step depolarizations to activate ICa (Bourinet et al. 1996; Currie & Fox, 1996; Zhang et al. 1996; Currie & Fox, 1997) the P/Q-type channels were inhibited to a lesser extent than were N-type channels (Fig. 2B). However, a significantly greater proportion of the inhibition of P/Q-type ICa (∼34 %) was relieved during the APW train as compared to N-type ICa (∼15 %). When considering voltage-dependent inhibition in isolation (by using the prepulse protocol) these values rise to ∼50 % for P/Q-type and ∼20 % for N-type channels. We obtained similar differential inhibition and facilitation when using recombinant α1A (P/Q-type) or α1B (N-type) channels transiently expressed in tsA201 cells along with β2a and α2δ subunits (Fig. 3). The use of recombinant channels enabled unequivocal channel identification and control of auxiliary subunits. For these experiments GTPγS was used to directly activate the G-proteins and produce a tonic inhibition of ICa in order to avoid complications due to desensitization of the endogenous somatostatin receptors in response to prolonged or repeated agonist application. Although this meant that we could not obtain data for the two channels under control conditions (before inhibition) the use of a conditioning prepulse to identify the extent of voltage-dependent inhibition in the cells correlated well with the data from chromaffin cells. We feel that this corroboration between data from native and recombinant channels strengthens these findings.
Since the frequency over which neurons fire varies widely, as do the duration and peak voltage of action potentials, we investigated the effects of changing these parameters on the facilitation of both channel types. As expected from previous work (Williams et al. 1997; Park & Dunlap, 1998; Tosetti et al. 1999), facilitation decreased as the frequency of the train was decreased. Both N- and P/Q-type ICa showed a roughly linear change in facilitation over the range of frequencies studied in this paper (5–83 Hz).
Reducing the duration of the APW (from a half-width of 4 ms to 2.48 ms) greatly reduced the facilitation of N-type ICa but only had small statistically insignificant effects on the facilitation of P/Q-type ICa. While further reductions in APW duration are likely to have significant effects on the facilitation of P/Q-type ICa (Brody et al. 1997), our data demonstrate that the facilitation of N-type ICa is much more sensitive to APW duration. We also saw dramatic differences between N- and P/Q-type channels in the voltage dependence of facilitation produced by APW trains. Changing the peak voltage of the APW in the physiologically relevant range of +15 to +45 mV (in 5 mV increments) had virtually no effect on the facilitation of P/Q-type ICa. However, there was a large increase in the amount of facilitation of N-type ICa over this voltage range.
A possible mechanistic explanation for the differences in facilitation of N- and P/Q-type ICa
One possible explanation for our results within the terms of the most widely accepted model for G-protein modulation of ICa (Bean, 1989; Elmslie et al. 1990; Boland & Bean, 1993; Golard & Siegelbaum, 1993; Colecraft et al. 2000a; Lee & Elmslie, 2000) is presented below. However, differences in the efficacy with which the bound G-protein alters the gating of ICa could also contribute to the results.
Binding of G- protein βγ subunits directly to the pore forming α1 subunit of the Ca2+ channel shifts the gating mode from ‘willing’ (from which they readily open) to ‘reluctant’ (from which they open less frequently). Facilitation is thought to occur because at depolarized potentials there is a decrease in the affinity of the βγ-channel interaction resulting in dissociation of βγ from the channel and relief of inhibition. The free βγ subunits rapidly (τ < 100 ms) reassociate with the Ca2+ channels at more negative membrane potentials shifting the channels back to the inhibited or ‘reluctant’ gating mode. During a train of action potentials some of the βγ subunits dissociate from the channels when the cell is depolarized and because the time course for rebinding is longer than the interval between successive depolarizations the observed facilitation summates within the train.
In this model the greater relief of inhibition of P/Q-type channels by an APW train may reflect a more rapid dissociation of the G-protein βγ subunit from the P/Q-type channels than the N-type channels. The more rapid dissociation kinetics would also explain why there is less sensitivity to the reduction in APW duration. Furthermore, assuming a simple bimolecular interaction, lower affinity (reflected in a faster rate of dissociation) would result in a smaller fractional occupancy of the channel by βγ, thereby explaining the difference in magnitude of the inhibition between the two channel types. One might expect that such differences in affinity for the two channels should be reflected in the kinetics of facilitation produced by a prepulse and reinhibition following a prepulse. However, while these kinetics have been reported to be faster for recombinant α1A (P/Q-type) channels than for α1B (N-type) channels expressed in Xenopus oocytes (Zhang et al. 1996) several other studies found no such differences when strongly depolarizing prepulses (≥ +100 mV) were used (Currie & Fox, 1997; Meza & Adams, 1998; Roche & Treistman, 1998). This inconsistency may be explained if the affinity of βγ for the two channels is similar at very depolarized potentials but differs at less depolarized potentials. Recently, it has been reported that the time constant for dissociation of βγ differs between the two channel types, but only at voltages below ∼+30 mV (Colecraft et al. 2000b). Since this spans the physiological range encompassing action potentials, it could explain the differential relief of inhibition produced by APW trains we report in this study even though we have previously seen no difference in the kinetics of facilitation in chromaffin cells using prepulses to +100 mV (Currie & Fox, 1997).
Our data shows that changing the peak APW voltage (from +15 to +45 mV) had little effect on the facilitation of P/Q-type channels but had a large effect on N-type channels. This implies that the dissociation of βγ from the P/Q-type channels proceeds at similar rates over this voltage range but that the dissociation rate of βγ from N-type channels decreases at less depolarized potentials. In support of this hypothesis, Yue and colleagues have reported that the dissociation time constant (τ) for P/Q-type channels is relatively constant over a wide voltage range (-10 to +100 mV) but for N-type channels there is a substantial increase in τ at potentials ≤ +25 to +30 mV (Colecraft et al. 2000b). A qualitatively similar increase in τ at less depolarized potentials has been noted previously for N-type channels (Kasai, 1992).
Physiological implications of differential facilitation
The fundamental difference that we identify in this paper is that trains of action potential-like waveforms can relieve the voltage-dependent inhibition of P/Q-type ICa more easily than the inhibition of N-type ICa. This may provide more plasticity to the inhibition of P/Q-type channels than N-type channels, especially in cells that fire bursts of action potentials. The greater sensitivity of N-type Ca2+ channel facilitation to the peak voltage and duration of the action potential may also be important. Some pre-synaptic nerve terminals express primarily N-type channels, others primarily P/Q-type channels while others express both (Reuter, 1995; Poncer et al. 1997; Reid et al. 1997). If the action potentials invading the terminals are large in amplitude and ‘longer’ lasting then there will be facilitation of ICa at all types of synapses. As the duration and/or amplitude of the action potential decreases, the facilitation of N-type channels will decrease more rapidly than the facilitation of P/Q-type channels. At some point this will result in facilitation occurring preferentially at P/Q-type synapses and not N-type synapses. Consistent with this idea is that short term synaptic facilitation was observed at hippocampal autapses during a train when transmission was triggered by P/Q-type ICa but not N-type ICa (Brody & Yue, 2000). A combination of the action potential parameters and selective channel expression may help to explain why there appears to be facilitation of ICa at some synapses and not others (Brody & Yue, 2000; Kreitzer & Regehr, 2000). The differences in facilitation of the two channel types identified in this study may contribute to synapse specific regulation of neurotransmitter release and plasticity.
Acknowledgments
This work was supported by NIH grants to APF.
REFERENCES
- Albillos A, Carbone E, Gandia L, Garcia AG, Pollo A. Opioid inhibition of Ca2+ channel subtypes in bovine chromaffin cells: selectivity of action and voltage-dependence. European Journal of Neuroscience. 1996;8:1561–1570. doi: 10.1111/j.1460-9568.1996.tb01301.x. [DOI] [PubMed] [Google Scholar]
- Artalejo CR, Perlman RL, Fox AP. Omega-conotoxin GVIA blocks a Ca2+ current in bovine chromaffin cells that is not of the “classic” N type. Neuron. 1992;8:85–95. doi: 10.1016/0896-6273(92)90110-y. [DOI] [PubMed] [Google Scholar]
- Bean BP. Neurotransmitter inhibition of neuronal calcium currents by changes in channel voltage dependence. Nature. 1989;340:153–156. doi: 10.1038/340153a0. [DOI] [PubMed] [Google Scholar]
- Boland LM, Bean BP. Modulation of N-type calcium channels in bullfrog sympathetic neurons by luteinizing hormone-releasing hormone: kinetics and voltage dependence. Journal of Neuroscience. 1993;13:516–533. doi: 10.1523/JNEUROSCI.13-02-00516.1993. [DOI] [PMC free article] [PubMed] [Google Scholar]
- Bourinet E, Soong TW, Stea A, Snutch TP. Determinants of the G protein-dependent opioid modulation of neuronal calcium channels. Proceedings of the National Academy of Sciences of the USA. 1996;93:1486–1491. doi: 10.1073/pnas.93.4.1486. [DOI] [PMC free article] [PubMed] [Google Scholar]
- Brody DL, Patil PG, Mulle JG, Snutch TP, Yue DT. Bursts of action potential waveforms relieve G-protein inhibition of recombinant P/Q-type Ca2+ channels in HEK 293 cells. Journal of Physiology. 1997;499:637–644. doi: 10.1113/jphysiol.1997.sp021956. [DOI] [PMC free article] [PubMed] [Google Scholar]
- Brody DL, Yue DT. Relief of G-protein inhibition of calcium channels and short-term synaptic facilitation in cultured hippocampal neurons. Journal of Neuroscience. 2000;20:889–898. doi: 10.1523/JNEUROSCI.20-03-00889.2000. [DOI] [PMC free article] [PubMed] [Google Scholar]
- Cahill AL, Hurley JH, Fox AP. Coexpression of cloned α1B, β2a, and α2/δ subunits produces non-inactivating calcium currents similar to those found in bovine chromaffin cells. Journal of Neuroscience. 2000;20:1685–1693. doi: 10.1523/JNEUROSCI.20-05-01685.2000. [DOI] [PMC free article] [PubMed] [Google Scholar]
- Colecraft HM, Brody DL, Yue DT. G-protein inhibition of N- and P/Q-type calcium channels: distinctive elementary mechanisms and their functional impact. Journal of Neuroscience. 2000a;21:1137–1147. doi: 10.1523/JNEUROSCI.21-04-01137.2001. [DOI] [PMC free article] [PubMed] [Google Scholar]
- Colecraft HM, Patil PG, Yue DT. Differential occurrence of reluctant openings in G-protein-inhibited N- and P/Q-type calcium channels. Journal of General Physiology. 2000b;115:175–192. doi: 10.1085/jgp.115.2.175. [DOI] [PMC free article] [PubMed] [Google Scholar]
- Currie KPM, Fox AP. ATP serves as a negative feedback inhibitor of voltage-gated Ca2+ channel currents in cultured bovine adrenal chromaffin cells. Neuron. 1996;16:1027–1036. doi: 10.1016/s0896-6273(00)80126-9. [DOI] [PubMed] [Google Scholar]
- Currie KPM, Fox AP. Comparison of N- and P/Q-type voltage-gated calcium channel current inhibition. Journal of Neuroscience. 1997;17:4570–4579. doi: 10.1523/JNEUROSCI.17-12-04570.1997. [DOI] [PMC free article] [PubMed] [Google Scholar]
- De Waard M, Liu H, Walker D, Scott VE, Gurnett CA, Campbell KP. Direct binding of G-protein betagamma complex to voltage-dependent calcium channels. Nature. 1997;385:446–450. doi: 10.1038/385446a0. [DOI] [PubMed] [Google Scholar]
- Delmas P, Brown DA, Dayrell M, Abogadie FC, Caulfield MP, Buckley NJ. On the role of endogenous G-protein βγ subunits in N-type Ca2+ current inhibition by neurotransmitters in rat sympathetic neurones. Journal of Physiology. 1998;506:319–329. doi: 10.1111/j.1469-7793.1998.319bw.x. [DOI] [PMC free article] [PubMed] [Google Scholar]
- Dolphin AC. The G. L. Brown Prize Lecture. Voltage-dependent calcium channels and their modulation by neurotransmitters and G proteins. Experimental Physiology. 1995;80:1–36. doi: 10.1113/expphysiol.1995.sp003825. [DOI] [PubMed] [Google Scholar]
- Elmslie KS, Zhou W, Jones SW. LHRH and GTP-gamma-S modify calcium current activation in bullfrog sympathetic neurons. Neuron. 1990;5:75–80. doi: 10.1016/0896-6273(90)90035-e. [DOI] [PubMed] [Google Scholar]
- Golard A, Siegelbaum SA. Kinetic basis for the voltage-dependent inhibition of N-type calcium current by somatostatin and norepinephrine in chick sympathetic neurons. Journal of Neuroscience. 1993;13:3884–3894. doi: 10.1523/JNEUROSCI.13-09-03884.1993. [DOI] [PMC free article] [PubMed] [Google Scholar]
- Herlitze S, Garcia DE, Mackie K, Hille B, Scheuer T, Catterall WA. Modulation of Ca2+ channels by G-protein beta gamma subunits. Nature. 1996;380:258–262. doi: 10.1038/380258a0. [DOI] [PubMed] [Google Scholar]
- Hille B. Modulation of ion-channel function by G-protein-coupled receptors. Trends in Neurosciences. 1994;17:531–536. doi: 10.1016/0166-2236(94)90157-0. [DOI] [PubMed] [Google Scholar]
- Ikeda SR. Voltage-dependent modulation of N-type calcium channels by G-protein beta gamma subunits. Nature. 1996;380:255–258. doi: 10.1038/380255a0. [DOI] [PubMed] [Google Scholar]
- Ikeda SR, Dunlap K. Voltage-dependent modulation of N-type calcium channels: role of G protein subunits. Advances in Second Messenger and Phosphoprotein Research. 1999;33:131–151. doi: 10.1016/s1040-7952(99)80008-1. [DOI] [PubMed] [Google Scholar]
- Jones SW, Elmslie KS. Transmitter modulation of neuronal calcium channels. Journal of Membrane Biology. 1997;155:1–10. doi: 10.1007/s002329900153. [DOI] [PubMed] [Google Scholar]
- Kasai H. Voltage- and time-dependent inhibition of neuronal calcium channels by a GTP-binding protein in a mammalian cell line. Journal of Physiology. 1992;448:189–209. doi: 10.1113/jphysiol.1992.sp019036. [DOI] [PMC free article] [PubMed] [Google Scholar]
- Kreitzer AC, Regehr WG. Modulation of transmission during trains at a cerebellar synapse. Journal of Neuroscience. 2000;20:1348–1357. doi: 10.1523/JNEUROSCI.20-04-01348.2000. [DOI] [PMC free article] [PubMed] [Google Scholar]
- Lee HK, Elmslie KS. Reluctant gating of single N-type calcium channels during neurotransmitter-induced inhibition in bullfrog sympathetic neurons. Journal of Neuroscience. 2000;20:3115–3128. doi: 10.1523/JNEUROSCI.20-09-03115.2000. [DOI] [PMC free article] [PubMed] [Google Scholar]
- Luebke JI, Dunlap K, Turner TJ. Multiple calcium channel types control glutamatergic synaptic transmission in the hippocampus. Neuron. 1993;11:895–902. doi: 10.1016/0896-6273(93)90119-c. [DOI] [PubMed] [Google Scholar]
- Meza U, Adams B. G-Protein-dependent facilitation of neuronal α1A, α1B, and α1E Ca channels. Journal of Neuroscience. 1998;18:5240–5252. doi: 10.1523/JNEUROSCI.18-14-05240.1998. [DOI] [PMC free article] [PubMed] [Google Scholar]
- Park D, Dunlap K. Dynamic regulation of calcium influx by G-proteins, action potential waveform, and neuronal firing frequency. Journal of Neuroscience. 1998;18:6757–6766. doi: 10.1523/JNEUROSCI.18-17-06757.1998. [DOI] [PMC free article] [PubMed] [Google Scholar]
- Penington NJ, Kelly JS, Fox AP. A study of the mechanism of Ca2+ current inhibition produced by serotonin in rat dorsal raphe neurons. Journal of Neuroscience. 1991;11:3594–3609. doi: 10.1523/JNEUROSCI.11-11-03594.1991. [DOI] [PMC free article] [PubMed] [Google Scholar]
- Poncer JC, McKinney RA, Gahwiler BH, Thompson SM. Either N- or P-type calcium channels mediate GABA release at distinct hippocampal inhibitory synapses. Neuron. 1997;18:463–472. doi: 10.1016/s0896-6273(00)81246-5. [DOI] [PubMed] [Google Scholar]
- Regehr WG, Mintz IM. Participation of multiple calcium channel types in transmission at single climbing fiber to Purkinje cell synapses. Neuron. 1994;12:605–613. doi: 10.1016/0896-6273(94)90216-x. [DOI] [PubMed] [Google Scholar]
- Reid CA, Clements JD, Bekkers JM. Nonuniform distribution of Ca2+ channel subtypes on presynaptic terminals of excitatory synapses in hippocampal cultures. Journal of Neuroscience. 1997;17:2738–2745. doi: 10.1523/JNEUROSCI.17-08-02738.1997. [DOI] [PMC free article] [PubMed] [Google Scholar]
- Reuter H. Measurements of exocytosis from single presynaptic nerve terminals reveal heterogeneous inhibition by Ca2+-channel blockers. Neuron. 1995;14:773–779. doi: 10.1016/0896-6273(95)90221-x. [DOI] [PubMed] [Google Scholar]
- Roche JP, Treistman SN. The Ca2+ channel β3 subunit differentially modulates G-protein sensitivity of α1A and α1B Ca2+ channels. Journal of Neuroscience. 1998;18:878–886. doi: 10.1523/JNEUROSCI.18-03-00878.1998. [DOI] [PMC free article] [PubMed] [Google Scholar]
- Stephens GJ, Brice NL, Berrow NS, Dolphin AC. Facilitation of rabbit α1B calcium channels: involvement of endogenous Gβγ subunits. Journal of Physiology. 1998;509:15–27. doi: 10.1111/j.1469-7793.1998.015bo.x. [DOI] [PMC free article] [PubMed] [Google Scholar]
- Takahashi T, Momiyama A. Different types of calcium channels mediate central synaptic transmission. Nature. 1993;366:156–158. doi: 10.1038/366156a0. [DOI] [PubMed] [Google Scholar]
- Tosetti P, Taglietti V, Toselli M. Action-potential-like depolarizations relieve opioid inhibition of N-type Ca2+ channels in NG108–15 cells. Pflügers Archiv. 1999;437:441–448. doi: 10.1007/s004240050799. [DOI] [PubMed] [Google Scholar]
- Toth PT, Miller RJ. Calcium and sodium currents evoked by action potential waveforms in rat sympathetic neurones. Journal of Physiology. 1995;485:43–57. doi: 10.1113/jphysiol.1995.sp020711. [DOI] [PMC free article] [PubMed] [Google Scholar]
- Waterman SA. Multiple subtypes of voltage-gated calcium channel mediate transmitter release from parasympathetic neurons in the mouse bladder. Journal of Neuroscience. 1996;16:4155–4161. doi: 10.1523/JNEUROSCI.16-13-04155.1996. [DOI] [PMC free article] [PubMed] [Google Scholar]
- Wheeler DB, Randall A, Tsien RW. Roles of N-type and Q-type Ca2+ channels in supporting hippocampal synaptic transmission. Science. 1994;264:107–111. doi: 10.1126/science.7832825. [DOI] [PubMed] [Google Scholar]
- Wheeler DB, Randall A, Tsien RW. Changes in action potential duration alter reliance of excitatory synaptic transmission on multiple types of Ca2+ channels in rat hippocampus. Journal of Neuroscience. 1996;16:2226–2237. doi: 10.1523/JNEUROSCI.16-07-02226.1996. [DOI] [PMC free article] [PubMed] [Google Scholar]
- Williams S, Serafin M, Muhlethaler M, Bernheim L. Facilitation of N-type calcium current is dependent on the frequency of action potential-like depolarizations in dissociated cholinergic basal forebrain neurons of the guinea pig. Journal of Neuroscience. 1997;17:1625–1632. doi: 10.1523/JNEUROSCI.17-05-01625.1997. [DOI] [PMC free article] [PubMed] [Google Scholar]
- Womack MD, McCleskey EW. Interaction of opioids and membrane potential to modulate Ca2+ channels in rat dorsal root ganglion neurons. Journal of Neurophysiology. 1995;73:1793–1798. doi: 10.1152/jn.1995.73.5.1793. [DOI] [PubMed] [Google Scholar]
- Wright CE, Angus JA. Effects of N-, P- and Q-type neuronal calcium channel antagonists on mammalian peripheral neurotransmission. British Journal of Pharmacology. 1996;119:49–56. doi: 10.1111/j.1476-5381.1996.tb15676.x. [DOI] [PMC free article] [PubMed] [Google Scholar]
- Wu LG, Saggau P. Adenosine inhibits evoked synaptic transmission primarily by reducing presynaptic calcium influx in area CA1 of hippocampus. Neuron. 1994;12:1139–1148. doi: 10.1016/0896-6273(94)90321-2. [DOI] [PubMed] [Google Scholar]
- Zamponi GW, Bourinet E, Nelson D, Nargeot J, Snutch TP. Crosstalk between G proteins and protein kinase C mediated by the calcium channel alpha1 subunit. Nature. 1997;385:442–446. doi: 10.1038/385442a0. [DOI] [PubMed] [Google Scholar]
- Zamponi GW, Snutch TP. Modulation of voltage-dependent calcium channels by G proteins. Current Opinion in Neurobiology. 1998;8:351–356. doi: 10.1016/s0959-4388(98)80060-3. [DOI] [PubMed] [Google Scholar]
- Zhang JF, Ellinor PT, Aldrich RW, Tsien RW. Multiple structural elements in voltage-dependent Ca2+ channels support their inhibition by G proteins. Neuron. 1996;17:991–1003. doi: 10.1016/s0896-6273(00)80229-9. [DOI] [PubMed] [Google Scholar]