

Abstract
It has been previously shown that the ‘large cell’ in the corpus glomerulosum (CG) of a teleost brain has a low-pass temporal filtering property. It fires a single spike only in response to temporally sparse synaptic inputs and thus extracts temporal aspects of afferent activities. To explore the ionic mechanisms underlying this property, we quantitatively studied voltage-gated Na+ channels of the large cell in the CG slice preparation of the marine filefish by means of whole-cell patch clamp recordings in the voltage-clamp mode. Recorded Na+ current was well described using the Hodgkin-Huxley ‘m3h’ model. It was revealed that the Na+ channels have a novel feature: remarkably slow recovery from inactivation. In other words, the time constant for the ‘h’ gate was extremely large (∼100 ms at −80 to −50 mV). In order to test whether the analysed Na+ current serves as a mechanism for filtering, the behaviour of the membrane model incorporating the Na+ channel was simulated using a computer program called NEURON. In response to current injections, the membrane model displayed low-pass filtering and firing properties similar to those reported in real cells. The present results suggest that slow removal of Na+ channel inactivation serves as a crucial mechanism for the low-pass temporal filtering property of the large cell. The simulation study also suggested that velocity and/or amplitude of a spike propagating though an axon expressing Na+ channels of this type could potentially be modulated depending on the preceding activities of the cells.
There is a large diversity in the firing properties of central neurons, and it has been a consensus that such diversity plays a critical role in brain functions. Kinetics, densities and distributions of ionic channels, as well as dendritic structures, are responsible for the firing properties of neurons (Migliore et al. 1995; Mainen & Sejnowski, 1996). Corpus glomerulosum (CG), a large thalamic nucleus characteristically found in some teleost brains, may be an excellent experimental model to study information processing with firing properties of the constituent cells. It has several morphological advantages such as the small number (2 types) of constituent cell types, clearly layered nuclear structure, well-defined afferent-efferent fibre connections and extremely giant postsynaptic dendrites in glomeruli. These enable experimental analyses including optical imaging at a single cell resolution as well as conventional electrophysiology (Tsutsui et al. 2001a, b; see also Ito & Kishida, 1975, 1977; Sakamoto & Ito, 1982, for the anatomy). The CG has two types of constituent cells, the ‘large cell’ and the ‘small cell’. It has previously been shown that the large cell has a characteristic low-pass temporal filtering property; it fires single spikes only in response to temporally sparse synaptic inputs and thus encodes temporal aspects of afferent activities, while the small cell fires a short spike train whose frequency depends on the input strength even in response to fast synaptic inputs (Tsutsui et al. 2001b). It was reported there that the half-recovery time of the spike amplitude in the large cell was ∼75 ms, which is remarkably longer than the conventional ‘refractory period’ of an action potential (see Fig. 1, modified from Fig. 11 of Tsutsui et al. 2001b). Since the stimulation protocol used there did not evoke short-term synaptic depression (Tsutsui et al. 2001b), a certain postsynaptic ionic mechanism should underlie this property. Neither long-lasting changes in resting membrane potential nor conductance was detected after an action potential (Tsutsui et al. 2001b), and the firing property studied with current injections was unaffected in the absence of external Ca2+ (authors’ unpublished observations). These findings suggest that K+ or Ca2+ channels are not likely candidates for the ionic mechanisms underlying the temporal filtering property of the large cell. They rather suggest that Na+ channels responsible for the generation of action potentials may be involved in this long refractory period. In the present study, we performed a quantitative analysis of kinetics of voltage-dependent Na+ current employing the Hodgkin-Huxley (HH) model. We found voltage-dependent Na+ channels that recover from inactivation extremely slowly which serve as a crucial mechanism for the low-pass temporal filtering property of the cell.
Figure 1. Low-pass temporal filtering property of the CG large cell.
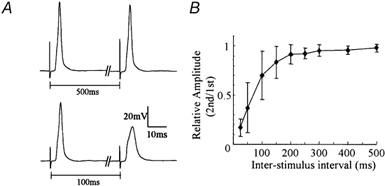
A, postsynaptic voltage response at the large cell soma evoked by paired stimulation of the afferent fibres with an interval of 500 (top) and 100 ms (bottom). Note that the second stimulation evoked an almost full-amplitude spike in the top but only an attenuated spike in the bottom. B, a plot of relative amplitudes of the second responses versus interstimulus intervals. (This illustration is modified from from a previous report, Tsutsui et al. 2001b).
METHODS
Slice preparations
Adult filefish, Stephanoplepis cirrhifer (15–22 cm in total length) were deeply anaesthetized by immersion in seawater containing tricaine methane sulfonate (MS222, 150 mg l−1, Sigma) and killed by decapitation. Frontal CG slices (250 μm in thickness) were prepared as described in Tsutsui et al. (2001b). The low Na+ solution (composition (mm): NaCl 0, KCl 4.0, MgCl2 8.5, MgSO4 1.0, CaCl2 0.17, NaHCO3 26, NaH2PO4 1.0, glucose 10, sucrose 210) was used for slicing in order to reduce excitotoxic damage (Aghajanian & Rasmussen, 1989). Slices were allowed to recover for at least 1 h before use in the standard artificial cerebrospinal fluid (composition (mm): NaCl 126, KCl 4.0, MgSO4 1.0, CaCl2 1.7, NaHCO3 26, NaH2PO4 1.0, glucose 10). All the external solutions (including the experimental solution, see below) were continuously bubbled with 95 %O2-5 %CO2 gas. All the experiments were performed at room temperature (∼20 °C).
Electrophysiology
Slices were placed in an immersion-type recording chamber. Whole-cell patch clamp recordings (Hamill et al. 1981) were made from large cells, which were visually identified under an upright microscope equipped with a water-immersion objective lens (× 40, 0.80 NA), differential interference contrast (DIC) optics and a CCD camera. Patch pipettes were pulled from borosilicate glass capillaries of 1.5 mm outer diameter (Narishige, Tokyo, Japan) using a Flaming-Brown microelectrode puller (P-97; Sutter Instruments, CA, USA). Pipette solution contained (mm): KCl 140, EGTA 10, MgCl2 2, Na2ATP 2, Hepes 10 (pH 7.3). The external solution for Na+ current recordings contained (mm): NaCl 47, choline chloride 47, TEA-Cl 30, 4-aminopyridine (4AP) 5, KCl 4, MgSO4 1.0, CaCl2 1.7, NiCl2 1.5, LaCl3 0.005, NaHCO3 26, NaH2PO4 1.0, glucose 10 (pH was neutralized prior to addition of NaHCO3 and subsequent bubbling with 95 %O2-5 %CO2). Na+ concentration was lowered to reduce the amplitude of Na+ currents and to improve the space clamp conditions. Because substantial external Ca2+ seemed to be required for stable recording of the cells and no significant contamination of the Ca2+ current was observed (Fig. 2A), Ca2+ was not omitted in the external solution. The Ca2+ channel blockers, Ni2+ and La3+, were added instead. The tip resistance of patch pipettes was ∼4 MΩ. Recordings were performed with a patch-clamp amplifier, Axopatch 200B (Axon Instruments, CA, USA), and currents were filtered at 10 kHz by low-pass four-pole Bessel filter and digitized at 10–100 kHz using pCLAMP software (Axon Instruments). Leak currents were subtracted either manually or using a P/4 protocol. Data analysis was performed using custom-made software written in the Interactive Data language (IDL5.3, Research Systems, CO, USA) and Clampfit (Axon Instruments, CA, USA). The Levenberg-Marquardt algorithm (Press et al. 1993) was employed for curve fittings. Numerical data are represented as means ± s.d.
Figure 2. Na+ currents in the CG large cells.
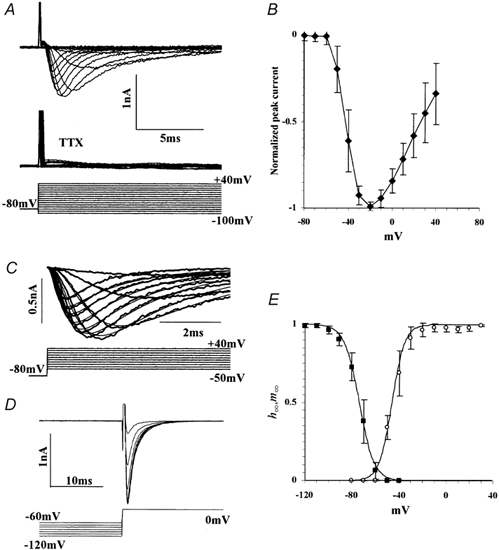
A, upper traces, Na+ currents evoked by voltage commands indicated by bottom traces. The currents were completely blocked by 500 nm TTX (middle traces). B, current-voltage (I-V) relationships of the Na+ current normalized by the maximum peak currents (mean ± s.d., n = 9). C, the evoked currents were well fitted with the Hodgkin-Huxley m3h model (thin lines). Thick lines with some noise indicate the experimental data. D, current responses elicited by voltage commands to 0 mV from various holding potentials. E, steady state of activation (m∞; open circles, n = 6) and inactivation (h∞; filled squares, n = 7) as a function of voltage. Continuous lines indicate the curves fitted with a single Boltzmann function. The activation and inactivation curves were best fitted with: 1/(1 + exp((−46.0 - v)/5.33)) and 1/(1 + exp((v+ 73.8)/6.31)), respectively.
Computer simulations
The behaviour of the membrane incorporating the Na+ channel model was simulated using NEURON software (Hines, 1993, http://neuron.duke.edu/). The original Na+ channel model with experimentally derived kinetics (see Fig. 5) was described using NMODL (neuron model description language, Hines & Carnevale, 2000). As counteracting K+ channels, a built-in NEURON mechanism for the voltage-dependent K+ channel in the squid giant axon membrane, which was originally described by Hodgkin & Huxley (1952), was also incorporated in the membrane model. The HH-type K channel employed ‘n4’ kinetics, and the forward and backward rate constants for ‘n’ were −0.01(v + 55)/(exp(-(v + 55)/10) − 1), and 0.125exp(-(v + 65)/80) in [ms−1], respectively, where v represents membrane potential (expressed in mV). Three different membrane models, a ‘soma’, a ‘soma + unmyelinated axon’ and a ‘soma + myelinated axon’ model were studied. Since it is not yet known if the axon of the large cell is myelinated or not, and it is difficult to study the axon directly, an axonal model similar to the one described in the mitral cell (Shen et al. 1999) was used for the ‘myelinated axon’, which consisted of an ‘initial segment’ and 5x ‘internode + node’. According to the previous modelling studies (Shen et al. 1999; Tsutsui & Oka, 2001), dimensions, passive membrane parameters and channel densities of each compartment were set as shown in Table 1. Although the effect of changing the channel densities of ‘soma’ was examined in some simulations where noted, densities at the ‘soma’ were usually set at 36 and 24 mS cm−2 for the Na+ and K+ channel, respectively. With this combination of channel densities, the ‘soma’ exhibited a Na+ current of ∼1 nA for a voltage step to 0 mV from −80 mV in the voltage-clamp condition, and the action potential duration was also close to that of the real spike (∼7 ms) in the current-clamp condition. Equilibrium potentials for leak conductance, Na+ channel, and K+ channel were set throughout the cell at −70, +50 and −77 mV, respectively. An excitatory synapse modelled by an alpha function (Koch & Segev, 1998) with time constant of 0.1 ms was introduced to the centre of the ‘soma’ in some simulations. Synaptic conductance was set to the threshold value that evoked an action potential in each membrane model (0.05–0.07 μS). Computation was carried out with an integration time step of 25 μs on a PC with a 1.1 GHz processor.
Figure 5. Rate constants and continuous kinetic parameters for the channel model.
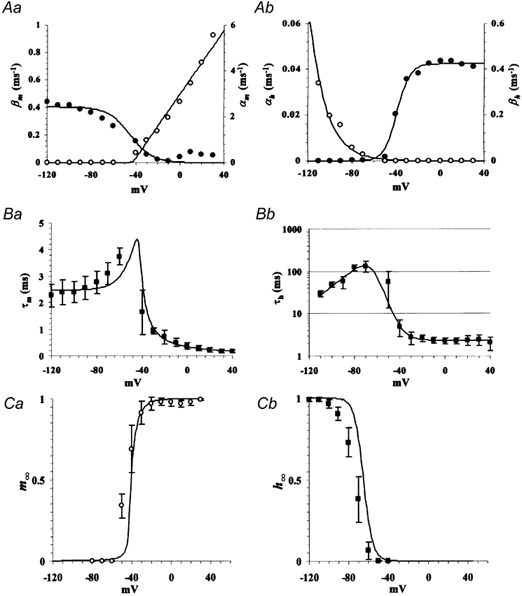
A, plots of forward (α, open circles) and backward (β, filled circles) rate constants for the activation (a) and inactivation (b) gates as a function of membrane voltage. Continuous lines indicate curves fitted by: αm= 0.035(v+ 42.3) + (0.0123(v+ 42.3)2+ 5.00 × 10⁻³)0.5; βm= 0.404(1 − 1/(1 + exp((−44.7 −v)/10.0))); αh= 1.87 × 10⁻⁴exp(v/−20.8); βh= 0.424(1 − 1/(1 + exp((v+ 38.8)/5.75))). B, continuous τm and τh reconstructed from the fittings in A (continuous lines). C, continuous m∞ and h∞ reconstructed from the fittings in A (continuous lines). Experimentally measured data points (as in Figs 2–4) are also plotted together in B and C.
Table 1.
Parameters for the compartments
| Soma | UA | IS | Internode | Node | |
|---|---|---|---|---|---|
| Diameter (μm) | 25 | 0.8 | 1.5 | 1.5 | 1 |
| Length (μm) | 30 | 2000 | 20 | 1000 | 1 |
| Gm (mS cm−2) | 0.15 | 0.15 | 1 | 0.001 | 1 |
| Cm (μF cm−2) | 1 | 1 | 1.2 | 0.012 | 1.2 |
| Ra (Ωcm) | 100 | 100 | 70 | 70 | 70 |
| g¯Na (mS cm−2) | 30–48 | 36 | 1010 | 0 | 1010 |
| g¯K (mS cm−2) | 16–32 | 24 | 10 | 0 | 10 |
UA, unmyelinated axon; IS, initial segment; Gm, membrane conductance; Cm, membrane capacitance; Ra, axial resistance; g¯Na, Na+ channel density; g¯K, K+ channel density.
RESULTS
The series resistance, membrane resistance and capacitance in the whole-cell recordings were calculated from current responses with voltage steps to −100 mV from the holding potential (Vh) of −80 mV. They were 12.1 ± 2.85 MΩ ((mean ± s.d.), 208 ± 115 MΩ and 36.5 ± 16.3 pF, respectively (n = 36). Holding currents at a Vh of −80 mV were 259 ± 146 pA (n = 36). Series resistances were compensated for 50–60 %. The liquid junction potential of the pipette solution to the external solution (Neher, 1992) was as small as −3.2 mV. Furthermore, this junction potential counteracted the voltage error due to the uncompensated series resistance (∼5 MΩ), which was estimated to be around ∼0.8 mV (5 MΩ × 250 pA) at a holding potential of −80 mV, and ∼5 mV when an inward current of 1 nA was evoked. Therefore, we neglected these voltage artifacts and did not carry out any corrections.
We discarded neurons recorded under poor voltage clamp, which was evident because of a delayed onset and absence of graded increments of evoked Na+ currents during voltage steps close to the firing threshold (Cummins et al. 1994). Maximum amplitudes of the elicited Na+ currents ranged from 0.7–2.5 nA in most cells, and satisfactory voltage clamp was usually achievable in the cells that exhibited currents smaller than 1.5 nA.
Na+ current in the CG large cell
Rapidly activating and inactivating currents were elicited by depolarizing voltage command (≥-50 mV) from a Vh of −80 mV (Fig. 2A). A current-voltage (I-V) curve for the peak current is plotted in Fig. 2B (normalized to the peak inward currents; peak = 1.06 ± 0.32 nA, n = 9). The reversal potential of this current estimated by extrapolating the I-V curve was approximately +73 mV, which was very close to the equilibrium potential for Na+ calculated by the Nernst equation (73.15 mV; T = 20 °C). Furthermore, this current was completely blocked by tetrodotoxin (TTX, 500 nm, n = 5; Fig. 2A), a blocker for the voltage-dependent fast Na+ channel. Therefore, it is concluded that the current is the voltage-dependent fast Na+ current, and there is no significant contamination of other current components. We then searched for an appropriate description of these currents using the Hodgkin-Huxley model (Hodgkin & Huxley, 1952). According to this model, the time course of the Na+ current (INa) can be described as:
| (1) |
| (2) |
| (3) |
where t is time, v membrane potential, gNa the maximum conductance of the Na+ channels which should be achieved in the absence of inactivation, vNa the reversal potential for INa, and m and h are dimensionless parameters for activation and inactivation, respectively. As in eqns (2) and (3), m and h undergo first-order transitions between permissive and non-permissive states with forward (α) and backward (β) rate constants, which are functions of membrane potential. Under conditions where membrane potential is clamped (dv/dt = 0), m and h change exponentially with time as:
| (4) |
| (5) |
where τm = 1/(αm + βm), τh = 1/(αh + βh), m0 and h0 are values at t = 0, m∞ and h∞ are steady-state values, which are given by αm/(αm + βm) and αh/(αh + βh), respectively. When depolarizing voltage commands applied from a hyperpolarized holding potential (−80 mV) elicit a substantial INa, m0 and h∞ are close to 0. Considering eqns (1), (4) and (5), the evoked currents are modelled as:
| (6) |
where A = gNam∞xh0(v - vNa). We searched for an appropriate ‘x’ by fitting currents elicited by voltage steps to between −30 and +40 mV from a Vh of −80 mV, normalized and then averaged for three cells with eqn (6). The ‘x’ that gave the best fit was 3.1 ± 0.42 (range 2.52–3.45). Since ‘x’ indicates the number of activation gates and is conventionally an integer, we concluded that Na+ current in the CG large cell is best described by m3h kinetics. Then, the elicited currents were fitted with the equation:
| (7) |
and values for m∞, τmand τh at each potential were determined (Fig. 2C). In order to determine h∞ at membrane potentials more negative than −50 mV, voltage steps from holding potentials (−120 to −60 mV) to 0 mV were applied. Under these conditions, m0, m∞, h∞ and h0 at 0 mV can be approximated to 0, 1, 0 and h∞(Vh) (i.e. h∞ at the holding voltage prior to the step), respectively. Therefore, the currents can be described as:
| (8) |
Where τm and τh are time constants at 0 mV. Since h∞(Vh) in eqn (8) is the only parameter that is a function of the holding voltage, the peak current can be directly compared to determine h∞ at various holding voltages (Fig. 2D). Thus, the steady state of each gate as a function of membrane potential was determined as shown in Fig. 2E.
Next, τm at a membrane potential more negative than −60 mV was quantified from the deactivation time course of INa. Commands to various voltages (−60 to −120 mV) were applied immediately (2 ms) after the voltage pulse to 0 mV from a Vh of −80 mV (Fig. 3A). In the final voltage step, m∞ is approximately 0, thus the elicited Na+ current can be described as:
| (9) |
Figure 3. Voltage dependence of τm.
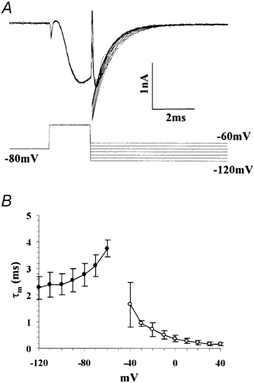
A, deactivation protocol to measure τm at voltages negative to −60 mV where τh is large enough (see text). Curves fitted to the deactivating currents with a single exponential function are superimposed with the current traces. B, plot of τm as a function of voltage. Filled squares indicate values calculated from deactivation time course shown in A (n = 6). Open circles indicate values determined by fitting activating currents as shown in Fig. 2C (n = 6).
Since τh is much larger than τm (see below) and the last term changes more slowly, the time course of INa can be approximated by an exponential decay with the time constant of τm/3. Thus, τm can be quantified by exponential fittings of INa decay (Fig. 3B). Then, τh at these voltages was quantified by the time course of recovery from inactivation. Double voltage pulses to 0 mV (20 ms in duration) with different interpulse intervals (T) were applied (Fig. 4A). Since by the first pulse, h reaches h∞ at 0 mV, which is approximately 0, the INa elicited by the second pulse can be described as:
| (10) |
Figure 4. Voltage dependence of τh.
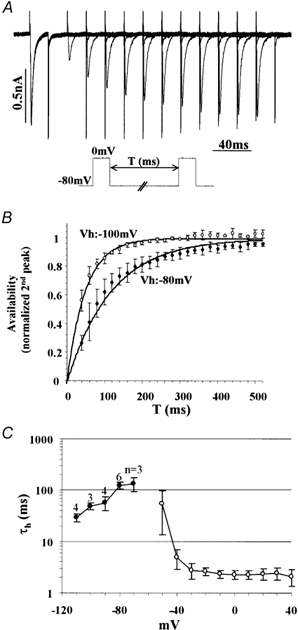
A, time course of recovery from inactivation was measured by the double depolarizing command pulses to 0 mV (pulse duration, 20 ms). Multiple traces of different interpulse intervals (T) are superimposed. B, plot of the availability of INa (second peak/first peak) versus T at the holding potential of −80 mV (filled squares, n = 6) and −100 mV (open circles, n = 3). Continuous lines indicate curves fitted by a single exponential function. C, plot of τh as a function of voltage. Filled circles indicate values determined by the time course of recovery from inactivation of INa(n as specified in the figure). Open circles indicate values determined by fitting activating currents as shown in Fig. 2C (n = 6).
Where τh(Vh) is τh at the holding voltage between the pulses. Because the first term is the only term that is a function of T in eqn (10), τh(Vh) was directly determined with exponential fitting of a T-normalized 2nd peak curve (Fig. 4B and C). It was revealed that INa has remarkably large τh especially at the voltages around −80 to −50 mV (τh, ∼100 ms), which leads to an extremely slow recovery from inactivation as seen in Fig. 4A. Forward (α) and backward (β) rate constants for m and h were calculated from the steady states and time constants (Fig. 5A, using relations: αm = m∞ /τm; βm= (1 - m∞)/τm; etc.).
Modelled Na+ currents in simulated membranes
In order to verify whether the kinetic property of INa revealed thus far serves as a mechanism for the low-pass temporal filtering property of the large cell, we next expressed Na+ channel model with the experimentally derived kinetics in simulated cell membranes and examined the behaviour of the membrane. Rate constants for m and h were fitted with a continuous function of voltage. Boltzmann functions were used for fitting βm and βh, and an exponential function for αh, and a hyperbola for αm (see legend to Fig. 5 for parameters). As a result, the time constant and steady state of each gate as a continuous function of voltage could be reconstructed (Fig. 5B and C), which are close to the experimental data shown above. The minor mismatches are inevitable errors due to approximation of the experimentally measured rate constants with the very simple functions.
A Na+ channel model was described with NMODL using the continuous functions of rate constants and was incorporated into the three membrane models together with a conventional Hodgkin-Huxley type K+ channel model (see Methods and Table 1 for parameters). First, we started with a channel density of 36 and 24 mS cm−2 for the Na+ and K+ channel, respectively, and examined the voltage responses with current injections and synaptic stimulations in the single compartmental ‘soma’ model. The membrane model fired a single action potential in response to suprathreshold current injections, and injections with larger amplitudes never lead to repetitive firings but always evoked a single spike (Fig. 6A). Thus, the modelled cell had qualitatively very similar firing property to that described in the real large cell (Tsutsui et al. 2001b). Some minor difference between the responses in the real cell and those in the model, including the non-linearity of the persistent responses in the model, were probably due to the different kinetics of K+ channels from those in the real cell and/or the effects of omitting other types of voltage-dependent channels. The ‘soma’ model was then stimulated with a pair of synaptic inputs of different interstimulus intervals (ISIs). Figure 6Ba shows superimposed responses, and the normalized second peaks are plotted in Fig. 6Bb. As shown here, the second responses with intervals < 200 ms were attenuated, and the attenuation gradually changed as a function of ISI, which is very similar to those in real cells as shown in Fig. 1B. Thus, the temporal filtering property was well reconstructed in a simple simulated membrane. Therefore, we conclude that the analysed Na+ channels with slow de-inactivation serves as a crucial mechanism for the low-pass temporal filtering property in the large cell.
Figure 6. Behaviour of single compartment membrane model incorporating the Na+ channel model.
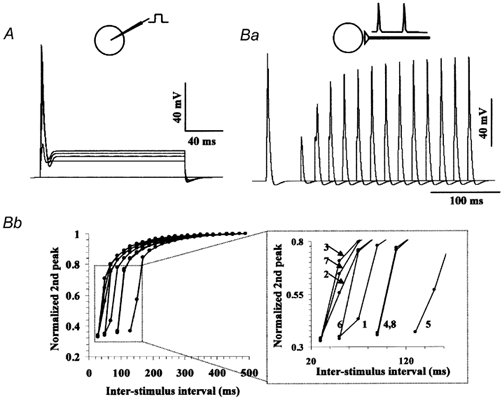
A, simulated voltage responses elicited by current injections (0 to 1.6 nA, 0.4 nA increments). Multiple traces are superimposed in A and Ba. Ba, simulated voltage responses elicited by paired excitatory synaptic inputs with different interstimulus intervals. The channel densities were 36 and 24 mS cm−2 for the Na+ and K+ channels, respectively. Bb, plot of normalized amplitudes of the responses evoked by the second synaptic input versus the interstimulus intervals (ISI), which shows the low-pass temporal filtering properties. Plots for eight different combinations of channel densities are shown. An enlarged view of the dotted square is shown on the right. The channel densities were as follows (Na+ and K+ channel, respectively, expressed in mS cm−2): (1) 36, 24; (2) 36, 20; (3) 36, 16; (4) 36, 28; (5) 36, 32; (6) 42, 24; (7) 48, 24; (8) 30, 24.
Since it is generally believed that spike propagation through an axon occurs in all-or-none fashion, an interesting question now arises: can the attenuated spikes propagate through the axon or do they fail to propagate? Alternatively, do they eventually recover to full amplitudes as they propagate through the axon? We studied this question using the ‘soma + unmyelinated axon’ and ‘soma + myelinated axon’ models (Fig. 7). The ‘soma’ was stimulated by a pair of synaptic inputs with different ISIs as we did in Fig. 6B. In the unmyelinated axon with short ISIs, a heavily attenuated spike evoked by the second synaptic inputs got more attenuated as it propagated though the axon and could propagate only for a short distance along the axon (Fig. 7Aa and b). This occurs when the recovery from inactivation of Na+ channel is less than the lowest level needed for active propagation though the axon. On the other hand, a slightly attenuated spike due to long ISIs could propagate through an axon without being attenuated any more (Fig. 7Ac). In this case, the axon has low densities of Na+ channels but still capable of being propagated actively. It should be also noted that propagation velocity is slower than that in the axon in which the channels are fully recovered (Fig. 7Ad). In the myelinated axon, a heavily attenuated response at the ‘soma’ also failed to propagate actively (Fig. 7Ba). A slightly attenuated spike, which resulted in regenerative activation at the ‘initial segment’ and subsequent ‘nodes’, could propagate through the axon. Contrary to the situation in the unmyelinated axon, the spike amplitude recovered as it propagated, and consequently little dependence on the ISI was observed in the spike amplitude when it reached the axon terminal (Fig. 7Bb-d). Since internodes in a myelinated axon have low axial- and high membrane resistance, input resistance at a node depends on its position (higher at a segment near the terminal). This is probably why the attenuated spike recovers as it propagates to the terminal in certain conditions. As in the unmyelinated axon, the ISI affected the propagation velocity, making it slower in the poorly recovered axons (Fig. 7Bb-d).
Figure 7. Propagation of attenuated spikes along the axons.
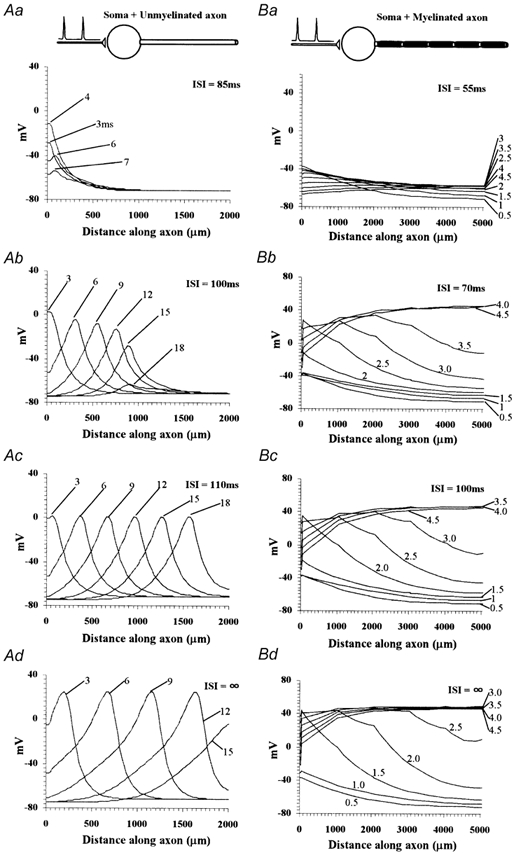
A pair of synaptic inputs with different ISIs were given to the ‘soma’ of the ‘soma + unmyelinated axon’ (A) and ‘soma + myelinated axon’ (B) models. ‘Snap shots’ of voltage profiles along the axon at various times (indicated in ms to right of each trace) after the onset of second synaptic input. Note that response for ‘ISI =∞’ is the same as that evoked by the first synaptic input, since ISI is long enough for all the parameters to reach their steady states.
DISCUSSION
In this study, voltage-dependent Na+ current in the CG large cell was quantitatively analysed using the Hodgkin-Huxley model. We found that the current has an outstanding feature: slow removal of inactivation (de-inactivation). Furthermore, a simulation study clearly demonstrated that the Na+ current serves as a mechanism for the low-pass filtering property in the large cell.
Novel kinetics
Large τh is the most important factor that characterizes the nature of the novel Na+ channel in the large cell. Slow recovery from inactivation and accumulating inactivation in Na+ channels have been described in several preparations including skeletal muscle, squid axon, suprachiasmatic neuron, neocortical neurons and hippocampal neurons (Moore et al. 1964; Rudy, 1978; Ruff et al. 1988; Huang, 1993; Fleidervish et al. 1996). However, the properties of the Na+ current studied in the present paper fundamentally differ from those of any previously described channels. The previously described channels require sustained or repeated depolarizing pulses to enter the fully inactivated states. For this reason, the physiological significance of the slow inactivation in these channels has been sometimes uncertain (Cannon, 1996), although it was shown later in the hippocampal pyramidal neurons that slow recovery from inactivation of Na+ channels underlies the activity-dependent attenuation of dendritic action potentials (Colbert et al. 1997; Jung et al. 1997). In contrast, the τh of INa in the CG large cell at positive voltages is small enough to rapidly enter the inactivated state during a single action potential (Fig. 4C). This is why inactivation kinetics of the Na+ channels in the CG large cell has a direct physiological significance. The present study also shows that τm of CG large cells is also larger in negative voltages than that of conventional fast Na+ channels. It is ∼4 times larger at −50 mV than that in the classical squid Na+ channel recorded at ∼6 °C (Hodgkin & Huxley, 1952) and is much larger than that in the human hippocampal granule cell recorded at ∼10 °C (Reckziegel et al. 1998). It should be mentioned that in this study τm at the negative voltage was determined by multiplying the time constant of deactivating current by 3 because we assumed m3h kinetics as explained in eqn (9). However, in some papers (e.g. Ogata & Tatebayashi, 1993) the deactivation time courses are sometimes directly regarded as the activation time constant at respective voltages. Thus, care should be taken when we compare parameters for the activation kinetics. Although the physiological significance of activation kinetics is less direct than that of inactivation, it affects the threshold and shape of an action potential and thus may have a secondary effect on the activation of other voltage-dependent channels.
Voltage-dependent Na+ channels are heteromeric complexes consisting of a large pore-forming α-subunit and one or more small auxiliary β-subunits (Catterall, 1991). The combination of site-directed mutagenesis and electrophysiology has been a powerful tool to enable understanding of the structural basis and molecular mechanisms governing the Na+ channel function. The Na+ channels in the CG large cell have novel kinetics as demonstrated in the present study. Therefore, molecular cloning of the Na+ channels expressed in the CG large cell could prove interesting for future studies; these could enable us to obtain new material that contributes to our understanding of the structure-function relationship of the channels, especially in relation to the inactivation mechanisms.
Functional significance
One of the most critical functional significances of the Na+ channels in the CG large cell is that the channels amplify only the postsynaptic potentials that occur after a substantial time delay and extract the temporally slow component of the afferent neuronal activities (low-pass filtering). Other physiological features of the large cells are that the cells fire only a single spike in response to strong current injections or synaptic inputs, and that the duration of the action potential is relatively long (Tsutsui et al. 2001b). These physiological features cannot be explained by the morphology of the large cell (Tsutsui & Oka, 2001) but are well explained by the ‘large τh’ of the Na+ channel. Preliminary experiments show that Na+ channels in the small cells recover from inactivation much faster than those in the large cells. This is in good agreement with the physiology of the small cells, which generate a spike train whose frequency is dependent on the intensity of the synaptic inputs (Tsutsui et al. 2001b). Therefore, in the CG, the difference in the kinetics of Na+ channels in the two types of constituent cells may essentially account for the difference in the membrane properties and resultant encoding properties of the corticalis activities.
The soma of the large cell is connected to a large dendritic tip in the glomerulus with a long dendritic stalk (Ito & Kishida, 1975; Tsutsui et al. 2001b). It was regarded that the large cell received most of the synaptic inputs from horizontal commissure fibres at electronically passive tips, and that synaptic potentials propagate though the stalk to the soma (Sakamoto & Ito, 1982; Tsutsui et al. 2001b; Tsutsui & Oka, 2001). It has not yet been shown whether the whole dendritic stalk, or part of it, is also passive or not. If the stalk has an active conductance(s), the possibility that failure of active propagation of excitatory postsynaptic potential though the stalk may also contribute to the filtering property cannot be excluded. In this case, even though the slowly de-inactivating Na+ channel may play a major role in the stalk as in the soma, a possible involvement of other ionic mechanisms cannot be excluded. In order to address this question, direct recordings from the dendritic stalk might be required.
Spike propagation through axons
It is generally believed that spike propagations through the axons occur in an all-or-none fashion, while the efficacy of synaptic transmission can be modulated depending on the preceding activities. However, the present study very clearly suggests that in the unmyelinated axon model in which the Na+ channels (as in the large cell soma) are expressed uniformly, spike amplitude and propagation velocity can be modulated depending on the channel's state, in other words on the preceding activities, of the cell (Fig. 7A). In the myelinated axon model, it was suggested that an attenuated spike recovers its amplitude as it propagates, and that the propagation velocity can also be modulated (Fig. 7B). These predictions should provide a good basis for an interesting future study to observe spike propagation though the large cell axon with an optical recording technique using a voltage-sensitive dye (Antic et al. 1999).
Strictly speaking, the present results also imply that such modulation can potentially take place also in the normal axons, even though a time window for modulation might be much shorter. Since it has been recently proposed that information may be coded by the timing of spike discharges among numbers of neurons in the central nervous system (Mainen & Sejnowski, 1995; Riehle et al. 1997), these results might imply that modulation of axonal propagation should be also taken into account for the study of information processing in the nervous system.
Acknowledgments
We thank Dr Y. Okamura for helpful discussions and Drs H. Ito and N. Yamamoto for encouragement. This work was supported by Grants-in-Aid from the Ministry of Education, Culture, Sports, Science and Technology (MEXT) of Japan to Y.O. (No. 12053215) and Research Fellowships of the Japan Society for Promotion of Science for Young Scientists to H.T.
REFERENCES
- Aghajanian GK, Rasmussen K. Intracellular studies in the facial nucleus illustrating a simple new method for obtaining viable motoneurons in adult rat brain slices. Synapse. 1989;3:331–338. doi: 10.1002/syn.890030406. [DOI] [PubMed] [Google Scholar]
- Antic S, Major G, Zecevic D. Fast optical recordings of membrane potential changes from dendrites of pyramidal neurons. Journal of Neurophysiology. 1999;82:1615–1621. doi: 10.1152/jn.1999.82.3.1615. [DOI] [PubMed] [Google Scholar]
- Cannon SC. Slow inactivation of sodium channels: more than just a laboratory curiosity. Biophysical Journal. 1996;71:5–7. doi: 10.1016/S0006-3495(96)79203-2. [DOI] [PMC free article] [PubMed] [Google Scholar]
- Catterall WA. Structure and function of voltage-gated sodium and calcium channels. Current Opinion in Neurobiology. 1991;1:5–13. doi: 10.1016/0959-4388(91)90004-q. [DOI] [PubMed] [Google Scholar]
- Colbert CM, Magee JC, Hoffman DA, Johnston D. Slow recovery from inactivation of Na+ channels underlies the activity-dependent attenuation of dendritic action potentials in hippocampal CA1 pyramidal neurons. Journal of Neuroscience. 1997;17:6516–6521. doi: 10.1523/JNEUROSCI.17-17-06512.1997. [DOI] [PMC free article] [PubMed] [Google Scholar]
- Cummins TR, Xia Y, Haddad GG. Functional properties of rat and human neocortical voltage-sensitive sodium currents. Journal of Neurophysiolgy. 1994;71:1052–1064. doi: 10.1152/jn.1994.71.3.1052. [DOI] [PubMed] [Google Scholar]
- Fleidervish IA, Friedman A, Gutnick MJ. Slow inactivation of Na+ current and slow cumulative spike adaptation in mouse and guinea-pig neocortical neurones in slices. Journal of Physiology. 1996;493:83–97. doi: 10.1113/jphysiol.1996.sp021366. [DOI] [PMC free article] [PubMed] [Google Scholar]
- Hamill OP, Marty A, Neher E, Sakmann B, Sigworth FJ. Improved patch-clamp techniques for high-resolution current recording from cells and cell-free membrane patches. Pflüger's Archiv. 1981;391:85–100. doi: 10.1007/BF00656997. [DOI] [PubMed] [Google Scholar]
- Hines M. NEURON-a program for simulation of nerve equations. In: Eeckman F, Norwell MA, editors. Neural Systems: Analysis And Modeling. Kluwer Academic Publishers; 1993. pp. 127–136. [Google Scholar]
- Hines ML, Carnevale NT. Expanding NEURON's Repertoire of Mechanisms with NMODL. Neural Computation. 2000;12:839–851. doi: 10.1162/089976600300015475. [DOI] [PubMed] [Google Scholar]
- Hodgkin AL, Huxley AF. A quantitative description of membrane current and its application to conduction and excitation in nerve. Journal of Physiology. 1952;117:500–544. doi: 10.1113/jphysiol.1952.sp004764. [DOI] [PMC free article] [PubMed] [Google Scholar]
- Huang RC. Sodium and calcium currents in acutely dissociated neurons from rat suprachiasmatic nucleus. Journal of Neurophysiology. 1993;70:1692–1703. doi: 10.1152/jn.1993.70.4.1692. [DOI] [PubMed] [Google Scholar]
- Ito H, Kishida R. Organization of the teleostean nucleus rotundus. Journal of Morphology. 1975;147:89–108. doi: 10.1002/jmor.1051470107. [DOI] [PubMed] [Google Scholar]
- Ito H, Kishida R. Synaptic organization of the nucleus rotundus in some teleosts. Journal of Morphology. 1977;151:397–418. doi: 10.1002/jmor.1051510306. [DOI] [PubMed] [Google Scholar]
- Jung HY, Mickus T, Spruston N. Prolonged sodium channel inactivation contributes to dendritic action potential attenuation in hippocampal pyramidal neurons. Journal of Neuroscience. 1997;17:6639–6646. doi: 10.1523/JNEUROSCI.17-17-06639.1997. [DOI] [PMC free article] [PubMed] [Google Scholar]
- Koch C, Segev I, editors. Methods in Neuronal Modeling. Cambridge, MA, USA: MIT Press; 1998. [Google Scholar]
- Mainen ZF, Sejnowski TJ. Reliability of spike timing in neocortical neurons. Nature. 1995;268:1503–1506. doi: 10.1126/science.7770778. [DOI] [PubMed] [Google Scholar]
- Mainen ZF, Sejnowski TJ. Influence of dendritic structure on firing pattern in model neocortical neurons. Nature. 1996;382:363–366. doi: 10.1038/382363a0. [DOI] [PubMed] [Google Scholar]
- Migliore M, Cook EO, Jaffe DB, Turner DA, Johnston D. Computer simulations of morphologically reconstructed CA3 hippocampal neurons. Journal of Neurophysiology. 1995;73:1157–1168. doi: 10.1152/jn.1995.73.3.1157. [DOI] [PubMed] [Google Scholar]
- Moore JW, Narahashi T, Ulbricht W. Sodium conductance shift in an axon internally perfused with a sucrose and low-potassium solution. Journal of Physiology. 1964;172:163–173. doi: 10.1113/jphysiol.1964.sp007410. [DOI] [PMC free article] [PubMed] [Google Scholar]
- Neher H. Correction for liquid junction potentials in patch clamp experiments. Methods in Enzymology. 1992;207:123–131. doi: 10.1016/0076-6879(92)07008-c. [DOI] [PubMed] [Google Scholar]
- Ogata N, Tatebayashi H. Kinetic analysis of two types of Na+ channels in rat dorsal root ganglia. Journal of Physiology. 1993;466:9–37. [PMC free article] [PubMed] [Google Scholar]
- Press WH, Teukolsky SA, Vetterling WT, Flannery BP. Numerical Recipes in C: The Art of Scientific Computing. Cambridge, UK: Cambridge University Press; 1993. pp. 683–688. [Google Scholar]
- Reckziegel G, Beck H, Schramm J, Elger CE, Urban BW. Electrophysiological characterization of Na+ currents in acutely isolated human hippocampal dentate granule cells. Journal of Physiology. 1998;509:139–150. doi: 10.1111/j.1469-7793.1998.139bo.x. [DOI] [PMC free article] [PubMed] [Google Scholar]
- Riehle A, Grun S, Diesmann M, Aertsen A. Spike synchronization and rate modulation differentially involved in motor cortical function. Science. 1997;278:1950–1953. doi: 10.1126/science.278.5345.1950. [DOI] [PubMed] [Google Scholar]
- Rudy B. Slow inactivation of the sodium conductance in squid giant axons: pronase resistance. Journal of Physiology. 1978;283:1–21. doi: 10.1113/jphysiol.1978.sp012485. [DOI] [PMC free article] [PubMed] [Google Scholar]
- Ruff RL, Simoncini L, Stuhmer W. Slow sodium channel inactivation in mammalian muscle: a possible role in regulating excitability. Muscle Nerve. 1988;11:502–510. doi: 10.1002/mus.880110514. [DOI] [PubMed] [Google Scholar]
- Sakamoto N, Ito H. Fiber connection of the corpus glomerulosum in a Teleost, Navodon modestus. Journal of Comparative Neurology. 1982;205:291–298. doi: 10.1002/cne.902050309. [DOI] [PubMed] [Google Scholar]
- Shen GY, Chen WR, Midtgaard J, Shepard GM, Hines ML. Computational analysis of action potential initiation in mitral cell soma and dendrites based on dual patch recordings. Journal of Neurophysiology. 1999;82:3006–3020. doi: 10.1152/jn.1999.82.6.3006. [DOI] [PubMed] [Google Scholar]
- Tsutsui H, Oka Y. Effects of characteristic dendritic tip geometry on the electrical properties of teleost thalamic neurons. Journal of Neurophysiology. 2001;85:2289–2292. doi: 10.1152/jn.2001.85.5.2289. [DOI] [PubMed] [Google Scholar]
- Tsutsui H, Wolf AM, Knöpfel T, Oka Y. Imaging postsynaptic activities of teleost thalamic neurons at single cell resolution using a voltage-sensitive dye. Neuroscience Letters. 2001a;312:17–20. doi: 10.1016/s0304-3940(01)02177-2. [DOI] [PubMed] [Google Scholar]
- Tsutsui H, Yamamoto N, Ito H, Oka Y. Encoding of different aspects of nucleus corticalis activities by two types of cells in the corpus glomerulosum of a teleost brain. Journal of Neurophysiology. 2001b;85:1167–1177. doi: 10.1152/jn.2001.85.3.1167. [DOI] [PubMed] [Google Scholar]