

Abstract
Hippocampal activity in vivo is characterized by concurrent oscillations at theta (4–15 Hz) and gamma (20–80 Hz) frequencies. Here we show that cholinergic receptor activation (methacholine 10–20 nm) in hippocampal slice cultures induces an oscillatory mode of activity, in which the intrinsic network oscillator (located in the CA3 area) expresses simultaneous theta and gamma network oscillations. Pyramidal cells display synaptic theta oscillations, characterized by cycles consisting of population EPSP-IPSP sequences that are dominated by population IPSPs. These rhythmic IPSPs most probably result from theta-modulated spiking activity of several interneurons. At the same time, the majority of interneurons consistently display synaptic gamma oscillations. These oscillatory cycles consist of fast depolarizing rhythmic events that are likely to reflect excitatory input from CA3 pyramidal cells. Interneurons comprising this functional group were identified morphologically. They include four known types of interneurons (basket, O-LM, bistratified and str. lucidum-specific cells) and one new type of CA3 interneuron (multi-subfield cell). The oscillatory activity of these interneurons is only weakly correlated between neighbouring cells, and in about half of these (44 %) is modulated by depolarizing theta rhythmicity. The overall characteristics of acetylcholine-induced oscillations in slice cultures closely resemble the rhythmicity observed in hippocampal field and single cell recordings in vivo. Both rhythmicities depend on intrinsic synaptic interactions, and are expressed by different cell types. The fact that these oscillations persist in a network lacking extra-hippocampal connections emphasizes the importance of intrinsic mechanisms in determining this form of hippocampal activity.
Ongoing oscillatory waves are commonly observed in EEG recordings (Jung & Kornmüller, 1938; Walter, 1953). Among the most prominent patterns are theta oscillations (4–15 Hz), which originate in the hippocampus (Green & Arduini, 1954; Arduini & Pompeiano, 1955), and which are accompanied by gamma oscillations (20–80 Hz) (Grastyán et al. 1959; Bragin et al. 1995). Both rhythmicities are thought to be essential for hippocampal function (Buzsáki & Chrobak, 1995; Lisman, 1999). Theta oscillations are prevalent under conditions where the hippocampus is suggested to participate in learning and memory processes (Winson, 1978; Wilson & McNaughton, 1993). Furthermore, modification of hippocampal place cell firing phase in relation to ongoing theta oscillations is correlated with, and considered to represent, location during exploration (O'Keefe & Recce, 1993). These rhythms were suggested to result from network oscillations, and their expression is likely to represent the basic operating principle of the hippocampus.
Intact afferent input from the medial septum to the hippocampus is important for the generation of theta oscillation in vivo (Gray, 1971; Andersen et al. 1979; Lee et al. 1994). This pathway includes cholinergic and GABAergic fibres (Mesulam et al. 1983; Freund & Antal, 1988). Although the GABAergic system may contribute to the induction of hippocampal rhythmic activity (Toth et al. 1997), efforts to obtain an in vitro model exhibiting network oscillations have concentrated on cholinergic agonists (Konopacki et al. 1987; MacVicar & Tse, 1989). In transverse hippocampal slices and in slice cultures, muscarinic agonists applied in micromolar concentrations induce epileptiform-like activity in pyramidal cells (PCs) (Williams & Kauer, 1997; Fischer et al. 1999), whereas gamma oscillations, accompanied by occasional theta oscillations (in 4 % of experiments, A. Fisahn & E. Buhl, personal communication), have been recorded in horizontal hippocampal slices (Fisahn et al. 1998).
PCs in septohippocampal cocultures exhibit synaptic theta oscillations due to spontaneous release of acetylcholine from septal afferents. These network oscillations are also observed in PCs of hippocampal monocultures exposed to nanomolar concentrations of methacholine (MCh, which has similar affinity to muscarinic acetylcholine receptors as carbachol; Richards, 1990), and are abolished by atropine. This rhythmicity is an intrinsic property of the hippocampal network and shares essential features with in vivo theta oscillations, including infrequent action potential discharge by PCs (< 0.5 Hz) (Fischer et al. 1999). Recently, an intrinsic hippocampal theta generator has also been described in vivo (Kocsis et al. 1999). Both studies show that the intrinsic generator is localized in the CA3 area (Fischer et al. 1999; Kocsis et al. 1999). However, the properties of this intrinsic generator are not well characterized. The aim of the present study was to determine in slice cultures whether in addition to theta oscillations, activation of cholinergic receptors also generates activity in the gamma range. Moreover, we were interested in identifying the cellular elements expressing these different forms of oscillatory behaviour.
METHODS
All experiments were done according to the guidelines set forward by the Department for Veterinary Affairs of the Kanton of Zurich. Hippocampal slice cultures were prepared from 6-day-old rat pups killed by decapitation, and maintained for 3–6 weeks in vitro (Gähwiler, 1981). For electrophysiological recordings, cultures were transferred to a recording chamber and continuously superfused with warmed (32 °C) saline containing (mm): Na+ 145, Cl− 149, K+ 2.7, Ca2+ 2.8, Mg2+ 2, HCO3− 7.7, H2PO4− 0.4, glucose 5.6, and Phenol Red (10 mg l−1) at pH 7.4. MCh was purchased from Sigma-Aldrich (St Louis, MO, USA), biocytin from Molecular Probes (Eugene, OR, USA), and 2,3-dioxo-6-nitro-1,2,3,4-tetrahydrobenzo[f]quinoxaline-7-sulphonamide (NBQX) and TTX from Tocris Cookson (Bristol, UK). (±)-3-(2-Carboxypiperazin-4-yl)propanephosphonic acid (CPP) was a gift from Novartis (Basel, Switzerland).
Pairs of CA3 PCs and interneurons (INs) (located in stratum (str.) oriens, pyramidale and lucidum) were recorded with sharp microelectrodes containing 1 m potassium methylsulphate and 2 % biocytin (30–60 MΩ) (amplifier: Axoclamp-2A, Axon Instruments, Foster City, CA, USA). INs were identified on the basis of their location, electrophysiological properties and subsequent morphological characterization. Functional connectivity between INs and PCs was tested by evoking an action potential (40 ms current pulse) in either of the cells, and by monitoring the postsynaptic response in the other. Inhibitory synaptic transmission was also examined between functionally connected IN-IN cell pairs (stimulated at 0.1 Hz), if both presented gamma oscillations in response to 20 nm MCh.
The analog signal was recorded on videotape at 22 kHz. For analysis of rhythmic activity, data were digitized at 1 kHz. The method of analysis was based on a windowed fast Fourier transform (FFT). The recorded rhythmic activity was not limited to a single fixed frequency, but covered a range of frequencies (see Fischer et al. 1999). The selected method (windowed FFT) best reveals the nature of the rhythmic activity observed under our experimental conditions. For windowed FFT analysis, 500 ms windows with a 50 % overlap between windows were used. This window duration provides conditions of both stationarity and flexibility to allow quantification of such activity; overlap between windows is necessary to maintain the continuity of the signal. Otherwise, windowed FFT was performed according to standard methods. Furthermore, due to the continuous variation in the frequency and power domains, conventional FFT analysis results in an averaging effect (see Fig. 3), which is replicated for the averaged windowed FFT. As mentioned above, windowed FFT allows the resolution of the continuous and concurrent occurrence of both rhythmicities (see results).
Figure 3. Conventional FFT analysis results in an averaging effect.
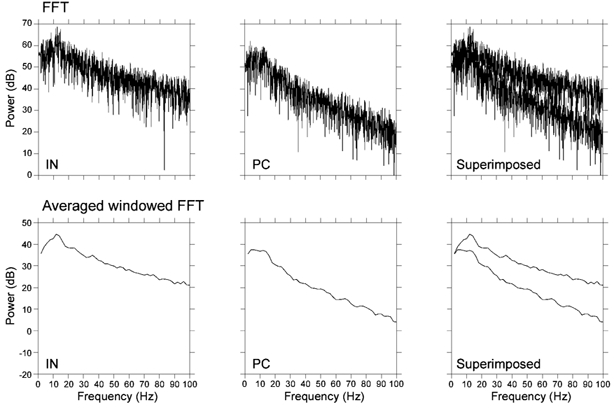
Upper traces, power spectra calculated by conventional FFT analysis for the same 10 s of IN and PC original activity that used for the windowed FFT in Fig. 1. Lower traces, power spectra of the averaged windowed FFT, calculated for the same data segment. Similar power spectra are obtained for both cases. This illustrates the averaging effect on the power spectra when the duration of the analyzed segment is relatively long with respect to the period of the rhythmic activity.
Preprocessing of the recorded signal included DC subtraction and reduction of white noise (using wavelet methods; Hubbard, 1996). Application of wavelet methods (based on the Coiflets Wavelets) had no effect on the temporal and frequency domains of the recorded signal but increased the relative power of the frequency peaks, thereby reducing white noise. Moreover, similar power spectra (up to 200 Hz) were obtained at each preprocessing step with conventional FFT analysis (not shown).
The results of the windowed FFT are presented in the form of spectrograms, which illustrate the Fourier analysis power spectrum (frequencies: 2–500 Hz) as a function of time, using a false colour scale to indicate the power in decibels (warm colours represent high power and thus the dominant frequencies). To quantify oscillatory activity we calculated the mean power of the dominant frequency in each window of the FFT. Additionally, for each window, cross-correlation was calculated and used either in the averaged mode (see text) or in the time varying mode (Fig. 7).
Figure 7. Gamma oscillations in neighbouring CA3 INs.
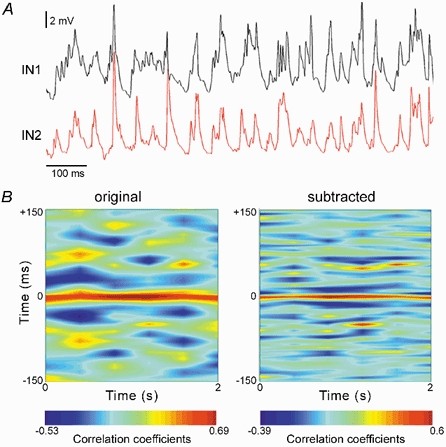
A, simultaneous intracellular recordings from an IN pair reveal that both cells expressed gamma oscillations in response to MCh (20 nm). Resting potentials were −63 mV (IN1) and −61 mV (IN2). B, the temporal variation in the cross-correlation coefficients of original (left) and subtracted signals (right) recorded from the INs. The y axis represents the correlation window and the x axis the variation in time. Correlative gamma activity was observed in subtracted signals, although their cross-correlation coefficients are low. Colour bar, linear scale of the calculated cross-correlation coefficients for original and subtracted signals, with warm colours (reds) indicating peaks and cold colours (blues) indicating troughs.
The signals recorded from INs consisted of fast rhythmic depolarizing events. Quantification was complicated by the modulation of this activity, to an extent varying between cells, by a slower depolarizing wave. Since slow activity by definition has higher power compared with the fast components of the signal, we subtracted the slow components from the signal to better quantify and resolve the contribution of fast unitary events. The removal of the slow activity was based on a running average method, which acts like a low-pass filter, while maintaining high sensitivity toward variations in the membrane potential. A running average of 11 data points (± 11 ms) was selected for the slow activity in INs, and of 18 points (± 18 ms) for the slow activity in PCs. These values were chosen because they provided the best match between the calculated and the recorded signal. The result can be seen in Fig. 1 where the calculated slow activity is depicted with a blue line that is superimposed on the original signal (without shifting). Nevertheless, this procedure is not ideal, as the recorded signal is asymmetric, thereby reducing the fast unitary EPSP amplitudes in INs and creating residual activities in PCs (Fig. 1 and Fig. 2). The isolated activity was quantified in the same way as the original signal using windowed FFT. The contribution of fast activities in INs and PCs was calculated as the difference of the mean power of the dominant frequencies in the original and subtracted signals. For the reasons mentioned above, contributions of fast rhythmic activity are overestimated in PCs and underestimated in INs. In spectrograms of the subtracted signal, resulting peaks are located at the same positions as in the original signal. Therefore, this method is useful for distinguishing between the biological and the harmonic contributions to the power spectra.
Figure 1. Gamma and theta network oscillations.
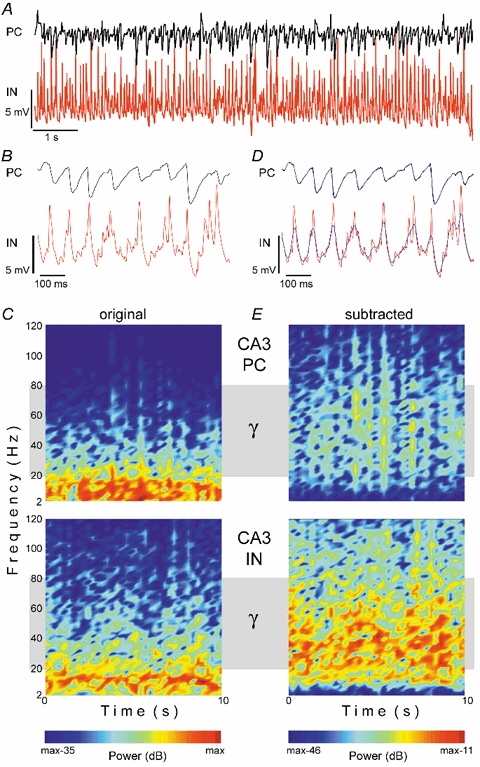
Simultaneous intracellular recordings from a CA3 PC (PC) and an interneuron (IN) in the presence of 10 nm MCh. Spontaneous synaptic activity is illustrated on a slow (A) and a faster (B) time scale. The PC shows rhythmic inhibitory synaptic potentials, which occur at theta frequency and have a time course longer than that of unitary IPSPs. IN activity is dominated by fast rhythmic EPSPs with kinetics similar to unitary EPSPs (see Fig. 2). C, spectrograms of the original signals (duration, 10 s) demonstrate predominant oscillatory activity of PCs in the theta range, whereas INs additionally display major gamma components (grey band). Windowed FFT power is colour-coded relative to the maximal value in a 35 dB scale. To quantify the contribution of activity at high frequencies and to facilitate illustration of the different oscillatory behaviour of the two cell types, slow frequency components (mainly theta, blue line) were subtracted from the original signal (D). Note the match between the calculated and recorded slow activity. Spectrograms of subtracted signals reveal dominant gamma activity in the IN (E), and are colour-coded according to the smallest difference in power relative to the original signal. The mean power of the IN-subtracted signal was 11 dB lower than that of the original signal, while the PC-subtracted signal was 23 dB lower. Resting potentials were −65 mV (IN) and −60 mV (PC).
Figure 2. Unitary synaptic connections between CA3 INs and PC pairs.
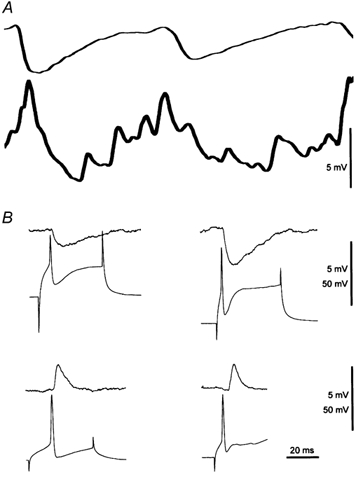
A, expanded traces from Fig. 1. B, upper traces, unitary IPSPs evoked in PCs by action potential stimulation in INs. Lower traces, unitary EPSPs evoked in INs by action potential stimulation in PCs. Traces are shown with the same time base as A. Note that unitary EPSPs in INs have a faster time course than unitary IPSPs in PCs. The time course of unitary EPSPs in INs (B) matches that of fast activity (A), while rhythmic activity in PCs (A) is slower than the unitary IPSPs in PCs (B).
Interspike intervals were measured from signals digitized at 1 kHz. Action potential and unitary connection parameters were extracted from signals digitized at 10 kHz. Mean variability was expressed as the s.d. Analysis was done using Matlab (The MathWorks, Inc., Natick, MA, USA).
At the end of experiments, cultures were fixed with a solution containing 4 % paraformaldehyde and 15v% saturated picric acid in 0.1 m phosphate buffer. After fixation, cultures were transferred to a cryoprotective solution (30 % sucrose and 12 % glycerol in 0.1 m phosphate buffer), frozen in dimethylbutane, and stored at −20 °C until processing. Cultures were transferred to Tris-buffered saline (TBS, pH 7.4), and cells filled with biocytin were first visualized by aminomethylcoumarin (AMCA)-conjugated streptavidin (1:250, Jackson ImmunoResearch, West Grove, PA, USA). Cultures were then incubated in biotinylated anti-avidin (1:1000, Vector, Burlingame, CA, USA) followed by avidin-biotinylated horseradish peroxidase complex (ABC, 1:200, Vector). Tissue-bound peroxidase was visualized by 3,3′-diaminobenzidine 4HCl (Sigma) as a chromogen. TBS was used for washes (3 × 10 min between each step) and dilution of antisera. Slices were then treated with 0.5 % OsO4 (in phosphate buffer, for 10 min) and dehydrated in ethanol (1 % uranyl acetate was added at the 70 % ethanol stage for 20 min) and embedded in Durcupan (ACM, Fluka, Switzerland).
RESULTS
Application of MCh (10–20 nm) induced an oscillatory mode of activity recorded intracellularly from pairs of INs and PCs (n = 43) in area CA3, the critical region for generating intrinsic hippocampal network oscillations (Fischer et al. 1999; Kocsis et al. 1999). As described previously, CA3 PCs (n = 43) at their resting potentials (−58.8 ± 4.4 mV, n = 26) exhibited synaptic theta oscillations, i.e. a combination of population EPSPs-IPSPs (Fig. 1) that was continuous and dominated by population IPSPs (Fischer et al. 1999). These oscillations were abolished in the presence of 0.5 μm TTX (not shown, n = 8). The duration of population IPSPs recorded in PCs (Fig. 1 and Fig. 2, about 100 ms) exceeded that of unitary IPSPs (about 40 ms), which were observed in 51 % of pairs of PCs and INs (amplitude 2.18 ± 1.89 mV, latency 2.38 ± 1.53 ms, n = 22) (Fig. 2).
At their resting potentials (−61 ± 5.3 mV, n = 24) the majority of INs (67 %, 29/43 cells) responded to MCh with sustained fast rhythmic depolarizations (Fig. 1 and Fig. 7). The duration of these rhythmic events corresponded to that of unitary EPSPs (∼25 ms) evoked in 47 % of INs by action potentials evoked in PCs (amplitude 3.25 ± 3.99 mV, latency 1.86 ± 1.07 ms, n = 20) (Fig. 2). IPSPs were rarely detected in INs during this mode of activity, although both excitatory and inhibitory synaptic potentials could be observed at their resting potentials prior to MCh application.
Windowed Fourier analysis demonstrated that the oscillatory activity of PCs was confined to theta frequencies, whereas spectrograms of the rhythmic activity of INs additionally displayed components at higher, including gamma, frequencies (Fig. 1). To an extent that varied between cells, the sequence of fast depolarizing rhythmic unitary events in INs was modulated by slower rhythmic components (see Fig. 1 and Fig. 7). In 16 of these 29 INs, only marginal contributions of the slower rhythmic components were observed (Fig. 7). In the remaining 13 INs, fast rhythmic depolarizing events were modulated by a theta-like rhythmic depolarization, that is likely to result from a synchronized excitatory input, acting directly or indirectly (see discussion) (Fig. 1). Moreover, antagonists of excitatory amino acid receptors abolished the oscillatory activity of INs and PCs (see later in the results).
Because low frequencies (with high-power) dominate spectrograms of INs, partially occluding intrinsic gamma rhythmicity, a procedure was developed to remove these theta-like components (Fig. 1) (see Methods). Spectrograms of subtracted IN activity consistently showed dominant frequencies in the gamma band (20–80 Hz), whereas PCs exhibited only residual activity in this band (Fig. 1). The average power of the subtracted signal in INs was 9.2 ± 2.5 dB lower than the original signal (about 1/10), while the subtracted signal in PCs was 21.9 ± 2.5 dB lower than the original signal (about 1/100) (n = 29). Thus, gamma power in these INs was at least 10-fold higher than in PCs (P < 0.05, Student's t test). Analysis of the algorithmically removed theta-signal revealed fundamental differences between INs and PCs. First, theta-like activity in INs was depolarizing (Fig. 1), while that of PCs was hyperpolarizing. Second, theta-like activity in INs (Fig. 1) never appeared in isolation. Moreover, cross-correlation analysis showed that the ‘theta’ wave recorded from INs preceded that of PCs by 15.6 ± 1.18 ms (n = 8), indicating a different source of origin.
The need for windowed FFT analysis is further demonstrated in Fig. 3, when the same data segment used in Fig. 1 was analysed with conventional FFT analysis. Power spectra obtained from the 10 s recordings by conventional FFT analysis yielded an averaged response, which was replicated when the windowed FFT was averaged. Similar power spectra were also observed in vivo with data obtained from intracellular recordings (Penttonen et al. 1998). This averaging effect was due to the continuous variation in the power and frequency domains of the recorded signals. The variation was not random, but occurred within the specific bands resolved in Fig. 1. Since the biological activity does not occur in a single frequency, but rather in a band form, the ability to detect the stationary properties of the rhythmic activity is better resolved with windowed FFT analysis (see methods). Furthermore, this result shows that the average properties of the signal were maintained also with windowed FFT analysis.
Action potential firing during network oscillations was another feature that distinguished INs from PCs. Whereas 26 of 40 PCs did not fire a single action potential and an additional seven PCs fired rarely (0.03 ± 0.02 Hz) (see also Fischer et al. 1999), 48 % (21/43) of the INs fired action potentials. Gamma oscillations, superimposed on background firing, were observed in 18 of these 21 INs. In 11 of these 21 cells average firing rates of 1–4 Hz were observed during oscillations. In the remaining 10 cells, occasional action potentials were observed. INs exhibiting sustained firing together with fast network oscillations showed uniform sequences of action potentials, skewed interspike interval distributions with a tendency to fire every 2–3 theta cycles (observed in PCs) and instantaneous firing frequencies that were frequently in the theta range (Fig. 4). All 11 INs that exhibited sustained firing showed similar firing properties as depicted in Fig. 4.
Figure 4. Action potential firing of CA3 INs during oscillations.
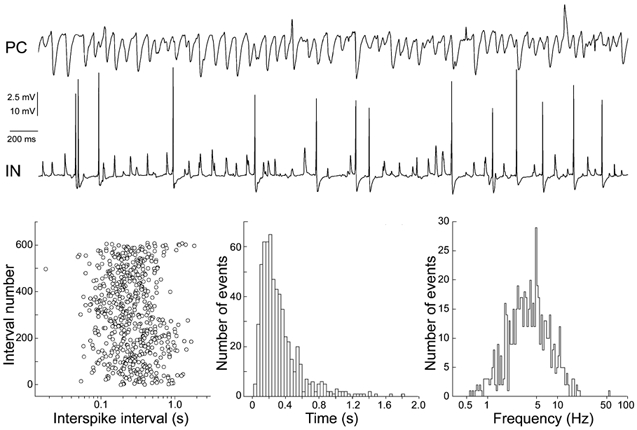
Upper panel, simultaneous intracellular recordings of membrane potential fluctuations in a connected pair of CA3 PC (upper trace)/IN (lower trace) during oscillations (MCh, 20 nm). Under these conditions the IN exhibited action potential firing. Note that gamma activity in the IN is not well resolved at this scale. Resting potentials were −58 mV (IN) and −58 mV (PC). Lower panel, analysis of the spontaneous firing pattern of an IN exhibiting fast network oscillations; 609 action potentials were detected during 200 s of oscillations. This discharge accompanied gamma oscillations in the IN. Left, the sequence of interspike intervals reveals no particular firing pattern. Middle, the interspike interval histogram is skewed (in all analysed INs) and indicates that the most frequent interval is at ∼300 ms, the duration of three theta cycles. Right, instantaneous firing frequencies follow theta rhythmicity, with components at lower and higher frequencies.
Rhythmic activity in CA3 PCs is inhibitory dominant, and likely to depend on synaptic inputs from neighbouring INs. The activity of individual INs cannot account for theta oscillations in PCs, as the duration of unitary IPSPs is inconsistent with these cycles (Fig. 1 and Fig. 2) and none of the recorded INs showed pacemaking properties (fired at the frequency of the oscillation, Fig. 4). Thus subsets of INs must contribute to these population IPSPs. To estimate how many INs need to fire, Poisson statistics was used. Poisson statistics is particularly suited to describe a process that has a low rate of occurrence, which corresponds to the properties of action potential discharge in the IN population. The inhibitory action potential kernel is characterized by average firing rates of 2 Hz, which is carried by 26 % of the IN population (with an estimated size of 400 cells; Scanziani, 2000), having a 50 % connectivity with neighbouring PCs. We thus estimate that the most probable number of INs contributing to each theta cycle in PCs is about 10, but not the same 10 INs are likely to fire with each theta cycle of PCs.
Injecting cells with biocytin allowed 18 INs that exhibited gamma oscillations to be identified morphologically on the basis of their dendritic and axonal arbors, and their laminar distribution. INs were classified using established criteria derived from the hippocampus in vivo (Freund & Buzsáki, 1996). Seven basket cells, which are responsible for somatic inhibition in PCs, were identified (Fig. 5B and Fig. 6C). Their dendrites were radially oriented in stratum radiatum and stratum oriens (with occasional long horizontal branches). The axon extended collaterals studded with numerous large boutons largely confined to stratum pyramidale. INs responsible for dendritic inhibition in PCs included one O-LM cell and six bistratified cells (Fig. 5A and Fig. 6B). Both the O-LM and the bistratified cells had a horizontal dendritic tree in stratum oriens and extended several varicose axon collaterals in the same layer. The main axon trunks crossed stratum pyramidale almost at right angles and started to arborize in stratum radiatum (and lacunosum-moleculare) either distally or more proximally. The former might correspond to O-LM cells, and the latter to bistratified cells (Fig. 5A). Two additional dendritic inhibitory cells, similar to the stratum lucidum-specific basket cell (Gulyás et al. 1993) were identified. One of these (Fig. 5C) located in stratum lucidum had horizontal dendrites in the same layer and a main dendritic branch that descended to stratum oriens. Its axon formed a dense arbor in stratum lucidum. The last class consisted of two INs with axonal projections across subfield boundaries, to several other subfields (multisubfield (MS) cells) (Fig. 5D and Fig. 6A), with a ‘forward’ projection to CA1 and a ‘backprojection’ to the dentate gyrus, the CA3 equivalent of CA1 backprojection neurons (Sik et al. 1994). These neurons had horizontal dendrites in stratum oriens, and long sparse axonal collaterals projecting both to the dentate gyrus and to CA1. Because all these INs (i.e. basket, O-LM, bistratified, str. lucidum-specific, and MS cells) expressed gamma oscillations, we conclude that this activity is widespread across functionally different IN subpopulations. Furthermore, theta modulated gamma activity in INs was not correlated with a particular class of cells and included basket (n = 5), O-LM (n = 2) and MS (n = 1) cells, representing all major fields of innervation by CA3 INs. Finally, sustained firing activity of INs was not limited to a particular class of cells and included basket (n = 4), str. lucidum-specific (n = 1) and MS (n = 1) cells, while marginal firing was observed in basket (n = 2), bistratified (n = 1) and O-LM (n = 1) cells. These results show that INs behave as one functional unit with respect to gamma oscillations, theta-like modulation and firing activity, irrespective of the cell type.
Figure 5. IN types expressing gamma network oscillations.
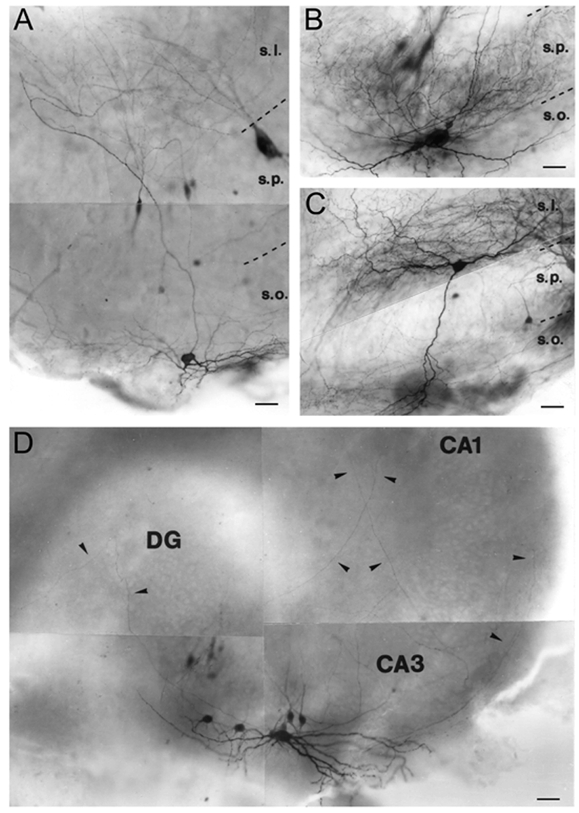
Light micrographs illustrate the anatomical characteristics of CA3 INs exhibiting gamma oscillations. Strata borders are indicated by broken lines: s.p., str. pyramidale; s.o., str. oriens; s.l., str. lucidum; DG, dentate gyrus. A, a CA3 bistratified cell whose soma is located in str. oriens, and axon collaterals arborizing in str. oriens and lucidum. The soma of the simultaneously recorded PC is located in str. pyramidale. B, a basket cell whose axon terminals formed perisomatic baskets in str. pyramidale. C, a stratum lucidum-specific cell whose soma is located in str. lucidum with a dense axonal arbor within the same layer. The recorded PC can be seen on the right-hand side. D, a multisubfield (MS) IN with a horizontal cell body in str. oriens, and long axon collaterals projecting to the CA1 region and to the dentate gyrus (arrowheads). Scale bar, 50 μm.
Figure 6. Camera lucida drawings of INs that expressed gamma network oscillations.
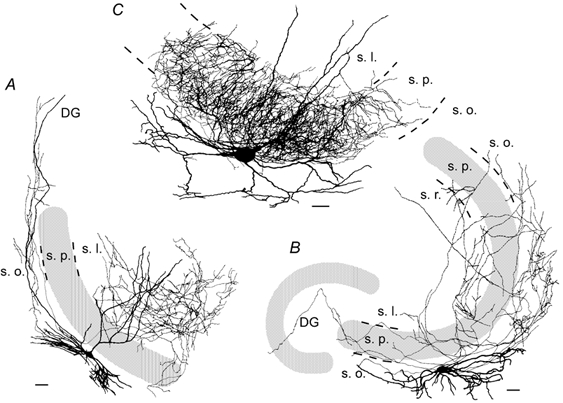
This illustration allows better visualization of dendritic and axonal arbors of the cells illustrated in Fig. 5. Thick lines, dendritic arbors; Thin lines, axonal arbors. Strata borders are indicated with broken lines. Abbreviations as in Fig. 5; s.r., str. radiatum. A, a CA3 bistratified (or O-LM) cell located in str. oriens had a horizontal dendritic tree in str. oriens and extended several varicose axon collaterals in the same layer. The main axon trunks crossed the str. pyramidale at right angles and started to arborize in str. radiatum (and lacunosum-moleculare) either distally or more proximally. B, a MS IN had a horizontal cell body in str. oriens, with horizontal dendrites in str. oriens and long sparse axonal collaterals invading both the dentate gyrus and the area CA1. C, a basket cell at the border of str. oriens/str. pyramidale with radially oriented dendrites in str. radiatum and str. oriens (with occasional long horizontal branches). The axon extended studded collaterals with numerous large boutons largely confined to str. pyramidale. Scale bar, 50 μm.
Why were only few IPSPs observed in INs during gamma oscillations, although they showed action potential firing? To address this question we examined the synaptic interactions between six functionally connected pairs of CA3 INs exhibiting gamma oscillations in response to 20 nm MCh. After confirming the expression of gamma oscillations, inhibitory transmission was studied in isolation (NBQX 20 μm, CPP 10 μm) and the effect of MCh on isolated transmission was examined (Table 1). In the presence of antagonists for excitatory amino acid receptors, excitatory inputs to INs were abolished and MCh-evoked oscillatory activity ceased (n = 6). The results summarized in Table 1 show that several factors appear to contribute to the fact that gamma oscillations in these INs were dominantly excitatory. First, not every IN that fires an action potential produces a postsynaptic response in another IN displaying gamma oscillations, as only one of these six pairs was reciprocally connected. Second, the impact of such synaptic inputs is limited in relation to that received from CA3 PCs, since the unitary IPSP amplitude was only −0.378 ± 0.162 mV (n = 6), compared with unitary EPSP amplitudes of 3.25 mV. Third, failures in transmission were observed between these INs (failure rate, 30 ± 31 %, n = 6). Fourth, during application of MCh, the properties of synaptic transmission were unaltered, remaining small (amplitude, −0.379 ± 0.194 mV) and unreliable (failure rate, 35 ± 33 %, n = 6 experiments). Furthermore, the small IPSP amplitudes observed at synaptic connections between neighbouring CA3 INs expressing gamma oscillations matches previously reported amplitudes of unitary inhibitory inputs to similar CA1 IN types (Cobb et al. 1997; Hájos & Mody, 1997).
Table 1.
Properties of synaptic transmission between pairs of interneurons exhibiting MChinduced gamma oscillations
| Connection | Amplitude (mV) | Failure | Success |
|---|---|---|---|
| 1 Control | −0.185 ± 0.108 | 24 (66%) | 12 |
| NBQX, CPP | −0.197 ± 0.096 | 45 (72%) | 17 |
| NBQX, CPP, MCh | −0.200 ± 0.070 | 43 (68%) | 20 |
| 2 Control | NA | NA | NA |
| NBQX, CPP | −0.617 ± 0.145 | 4 (6%) | 58 |
| NBQX, CPP, MCh | −0.603 ± 0.158 | 9 (12%) | 64 |
| 3 Control | −0.737 ± 0.240 | 0 | 48 |
| NBQX, CPP | −0.518± 0.138 | 0 | 63 |
| NBQX, CPP, MCh | −0.645 ±0.198 | 0 | 66 |
| 4 Control | −0.380 ± 0.090 | 0 | 99 |
| NBQX, CPP | −0.330 ± 0.089 | 3 (5%) | 56 |
| NBQX, CPP, MCh | −0.330 ± 0.080 | 3 (4%) | 67 |
| 5 Control | −0.370 ± 0.180 | NA | 17 |
| NBQX, CPP | −0.370 ± 0.130 | 23 (37%) | 38 |
| NBQX, CPP, MCh | −0.260 ± 0.110 | 42 (67%) | 20 |
| 6 Control | NA | NA | NA |
| NBQX, CPP | −0.239 ± 0.070 | 33 (60%) | 22 |
| NBQX, CPP, MCh | −0.237 ± 0.119 | 38 (63%) | 22 |
NA, not possible to determine without blocking glutamatergic transmission. Drugs: NBQX (20 μm), CPP (10 μm), MCh (20 nm).
We next addressed the question of whether gamma oscillations were synchronized in neighbouring INs. In three experiments, MCh-induced gamma oscillations were simultaneously recorded from pairs of neighbouring INs. For analysis, several 2 s segments were selected from each experiment, and cross-correlations were calculated for original and subtracted signals. The selected segment length is sufficiently long to express coherent gamma activity. Similar results were obtained in all experiments. The activity of the INs was only weakly synchronized (Fig. 7), giving centre correlation coefficients of, on average, 0.7 in the original and 0.6 in the subtracted signals (for the different segments and the different experiments). The centre correlation coefficient expresses the degree of similarity of the two signals at a given instance, while the appearance of a stripe pattern beyond the zero point is an indication of consistent correlative activity in time. Consistent correlative patterns were not evident in the original signal. On the other hand, correlated gamma activity was clearly observed in the subtracted signal, emerging as a stripe pattern with a relative constant spacing of ∼25 ms (∼40 Hz), but the coefficients were relatively low and shifted with time, indicating poor gamma synchronization in the transverse plane. This result is consistent with the reported low gamma coherence in the hippocampal transverse plane in vivo (Bragin et al. 1995).
DISCUSSION
These results demonstrate that application of MCh to hippocampal slice cultures induces network oscillations, which resemble the rhythmicity observed in hippocampal field and single cell recordings in vivo. During network oscillations in vivo, theta oscillations dominate the activity of CA1 PCs. Analysis of the power spectrum also reveals activity within the gamma range, but with amplitudes that are more than 10-fold lower (Penttonen et al. 1998). Moreover, only 2 % of CA1 PCs are estimated to fire action potentials during oscillations (Csicsvari et al. 1998). This action potential firing may contribute to gamma rhythmicity, since it tends to resonate with field gamma activity (Penttonen et al. 1998). The low action potential rates of PCs contrast with the 40–60 % of spontaneously discharging CA1 INs during the oscillatory mode of activity (Ylinen et al. 1995; Penttonen et al. 1998; Csicsvari et al. 1998) whose instantaneous firing rates span a large frequency range (Csicsvari et al. 1999), including the theta and gamma range (Ylinen et al. 1995; Sik et al. 1995). This firing is not continuous, but interrupted at theta frequencies (Ylinen et al. 1995; Traub et al. 1996). Finally, gamma oscillations are consistently observed in field recordings. Note that in vivo these parameters are available only for the CA1 subfield, but are considered to be representative also for the CA3 subfield.
Although various aspects of both theta and gamma oscillations are likely to be modulated by afferent inputs in vivo, e.g. from the septal nuclei, our data clearly demonstrate the intrinsic capacity of the neuronal network preserved in hippocampal slice cultures to express comparable network oscillations.
Our results suggest that cholinergic activation serves only as an enabling signal, and that oscillations emerge through intrinsic hippocampal CA3 network interactions (Fischer et al. 1999). These interactions are based on synchronized excitatory and inhibitory synaptic inputs. Rhythmic population IPSPs with a slower time course than unitary IPSPs dominated theta oscillations in PCs. These IPSPs are probably due to synchronous firing of several INs, for which the governing process remains unknown. The majority of INs express gamma oscillations characterized by fast depolarizing responses, whose amplitude and duration are similar to the unitary EPSPs originating from neighbouring PCs. These features suggest that gamma activity is imposed on INs, and is consistent with the finding that PCs and INs tend to respond best to rhythmic inputs at theta and gamma frequencies, respectively (Pike et al. 2000).
Theta-like modulation of gamma oscillations in INs depended on synchronized excitatory input: the oscillations were depolarizing at resting potentials and were abolished by antagonists of excitatory amino acid receptors. The mechanism underlying theta rhythmicity in INs remains unknown, although we can exclude the activation of an intrinsic voltage-dependent postsynaptic conductance, as the oscillations occurred around resting potential. Expression of theta-like rhythmicity in INs may result from superposition of unitary gamma events, activation of an additional process that is directly linked to the synchronized input, for example activation of extrasynaptic receptors, or an unidentified excitatory input, that is activated at theta frequencies. Although we cannot distinguish between these sources, all of them require a synchronization mechanism. The source of the synchronized excitatory inputs is not easy to reconcile with the fact that PCs rarely fire action potentials. Moreover, a synchronization mechanism is required for the concurrent expression of both gamma and theta oscillations in INs and PCs.
The presence of pacemaker neurons within the network could underlie both phenomena. However, no evidence for pacemaker cells in the CA3 region was observed. An alternative mechanism for the production of oscillations might rely on emergence of the rhythms through network interactions. Such a process is currently hypothesized to involve gap-junction communication that may provide an associational link leading to a sequential activation of neurons, thereby maintaining a high level of network activity without producing extensive action potential firing (Traub & Bibbig, 2000). Additionally, gap-junction communication between axons may also give rise to the fast depolarizing events observed in INs (Traub et al. 1999).
Several in vitro models have been developed to study gamma oscillations in the hippocampus (Whittington et al. 1995, 1997; Fisahn et al. 1998; Palva et al. 2000). These studies clearly show the capacity of hippocampal networks to respond with rhythmic activity to different forms of activation. While these models avoid the epileptic mode of activity that is observed in other models of hippocampal oscillations (McMahon et al. 1998), only one of them expresses ongoing gamma activity as observed in vivo (Fisahn et al. 1998). Furthermore, in several models rhythmic activity is limited to a single band, which represents only a fraction of the broad spectrum of simultaneous rhythmic patterns seen in the hippocampus in vivo. We assume that the degree of connectivity between cells comprising the network is a decisive factor and may be responsible for the fact that, as in vivo, theta and gamma oscillations are simultaneously observed in slice cultures.
While there is evidence for the involvement of hippocampal theta oscillations in processes such as learning and memory (Buzsáki, 1989; Wilson & McNaughton, 1993), the role of gamma oscillations is less clear. In visual cortex, gamma oscillations are suggested to take part in the ‘binding’ process (Gray & Singer, 1989). This mechanism may create an associational link between distinct visual features represented by physically distant cell groups, thereby providing a basis for cognition. Hippocampal gamma oscillations might, however, differ from those described in cortex. Whereas PCs express gamma activity in cortex, INs are the major source for these oscillations in hippocampus. Moreover, gamma rhythmicity in the hippocampus seems to result from synaptic interactions, whereas in the cortex it reflects action potential firing. The weak synchrony in gamma activity between hippocampal INs suggests that rhythmicities may develop through a process that depends on both functional and anatomical properties of the network. Rhythms are likely to emerge through the selection and activation of specific subsets of connections from pre-existing templates within the network. Finally, gamma activity is integrally associated with theta activity, suggesting functional interdependence between these two rhythms.
Acknowledgments
We gratefully acknowledge the comments of Drs G. Buzsáki, R. Traub, U. Gerber, and the technical assistance of Dr R. Dürr, L. Heeb, E. Hochreutener, L. Rietschin, and R. Schöb. This work was supported by the Dr Eric Slack-Gyr and Swiss National Science Foundations.
REFERENCES
- Andersen P, Bland HB, Myhrer T, Schwartzkroin PA. Septo-hippocampal pathway necessary for dentate theta production. Brain Research. 1979;165:13–22. doi: 10.1016/0006-8993(79)90040-4. [DOI] [PubMed] [Google Scholar]
- Arduini A, Pompeiano O. Attivita elettrica di singole unita dell'ippocampo e sue modificazioni con stimuli afferenti. Archivo di Scienze Biologiche. 1955;39:397–406. [PubMed] [Google Scholar]
- Bragin A, Jandó G, Nádasdy Z, Hetke J, Wise K, Buzsáki G. Gamma (40–100 Hz) oscillations in the hippocampus of the behaving rat. Journal of Neuroscience. 1995;15:47–60. doi: 10.1523/JNEUROSCI.15-01-00047.1995. [DOI] [PMC free article] [PubMed] [Google Scholar]
- Buzsáki G. Two-stage model of memory trace formation: a role for ‘noisy’ brain states. Neuroscience. 1989;31:551–570. doi: 10.1016/0306-4522(89)90423-5. [DOI] [PubMed] [Google Scholar]
- Buzsáki G, Chrobak JJ. Temporal structure in spatially organized neuronal ensembles: a role for interneuronal networks. Current Opinion in Neurobiology. 1995;5:504–510. doi: 10.1016/0959-4388(95)80012-3. [DOI] [PubMed] [Google Scholar]
- Cobb SR, Halasy K, Vida I, Nyiri G, Tamás G, Buhl EH, Somogyi P. Synaptic effects of identified interneurons innervating both interneurons and pyramidal cells in the rat hippocampus. Neuroscience. 1997;79:629–648. doi: 10.1016/s0306-4522(97)00055-9. [DOI] [PubMed] [Google Scholar]
- Csicsvari J, Hirase H, Czurko A, Buzsáki G. Reliability and state dependence of pyramidal cell-interneuron synapses in the hippocampus: an ensemble approach in the behaving rat. Journal of Neuroscience. 1998;21:179–189. doi: 10.1016/s0896-6273(00)80525-5. [DOI] [PubMed] [Google Scholar]
- Csicsvari J, Hirase H, Czurko A, Mamiya A, Buzsáki G. Oscillatory coupling of hippocampal pyramidal cells and interneurons in the behaving rat. Journal of Neuroscience. 1999;19:274–287. doi: 10.1523/JNEUROSCI.19-01-00274.1999. [DOI] [PMC free article] [PubMed] [Google Scholar]
- Fisahn A, Pike FG, Buhl EH, Paulsen O. Cholinergic induction of network oscillations at 40 Hz in the hippocampus in vitro. Nature. 1998;394:186–189. doi: 10.1038/28179. [DOI] [PubMed] [Google Scholar]
- Fischer Y, Gähwiler BH, Thompson SM. Activation of intrinsic hippocampal theta oscillations by acetylcholine in rat septo-hippocampal cocultures. Journal of Physiology. 1999;519:405–413. doi: 10.1111/j.1469-7793.1999.0405m.x. [DOI] [PMC free article] [PubMed] [Google Scholar]
- Freund TF, Antal M. GABA-containing neurons in the septum control inhibitory interneurons in the hippocampus. Nature. 1988;336:170–173. doi: 10.1038/336170a0. [DOI] [PubMed] [Google Scholar]
- Freund TF, Buzsáki G. Interneurons of the hippocampus. Hippocampus. 1996;6:347–470. doi: 10.1002/(SICI)1098-1063(1996)6:4<347::AID-HIPO1>3.0.CO;2-I. [DOI] [PubMed] [Google Scholar]
- Gähwiler BH. Organotypic monolayer cultures of nervous tissue. Journal of Neuroscience Methods. 1981;4:329–342. doi: 10.1016/0165-0270(81)90003-0. [DOI] [PubMed] [Google Scholar]
- Grastyán E, Lissák K, Madarász I, Donhoffer H. Hippocampal electrical activity during the development of conditioned reflexes. Electroencephalography and Clinical Neurophysiology. 1959;11:409–430. doi: 10.1016/0013-4694(59)90040-9. [DOI] [PubMed] [Google Scholar]
- Gray CM, Singer W. Stimulus-specific neuronal oscillations in orientation columns of the cat visual cortex. Proceedings of the National Academy of Sciences. 1989;86:1698–1702. doi: 10.1073/pnas.86.5.1698. [DOI] [PMC free article] [PubMed] [Google Scholar]
- Gray JA. Medial septal lesions, hippocampal theta rhythm and control of vibrissal movement in freely moving rat. Electroencephalography and Clinical Neurophysiology. 1971;30:189–197. doi: 10.1016/0013-4694(71)90053-8. [DOI] [PubMed] [Google Scholar]
- Green JD, Arduini AA. Hippocampal electrical activity in arousal. Journal of Neurophysiology. 1954;17:533–557. doi: 10.1152/jn.1954.17.6.533. [DOI] [PubMed] [Google Scholar]
- Gulyás AI, Miles R, Hájos N, Freund TF. Precision and variability in postsynaptic target selection of hippocampal nonpyramidal cells. European Journal of Neuroscience. 1993;5:1729–1751. doi: 10.1111/j.1460-9568.1993.tb00240.x. [DOI] [PubMed] [Google Scholar]
- Hájos N, Mody I. Synaptic communication among hippocampal interneurons: properties of spontaneous IPSCs in morphologically identified cells. Journal of Neuroscience. 1997;17:8427–8442. doi: 10.1523/JNEUROSCI.17-21-08427.1997. [DOI] [PMC free article] [PubMed] [Google Scholar]
- Hubbard BB. The World According to Wavelets. Wellesley, MA, USA: A. K. Peters; 1996. [Google Scholar]
- Jung R, Kornmüller AE. Eine methodik der ableitung lokalisierter potentialschwankungen aus subcorticalen hirngebeiten. Archiv fur Psychiatrie und Nervenkrankheiten. 1938;109:1–30. [Google Scholar]
- Kocsis B, Bragin A, Buzsáki G. Interdependence of multiple theta generators in the hippocampus: a partial coherence analysis. Journal of Neuroscience. 1999;19:6200–6212. doi: 10.1523/JNEUROSCI.19-14-06200.1999. [DOI] [PMC free article] [PubMed] [Google Scholar]
- Konopacki J, MacIver MB, Bland BH, Roth SH. Theta in hippocampal slices: relation to synaptic responses of dentate neurons. Brain Research Bulletin. 1987;18:25–27. doi: 10.1016/0361-9230(87)90029-3. [DOI] [PubMed] [Google Scholar]
- Lee MG, Chrobak JJ, Sik A, Wiley RG, Buzsáki G. Hippocampal theta activity following selective lesion of the septal cholinergic system. Neuroscience. 1994;62:1033–1074. doi: 10.1016/0306-4522(94)90341-7. [DOI] [PubMed] [Google Scholar]
- Lisman JE. Relating hippocampal circuitry to function: recall of memory sequences by reciprocal dentate-CA3 interactions. Neuron. 1999;22:233–242. doi: 10.1016/s0896-6273(00)81085-5. [DOI] [PubMed] [Google Scholar]
- MacVicar BA, Tse FWY. Local neuronal circuitry underlying cholinergic rhythmical slow activity in area CA3 of rat hippocampal slices. Journal of Physiology. 1989;417:197–212. doi: 10.1113/jphysiol.1989.sp017797. [DOI] [PMC free article] [PubMed] [Google Scholar]
- McMahon LL, Williams JH, Kauer JA. Functionally distinct groups of interneurons identified during rhythmic carbachol oscillations in the hippocampus in vitro. Journal of Neuroscience. 1998;18:5640–5651. doi: 10.1523/JNEUROSCI.18-15-05640.1998. [DOI] [PMC free article] [PubMed] [Google Scholar]
- Mesulam M-M, Mufson EJ, Wainer BH, Levey AI. Central cholinergic pathways in the rat: an overview based on an alternative nomenclature (Ch1-Ch6) Neuroscience. 1983;10:1185–1201. doi: 10.1016/0306-4522(83)90108-2. [DOI] [PubMed] [Google Scholar]
- O'Keefe J, Recce M. Phase relationship between place units and the EEG theta rhythm. Hippocampus. 1993;3:317–330. doi: 10.1002/hipo.450030307. [DOI] [PubMed] [Google Scholar]
- Palva JM, Lamsa K, Lauri SE, Rauvala H, Kaila K, Taira T. Fast network oscillations in the newborn rat hippocampus in vitro. Journal of Neuroscience. 2000;20:1170–1178. doi: 10.1523/JNEUROSCI.20-03-01170.2000. [DOI] [PMC free article] [PubMed] [Google Scholar]
- Penttonen M, Kamondi A, Acsády L, Buzsáki G. Gamma frequency oscillations in the hippocampus of the rat: intracellular analysis in vivo. European Journal of Neuroscience. 1998;10:718–728. doi: 10.1046/j.1460-9568.1998.00096.x. [DOI] [PubMed] [Google Scholar]
- Pike FG, Goddard RS, Suckling JM, Ganter P, Kasthuri N, Paulsen O. Distinct frequency preferences of different types of rat hippocampal neurones in response to oscillatory input currents. Journal of Physiology. 2000;529:205–213. doi: 10.1111/j.1469-7793.2000.00205.x. [DOI] [PMC free article] [PubMed] [Google Scholar]
- Richards MH. Relative potencies of agonists and differential sensitivity to N-ethylmaleimide on muscarinic autoreceptors and postsynaptic receptors in rat hippocampus. The Journal of Pharmacology and Experimental Therapeutics. 1990;255:83–89. [PubMed] [Google Scholar]
- Scanziani M. GABA spillover activates postsynaptic GABAB receptors to control rhythmic hippocampal activity. Neuron. 2000;25:673–681. doi: 10.1016/s0896-6273(00)81069-7. [DOI] [PubMed] [Google Scholar]
- Sik A, Penttonen M, Ylinen A, Buzsáki G. Inhibitory CA1-CA3-hilar region feedback in the hippocampus. Science. 1994;265:1722–1724. doi: 10.1126/science.8085161. [DOI] [PubMed] [Google Scholar]
- Sik A, Penttonen M, Ylinen A, Buzsáki G. Hippoocampal CA1 interneurons: an in vivo intracellular labeling study. Journal of Neuroscience. 1995;15:6651–6665. doi: 10.1523/JNEUROSCI.15-10-06651.1995. [DOI] [PMC free article] [PubMed] [Google Scholar]
- Toth K, Freund TF, Miles R. Disinhibition of rat hippocampal pyramidal cells by GABAergic afferents from the septum. Journal of Physiology. 1997;500:463–474. doi: 10.1113/jphysiol.1997.sp022033. [DOI] [PMC free article] [PubMed] [Google Scholar]
- Traub RD, Bibbig A. A model of high-frequency ripples in the hippocampus based on synaptic coupling plus axon-axon gap junctions between pyramidal neurons. Journal of Neuroscience. 2000;20:2086–2093. doi: 10.1523/JNEUROSCI.20-06-02086.2000. [DOI] [PMC free article] [PubMed] [Google Scholar]
- Traub RD, Schmitz D, Jefferys JGR, Draguhn A. High-frequency population oscillations are predicted to occur in hippocampal pyramidal neuronal networks interconnected by axoaxonal gap junctions. Neuroscience. 1999;92:407–426. doi: 10.1016/s0306-4522(98)00755-6. [DOI] [PubMed] [Google Scholar]
- Traub RD, Whittington MA, Colling SB, Buzsáki G, Jefferys JGR. Analysis of gamma rhythms in the rat hippocampus in vitro and in vivo. Journal of Physiology. 1996;493:471–484. doi: 10.1113/jphysiol.1996.sp021397. [DOI] [PMC free article] [PubMed] [Google Scholar]
- Walter WG. The Living Brain. New York: W.W. Norton & Company, Inc.; 1953. [Google Scholar]
- Whittington MA, Stanford IM, Colling SB, Jefferys JG, Traub RD. Spatiotemporal patterns of gamma frequency oscillations tetanically induced in the rat hippocampal slice. Journal of Physiology. 1997;502:591–607. doi: 10.1111/j.1469-7793.1997.591bj.x. [DOI] [PMC free article] [PubMed] [Google Scholar]
- Whittington MA, Traub RD, Jefferys JG. Synchronized oscillations in interneuron networks driven by metabotropic glutamate receptor activation. Nature. 1995;373:612–615. doi: 10.1038/373612a0. [DOI] [PubMed] [Google Scholar]
- Williams JH, Kauer JA. Properties of carbachol-induced oscillatory activity in rat hippocampus. Journal of Neurophysiology. 1997;78:2631–2640. doi: 10.1152/jn.1997.78.5.2631. [DOI] [PubMed] [Google Scholar]
- Wilson MA, McNaughton BL. Dynamics of the hippocampal ensemble code for space. Science. 1993;261:1055–1058. doi: 10.1126/science.8351520. [DOI] [PubMed] [Google Scholar]
- Winson J. Loss of hippocampal theta rhythm results in spatial memory deficit in the rat. Science. 1978;201:160–163. doi: 10.1126/science.663646. [DOI] [PubMed] [Google Scholar]
- Ylinen A, Soltész I, Bragin A, Penttonen M, Sik A, Buzsáki G. Intracellular correlates of hippocampal theta rhythm in identified pyramidal cells, granule cell, and basket cells. Hippocampus. 1995;5:78–90. doi: 10.1002/hipo.450050110. [DOI] [PubMed] [Google Scholar]