

Abstract
Lamina I of the spinal dorsal horn plays an important role in the processing and relay of nociceptive information. Signal processing depends, in part, on neuronal membrane properties. Intrinsic membrane properties of lamina I neurons were therefore investigated using whole cell patch clamp recordings in a slice preparation of adult rat spinal cord. Based on responses to somatic current injection, four cell types were identified: tonic, which fire comparatively slowly but continuously throughout stimulation; phasic, which fire a high frequency burst of variable duration; delayed onset, which fire irregularly and with a marked delay to the first spike; and single spike, which typically fire only one action potential even when strongly depolarised. Classification by spiking pattern was further refined by identification of characteristic stimulus-response curves and quantification of several response parameters. Objectivity of the classification was confirmed by cluster analysis. Responses to stimulus trains and synaptic input as well as the kinetics of spontaneous synaptic events revealed differences in the signal processing characteristics of the cell types: tonic and delayed onset cells appeared to act predominantly as integrators whereas phasic and single spike cells acted as coincidence detectors. Intracellular labelling revealed a significant correlation between morphological and physiological cell types: tonic cells were typically fusiform, phasic cells were pyramidal, and delayed onset and single spike cells were multipolar. Thus, there are multiple physiological cells types in lamina I with specific morphological correlates and distinctive signal processing characteristics that confer significant differences in the transduction of input into spike trains.
Lamina I of the spinal dorsal horn plays an important role in the processing and relay of nociceptive and thermoreceptive information (Perl, 1984; Willis, 1985; Light, 1992; Craig, 1994, 2000). It is a major source of ascending fibres to multiple supraspinal targets (Trevino, 1976; Perl, 1984; Lima, 1997) whose output encodes noxious and thermal stimulus intensity (Craig & Kniffki, 1985; Bester et al. 2000; Craig et al. 2001) and is directly relevant to nocifensive behaviour (Mantyh et al. 1997). Moreover, lamina I receives primary afferent input encoding different stimulus modalities (Christensen & Perl, 1970) and comprises multiple morphological cell types (Gobel, 1978a; Lima & Coimbra, 1986; Zhang et al. 1996) including fusiform, pyramidal, multipolar, and flattened based on somatic shape and dendritic arborisation although the last two classes are not always distinguished. The morphology of lamina I cells appears to correlate with the stimulus modality to which the cell responds (Han et al. 1998). Still other studies have found relationships between morphological classification and transmitter/receptor phenotype (Lima et al. 1993; Yu et al. 1999; Cheunsuang & Morris, 2000), between receptor phenotype and afferent input (Ma et al. 1996), as well as inter-relationships between chemical phenotypes (Laing et al. 1994; Littlewood et al. 1995), leading to an increasingly complex understanding of multiplexed correlations which provide valuable insight into the circuitry of lamina I.
Yet, despite the importance of lamina I and increasing understanding of its components, a basic description of the intrinsic functional properties of lamina I neurons was lacking. Intrinsic membrane properties are fundamental in determining how a neuron will respond to input (Jack et al. 1975; Crill & Schwindt, 1984; Gustafsson, 1984; Hille, 1992; Morisset & Nagy, 1998; Engel et al. 1999; Koch, 1999) and vary widely between cell types of the mammalian nervous system (Llinás, 1988; Connors & Gutnick, 1990). Past studies have typically identified three to four cell types in deeper spinal dorsal horn layers based on differences in membrane properties (Thomson et al. 1989; Yoshimura & Jessell, 1989; Lopez-Garcia & King, 1994; Jo et al. 1998). There is evidence that these cell types exhibit distinct afterhyperpolarisation (AHP) kinetics and process synaptic input differently (Thomson et al. 1989), respond differentially to various cutaneous stimulus modalities (Lopez-Garcia & King, 1994), and also exhibit different transmitter/receptor phenotypes (Jo et al. 1998). Only Yoshimura and Jessell (1989) undertook more detailed analysis of the bases for differences in firing properties in their study of lamina II. It is important to note however, that few neurons from lamina I were included in the above mentioned studies since this thin band of predominantly small cells was not specifically targeted for recording. Only more recently have Han et al. (1998) reported two distinct firing patterns in definitively identified lamina I neurons. Moreover, physiological classification has relied primarily on qualitative differences in spiking pattern which, while easily recognised, can be sensitive to parameters like stimulus intensity, membrane potential and recording conditions; this complicates comparison between studies and interpretation of those data in the broader context of signal processing. Given the importance of lamina I for pain, elucidating the biophysical determinants of signal processing by its component cells is an important step towards understanding early processing of sensory information in the dorsal horn.
Thus, using whole cell patch clamp in a slice preparation of adult rat spinal cord, our goal was to develop an objective and robust scheme for classification of lamina I neurons based on their intrinsic membrane properties. The results revealed that, while cell types could be tentatively recognised by spiking patterns, definitive classification required consideration of a broader array of response characteristics. The correlation between physiological and morphological features argues that physiological cell types represent functionally distinct components of lamina I rather than arbitrary groupings. Functional significance of the differences in membrane properties between cell types in terms of signal processing (e.g. integration vs. coincidence detection, defined by whether the interval over which inputs are summated is short or long compared with the interval between spikes; König et al. 1996) was demonstrated through analysis of responses to step depolarisations, stimulus trains, and spontaneous synaptic events. Some of these results have been reported in preliminary form (Prescott & De Koninck, 1999, 2000).
METHODS
Slice preparation
All experiments were performed in accordance with regulations of the Canadian Council on Animal Care. Details of the slicing method have been previously described (Chéry et al. 2000). Briefly, adult male Sprague-Dawley rats (> 40 days old) were anaesthetised with an intraperitoneal injection of sodium pentobarbital (30 mg kg−1) and perfused intracardially with ice-cold oxygenated (95 % O2 and 5 % CO2) sucrose-substituted artificial cerebrospinal fluid (S-ACSF) containing (mm): 252 sucrose, 2.5 KCl, 2 CaCl2, 2 MgCl2, 10 glucose, 26 NaHCO3, 1.25 NaH2PO4 and 5 kynurenic acid; pH 7.35; 340–350 mosmol kg−1. The rats were decapitated, the spinal cord was removed by hydraulic extrusion, and 300–400 μm thick parasagittal sections (Fig. 1A) were cut from the lumbar and cervical enlargements. Slicing in this plane allows visual identification of lamina I while maintaining the majority of the dendritic tree intact (Chéry et al. 2000) because dendritic extension is greatest in the rostro-caudal axis (Lima & Coimbra, 1986). Slices were kept in normal oxygenated ACSF (126 mm NaCl instead of sucrose and without kynurenic acid; 300–310 mosmol kg−1) at room temperature until recording.
Figure 1. Parasagittal slice preparation of adult rat spinal cord.

A, lumbar and cervical enlargements were sliced in the parasagittal plane. B, with gradient-contrast optics (Dodt et al. 1998), lamina I appears as a 20–75 μm thick band of tissue (depending on medio-lateral position and exact orientation of slicing) with a striated appearance differing from that of the adjacent substantia gelatinosa (Chéry et al. 2000). The borders with the white matter and substantia gelatinosa are marked with white and black dotted lines, respectively. Arrow indicates the soma of a neuron in lamina I. C, summed projection of a confocal image stack shows the neuron indicated in B intracellularly labelled with Lucifer Yellow. The patch pipette is seen still attached to the cell. D, overlay of parts B and C allows definitive localisation of the recorded cell.
Recording and data acquisition
Patch pipettes were pulled from borosilicate glass capillaries (WPI). Pipettes were filled with an intracellular solution composed of (mm): either 140 KCl, 10 Hepes and 2 MgCl2; or, in the majority of cases, 135 KMeSO4, 5 KCl, 10 Hepes, 2 MgCl2, 4 ATP (Sigma), 0.4 GTP (Sigma); pH was adjusted to 7.2 with KOH and osmolality ranged from 270 to 290 mosmol kg−1 (see Zhang et al. 1994). Intracellular Ca2+ was not buffered because of the effects such treatment can have on AHPs and spike frequency adaptation (Staley et al. 1992; Velumian & Carlen, 1999; Kang et al. 2000). To prevent forced dialysis of the cell, no positive pressure was applied to the inside of the pipette during recording.
Slices were transferred to a recording chamber which was constantly perfused at ∼2 ml min−1 with oxygenated (95 % O2 and 5 % CO2) ACSF. Medial and lateral slices were used to prevent biased sampling of neurons along the medio-lateral axis. All recordings were at room temperature (22–26 °C). The slice was viewed with a modified Zeiss Axioplan2 microscope equipped with infrared ‘gradient-contrast’ optics (Dodt et al. 1998) and a × 40 water immersion objective (Achroplan IR; NA 0.8). Viewed in the parasagittal plane with these optics, lamina I appears as a narrow striated region immediately adjacent to the white matter (Fig. 1B; Chéry et al. 2000). Visually identified neurons were patched on and recorded from in the whole cell configuration using an Axopatch 200B amplifier (Axon Instruments; Foster City, CA, USA). Traces were low-passed filtered at 10 kHz and stored on videotape using a digital data recorder (VR-10B, Instrutech Corp.; Port Washington, NY, USA). Off-line, recordings were sampled at 10 kHz on a computer using Strathclyde Electrophysiology software (CDR; by J. Dempster, Department of Physiology and Pharmacology, University of Strathclyde, Glasgow, UK).
Data were analysed using locally designed software (De Koninck). Instantaneous firing frequency (f) was calculated as the reciprocal of the interspike interval (ISI); for stimulus-response curves, f was averaged over all ISIs constituting the response and is reported as 〈f〉. Rheobase was determined as the minimum current needed to elicit at least one action potential (Jack et al. 1975). Input resistance (Rin) was calculated from responses to hyperpolarising pulses in the linear region of the current-voltage relationship. The membrane time constant (τm) was determined (from the same responses used to calculate Rin) as the slowest time constant from exponential curve fits. Reported values of membrane potential (Vm) were corrected for the liquid junction potential (see Barry & Lynch, 1991) which was estimated as 3 and 9 mV for KCl and KMeSO4 recording solutions, respectively. Membrane potential was adjusted by tonic current injection to allow testing of the cell at its resting Vm and at pre-selected levels: −59 and −74 mV (after corrections); all data are from responses at resting Vm unless otherwise stated. For analysis of synaptic activity, recordings were low-passed filtered at 3 kHz, sampled at 10 kHz on the computer, and synaptic events were detected and analysed as previously described (Chéry & De Koninck, 1999). Statistical analysis was performed on Systat 9 (SPSS Inc.) and included χ2 for contingency tables, one-way ANOVAs with post hoc Tukey tests, Student's t tests, Kruskal-Wallis tests, K-means clustering and discriminant analysis as indicated in Results; statistical significance was defined as P < 0.05.
Confocal microscopy and 3-D reconstructions
Neurons were intracellularly labelled by including ∼0.1% Lucifer Yellow (dipotassium salt; Sigma) in the patch pipette. To minimise distortion and maximise yield, labelled cells were imaged immediately following completion of recording, before removing the patch pipette (Fig. 1C and D). This was done with a Zeiss LSM 510 confocal unit equipped with an argon laser allowing excitation at 458 nm. Serial optical sections were obtained at 1 μm intervals. Images of labelled cells show either the summed projection of an image stack after deconvolution (20 iterations of the power accelerated blind deconvolution algorithm run on AutoDeblur v. 6, AutoQuant Imaging, Watervliet, NY USA) or a 3-D reconstruction. Three-dimensional reconstructions were created with an M4 image analysis system using the M3D module (MCID Software; Imaging Research; St Catharines, ON, Canada), thereby allowing spatial rotation and optimal morphological classification (Chéry et al. 2000). While deconvolution improved image quality in the X-Y plane, improvements in the Z axis were inconsistent and did not warrant deconvolution of image stacks used for reconstructions. The image of the patch pipette was digitally removed from 3-D reconstructions for clarity. Morphometric analysis included investigation of somatic dimensions as well as dendritic numbers, diameter, branching and ventral spread. Length and area measurements were carried out using Scion Image (Scion Corp.; Frederick, MD, USA).
RESULTS
Of ∼150 sampled neurons, 61 were judged to be relatively healthy upon initial establishment of the whole cell recording configuration and were recorded for sufficient duration to allow adequate physiological characterisation. During subsequent analysis, this sample was reduced to 44 neurons based on more stringent criteria: resting Vm < −50 mV, Rin >200 MΩ, action potential amplitude overshooting 0 mV, and satisfactorily labelled to allow accurate morphological classification. Preliminary physiological classification on the basis of spiking pattern was determined within the first three to five minutes of recording, however, more detailed investigation required longer recordings. Therefore, to control for washout (including potential loss of Ca2+ and/or endogenous diffusible Ca2+ buffers), cells were tested multiple times throughout the recording period with series of depolarising and hyperpolarising pulses; no changes in firing pattern were observed over the course of the recording (up to one hour). Moreover, no systematic differences in firing pattern or other measured responses were found between cells recorded using the KCl or KMeSO4 recording solutions and data were therefore pooled.
Overview of distinguishing features
Data clearly indicated that spinal lamina I cells were physiologically heterogeneous (Fig. 2A). The most obvious difference between cells was their firing pattern in response to injection of depolarising current. The firing patterns could be divided into four distinct categories. Tonic cells were easily excited to fire action potentials and tended to fire regularly and throughout the duration of depolarisation (Fig. 2Aa). Phasic cells did not fire repetitively to mild stimulation, but were able to achieve high firing rates in response to stronger stimuli though they tended to discontinue this firing abruptly before the end of stimulation, (Fig. 2Ab). Delayed onset cells typically showed a marked delay to the first action potential and were further distinguished from the other cell types by their irregular firing (Fig. 2Ac). Single spike cells fired only a single action potential or a very short burst (≤ 4 spikes) in response to strong stimulation and sometimes completely failed to fire when stimulated from their typically hyperpolarised resting Vm (Fig. 2Ad). Passive membrane properties are summarised in Table 1.
Figure 2. Physiological and morphological heterogeneity in spinal lamina I neurons.
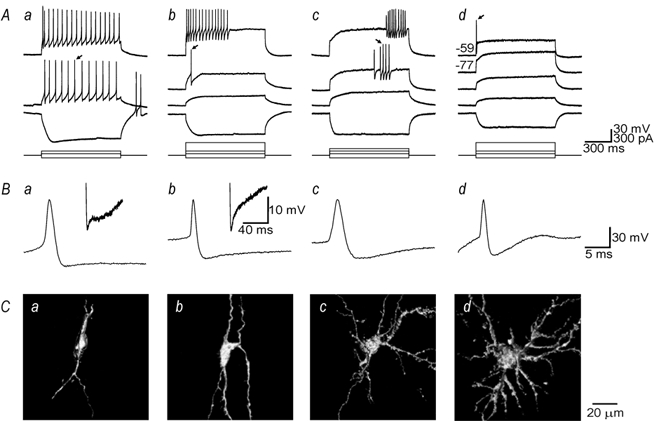
A, four physiological cell types exist in lamina I: a, tonic, which typically fire regularly and throughout depolarisation; b, phasic, which fire a high frequency burst of variable duration; c, delayed onset, which fire irregularly and with a marked delay to the first spike and d, single spike, which generally fire only one spike in response to strong depolarisation. Single spike neurons may fail to generate action potentials when stimulated, even very strongly, from their characteristic hyperpolarised resting membrane potential (Vm) (trace labelled -77) but a single spike could be elicited when the cell was tonically depolarised before stimulation (trace labelled -59); numbers refer to Vm in mV. For all other traces, cells were at their resting Vm. B, enlarged views of action potentials indicated by arrows in A. Insets illustrate differences in afterhyperpolarisation (AHP) kinetics. Tonic cells typically exhibited a biphasic AHP whereas the other cell types exhibited a monophasic AHP. C, at least three distinct morphological cell types exist in lamina I: a, fusiform; b, pyramidal; c and d, multipolar. Each panel shows a three dimensional reconstruction viewed in the parasagittal plane of a recorded neuron intracellularly labelled with Lucifer Yellow; physiological data from the same cell are shown in the traces directly above each reconstruction.
Table 1.
Passive membrane properties of physiological and morphological cell types
| n | Resting Vm (mV) | Rin (MΩ) | τm (ms) | C (pF) | |
|---|---|---|---|---|---|
| Physiological cell types: | |||||
| tonic | 15 | −60 ± 1 | 737 ± 72 | 40 ± 5 | 59 ± 9 |
| phasic | 8 | −65 ± 1 | 577 ± 44 | 27 ± 5 | 45 ± 6 |
| delayed onset | 7 | −66 ± 2 | 866 ± 126 | 29 ± 6 | 32 ± 5 |
| single spike | 14 | −72 ± 2 | 497 ± 44 | 22 ± 3 | 42 ± 5 |
| P | 0.008 | 0.006 | 0.019 | 0.086 | |
| Morphological cell types: | |||||
| fusiform | 16 | −61 ± 2 | 697 ± 68 | 33 ± 4 | 52 ± 8 |
| pyramidal | 9 | −64 ± 3 | 650 ± 65 | 38 ± 7 | 56 ± 7 |
| multipolar | 19 | −70 ± 2 | 615 ± 68 | 24 ± 3 | 39 ± 4 |
| P | 0.006 | 0.68 | 0.073 | 0.158 | |
Data show means ±s.e.m. Resting Vm, resting membrane potential; Rin, input resistance; τm, membrane time constant; C, total capacitance calculated as C =τm/Rin. P values indicate the level of significance of one-way ANOVAs. Results of post hoc Tukey tests are indicated in Results.
Spike width at half peak amplitude varied significantly across cell types (Fig. 2B; ANOVA; P < 0.001): tonic, 1.8 ± 0.1 ms; phasic, 1.4 ± 0.1 ms; delayed onset, 2.2 ± 0.1 ms and single spike, 1.3 ± 0.1 ms. Action potentials in delayed onset cells were significantly longer than in phasic and single spike cells (Tukey tests; P < 0.01) and action potentials in single spike cells were significantly shorter than in tonic cells (P < 0.05). The AHP kinetics also appeared to vary between cell types (Fig. 2B insets). Based on analysis of the AHP following the first spike elicited by rheobasic stimulation in each cell, 12 of 15 tonic cells displayed an AHP with two clearly separable phases (τ1 = 3.3 ± 0.7 ms; τ2 = 45.7 ± 5.2 ms); AHPs in the remaining three cells were best described by a single exponential decay function (τ = 11.2 ± 3.0 ms). The AHPs in all phasic cells were best described by a single exponential (τ = 10.3 ± 1.7 ms), as was similarly true in delayed onset (τ = 18.4 ± 4.3 ms) and single spike (τ = 4.9 ± 0.9 ms) neurons. These differences in AHP kinetics between cell types (i.e. one- vs. two-time constants) were still present when cells were analysed at equivalent Vm. In tonic cells, the onset of the second phase was sometimes late enough that an inflection could be observed between phases (e.g. Fig. 2Aa inset) though this was not always the case (e.g. Fig. 5D). Using peak hyperpolarisation relative to spike threshold as an index for AHP amplitude, AHP amplitude was not found to vary systematically between cell types (ANOVA): tonic, 21.3 ± 4.3 mV; phasic, 21.3 ± 6.6 mV; delayed onset, 21.6 ± 5.6 mV and single spike, 22.6 ± 3.5 mV.
Figure 5. Differentiating tonic neurons from phasic neurons.
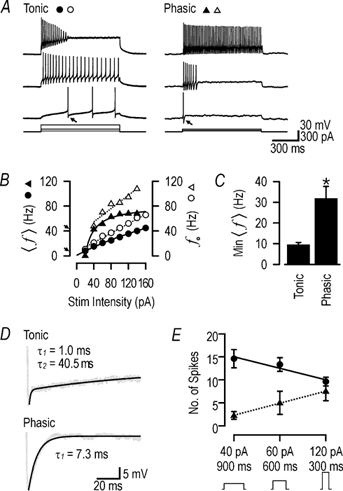
A, as shown in this example, a tonic cell (left traces) may fail to maintain firing in response to strong stimulation, whereas a phasic cell (right traces) can, on occasion, increase its duration of firing long enough to maintain firing until the end of the stimulus. This illustrates the necessity of testing with milder stimulus intensities, at which tonic cells maintain slow repetitive firing whereas phasic cells do not, to ensure proper classification according to the scheme presented here. B, the differences in membrane properties culminate in markedly different 〈f〉-I curves between tonic (•) and phasic (▴) cells. The difference in responsiveness to mild stimulation is well documented by the relative shapes of these curves; continuous lines show least squares fits with the generic equation Y = (1 + ax)/(b + cx). In particular, the minimum maintainable 〈f〉, indicated by arrows on the Y-axis, was noticeably different between this tonic and phasic cell (8 vs. 42 Hz). Despite the difference in convexity of the 〈f〉-I curves, the initial firing frequency, f0 (defined as reciprocal of the first ISI of the response) increased linearly with stimulus intensity for both tonic (○) and phasic (▵) cells; dotted lines show linear regressions. C, the minimum maintainable 〈f〉 was determined for each tonic and phasic cell as the 〈f〉 for the first response (i.e. to the lowest stimulus intensity) generating more than one action potential. This varied significantly between cell types (t test; *P < 0.001). Bars show means ±s.e.m.D, the differences in afterhyperpolarisation (AHP) kinetics are likely to contribute to the observed differences in repetitive spiking near rheobase and in the shape of the 〈f〉-I curves. Traces show enlarged view of AHPs indicated by arrows on A. The AHP in the tonic cell was best described by a double exponential function, whereas a single exponential function appropriately described the AHP in the phasic cell, where the slower component was missing (see Results). E, to test for differences in their integrative properties, cells were stimulated with the same total charge (36 fC) achieved either by a mild, prolonged stimulus or by a strong, brief stimulus. Tonic cells were optimally excited by the former pattern whereas phasic cells were optimally excited by the latter. Data show means ±s.e.m. for tonic (•) and phasic (▴) cells; slopes of regression lines were significantly different (t test; P < 0.005). Thus, the response of the neuron is affected by both stimulus intensity and duration.
Responses to hyperpolarising stimulation also helped to discriminate between cell types. Rebound spiking was a common feature of tonic cells (Fig. 2Aa), occurring in 11 of 15 cells (vs. four of eight phasic cells, zero of seven delayed onset cells, and only one of 14 single spike cells). Irrespective of Vm, rebound depolarisation typically occurred once Vm reached −90 mV during the hyperpolarising step and rebound spiking inevitably occurred with stronger hyperpolarisation. Time-dependent rectification was also observed in some tonic cells, but was not a standard feature. In contrast to rebound spiking, single spike cells exhibited a transient outward rectification following the offset of strong hyperpolarising steps when tested at Vm = −59 mV, but this was not evident at more hyperpolarised Vm (see Fig. 8; Yoshimura & Jessell, 1989).
Figure 8. Intrinsic membrane properties of single spike neurons.

A, sample responses with the membrane potential (Vm) adjusted to −59 mV (left traces) and −74 mV (right traces). At Vm=−59 mV, a slow return to baseline voltage was evident following the offset of hyperpolarising current (indicated by arrow). B, comparing the number of spikes at Vm=−59 mV (•) to that at Vm=−74 mV (○) shows that the total number of elicited spikes underwent a large relative increase when the neuron was tonically depolarised, yet this number never increased above four action potentials. C, the differences in the number of spikes elicited at different Vm could not be explained by input resistance (Rin) alone, as Rin actually changed in the direction opposite to that expected from the spiking pattern: Rin was higher at Vm=−74 mV (507 MΩ; ○) compared with that at Vm=−59 mV (356 MΩ; •). D, under normal conditions, the cell responded to 20 ms long depolarising pulses with only one spike; however, the same stimulus was able to elicit two spikes when applied during a slow synaptic event. Onset of the synaptic depolarisation is marked with an arrow.
Intracellular labelling with Lucifer Yellow indicated that the recorded cells were also morphologically heterogeneous (Fig. 2C). Neurons were morphologically classified as fusiform, pyramidal, or multipolar on the basis of the shape of their soma and the number of primary dendrites and their proximal branching, in accordance with previously described classification schemes (Gobel, 1978a; Lima & Coimbra, 1986; Zhang et al. 1996; see below).
Characterisation of cell types
Having observed significant variation in the intrinsic membrane properties of lamina I neurons, we sought to establish a classification scheme in which physiological cell types are easily recognised on the basis of spiking pattern but, at the same time, represent functionally distinct components of the circuitry in lamina I rather than arbitrary groupings. Controls for the most likely causes of misclassification (e.g. differences caused by variation in Vm), optimal testing protocols (e.g. use of a broad range of stimulus intensities), and response measures that allow quantitative discrimination of cell types (e.g. rheobase, response at rheobase, delay to response, etc.) are described below.
Tonic neurons
Tonic cells were able to fire at low 〈f〉 in response to mild depolarisation, and linearly increased this response over a wide range of stimulus intensities (Fig. 3); this was true for both the firing frequency (referred to as the 〈f〉-I curve) and the total number of spikes. Adjusting Vm did not alter the response pattern in this cell type. Although tonic cells fired throughout stimulation, there was an exponential decrease in f over the course of the response (Fig. 3C).
Figure 3. Intrinsic membrane properties of tonic neurons.

A, sample responses with the Vm adjusted to −59 mV (left traces) and −74 mV (right traces). B, the response of the cell shown in A was measured as either the average instantaneous firing frequency (〈f〉; •, ○) or the total number of spikes fired (▴, ▵). Both response measures increased linearly over a wide range of stimulus intensities for Vm=−59 mV (filled symbols) and for Vm=−74 mV (open symbols). C, during each response, there was a progressive decrease in instantaneous firing frequency (f). Ca, responses to stimulation with 120 pA (▪) and 220 pA (♦) at Vm=−59 mV were fitted with monoexponential decay functions (continuous and dotted lines, respectively). No clear effect of stimulus intensity or Vm on the decay time constant (τ) was observed; e.g. τ120= 5.9 vs.τ220= 6.1 intervals. Cb, normalizing f against fmax accentuates the similarity of the decay kinetics. Cc, however, converting the X-axis from interval ordinate to real time and re-fitting the curves exaggerates the decay in those responses with higher f; e.g. τ120= 239 vs.τ220= 182 ms.
Phasic neurons
In contrast to tonic cells, phasic cells tended not to respond to mild stimulation with repetitive firing (Fig. 4A) and instead showed an abrupt increase in 〈f〉 as the stimulus intensity was increased above rheobase (Fig. 4B). However, the total number of action potentials elicited by depolarisation increased more gradually (Fig. 4B) based primarily on increases in the duration of the burst rather than on increases in 〈f〉. The duration of this burst was quite labile, but tended to increase with increasing stimulus intensity (Fig. 4A). These response patterns were relatively insensitive to Vm. As with tonic cells, there was an exponential decrease in f during the response (Fig. 4C). This relatively rapid decrement in f in conjunction with the variable burst duration prompted investigation of the effects of these properties on the 〈f〉-I curve. Plotting f0 (i.e. f from the first ISI of the response) against stimulus intensity showed a linear increase (Fig. 4D), suggesting that the addition of later spikes at lower f in response to stronger stimulation causes the convexity in the 〈f〉-I curve, where f is averaged across all ISIs. This effect was far less pronounced in tonic cells (see Fig. 5B).
Figure 4. Intrinsic membrane properties of phasic neurons.

A, sample responses with the Vm adjusted to −59 mV (left traces) and −74 mV (right traces). For all stimulus intensities, spiking ceased before the end of the 900 ms long stimulus. The duration of this spiking, however, tended to increase with increasing stimulus intensity, as reflected in B. B, when repetitive firing was achieved at higher stimulus intensities, the average instantaneous firing frequency (〈f〉; •, ○) underwent an abrupt increase and then reached a plateau. This was equally true for Vm=−59 mV (filled symbols) and Vm=−74 mV (open symbols). However, the total number of spikes fired (▴, ▵) was determined more by the duration of spiking than by 〈f〉 itself and therefore tended to increase more gradually, with the resultant stimulus-response curves showing the opposite convexity. C, as in tonic cells, instantaneous firing frequency (f) underwent a exponential decrease during the course of the response. Ca, responses to stimulation with 260 pA at Vm=−59 mV (▪) and with 300 pA at Vm=−74 mV (⋄) were fitted with monoexponential decay functions. Again, no obvious effect of stimulus intensity or Vm on the decay time constant (τ) was observed.Cb, normalizing f against fmax and comparing the decay in the response shown as ▪ in a (continuous line) with the response shown as ▪ in the tonic cell from Fig. 3C (dotted line) showed that the decay was more rapid in phasic cells compared with tonic cells (τphasic= 2.0 vs.τtonic= 5.9 intervals), though the decay in phasic cells tended to asymptote at a higher final f. D, the rapid decrement in f during the response and the prolongation of spiking (i.e. burst duration) with increasingly strong stimulation prompted enquiry into whether these properties explained the convex shape of the 〈f〉-I curve. Initial f (f0, defined as the reciprocal of the first ISI) is plotted as triangles (▴, ▵) and shows a linear increase with stimulus intensity, in contrast to the average f (〈f〉; •, ○). This indicates that the upward convexity in the 〈f〉-I curve is caused by the addition of later spikes occurring at lower f, which reduces the average f.
Tonic vs. phasic neuron
While the differences between tonic and phasic cells appear obvious, spurious responses could easily result in misclassifications which are best avoided by testing with a range of stimulus intensities and looking for trends in the response pattern. Phasic cells could sometimes fire action potentials throughout the duration of stimulation (Fig. 5A), which could result in misidentification of that cell as tonic. Tonic cells could cease firing in response to strong stimulation (Fig. 5A), possibly resulting in the opposite misclassification if tested at only one stimulus intensity. Nonetheless, the patterns of ‘adaptation’ observed in the two cell types were easily distinguished. Unlike the abrupt discontinuation of firing observed in phasic cells, adaptation in tonic cells was accompanied by attenuation of the action potential amplitude and a progressive increase in the action potential threshold. This pattern was only observed in tonic cells responding to strong depolarisation, and occurred in 10 of 15 tonic cells at stimulus intensities of ≥160 pA.
The most striking differences in spiking pattern between tonic and phasic cells existed near rheobase (i.e. the minimum current eliciting action potentials; Jack et al. 1975), where tonic cells fired repetitively at low frequency whereas phasic cells typically fired only one action potential or a fast, unsustained burst (Fig. 5A). At higher stimulus intensities where phasic cells achieved repetitive firing, the minimum f was noticeably high, suggesting phasic cells could not maintain firing at low f (Fig. 5B). Indeed, there was a significant difference between the minimum observed 〈f〉 in tonic and phasic cells (Student's t test, P < 0.001; Fig. 5C) which is probably due, in part, to the difference in AHP kinetics (Fig. 5D; see above; Connor & Stevens, 1971; Hille, 1992; Rinzel & Ermentrout, 1998; Kang et al. 2000).
As already seen, the 〈f〉-I curves of tonic and phasic cells are qualitatively different (Fig. 5B). Furthermore, the dissociation of spike number from f by changes in burst duration means the number of elicited spikes depends on stimulus duration, in addition to stimulus intensity. This interplay between stimulus parameters is considered in Fig. 5E which shows that for the same total charge injected into the cell, tonic cells were optimally excited by mild, prolonged stimulation whereas phasic cells preferred strong, brief stimulation; in this regard, delayed onset cells are like tonic cells whereas single spike cells are like phasic cells.
Delayed onset neurons
Like tonic cells, delayed onset neurons tended to maintain repetitive firing over a range of stimulus intensities (Fig. 6). Discriminating between these cell types warranted caution as the defining delay to the onset of spiking was voltage sensitive (Fig. 6Ca). However, given that the usual resting Vm of delayed onset neurons was around −66 mV (Table 1), pronounced delay to spiking was a fairly robust feature (see Fig. 9C). Normalising delay against the average ISI facilitated differentiation of tonic and delayed onset cells although normalised delay was still sensitive to Vm in delayed onset neurons (Fig. 6Cb). Regardless of Vm, delayed onset cells typically exhibited an initial increase in f in the earliest phase of their response (Fig. 6D), compared with the very consistent exponential decrease in f observed in tonic and phasic cells. Additionally, delayed onset cells fired irregularly (compare Fig. 7A with traces from tonic and phasic cells in Fig. 5A); the coefficient of variation of f was significantly higher in delayed onset cells than in tonic or phasic cells (Tukey tests; P < 0.001; Fig. 7B).
Figure 6. Intrinsic membrane properties of delayed onset neurons.

A, sample responses with the Vm adjusted to −53 mV (left traces) and to −63 mV (right traces). At Vm=−53 mV, the delay to the onset of spiking was only evident with mild stimulation, whereas the delay appeared to be maintained across a wider range of stimulus intensities when Vm=−63 mV. B, as in tonic cells, both the average firing frequency (〈f〉; •, ○) and the number of spikes (▴, ▵) increased gradually with increasing stimulus intensity. C, the best method of quantifying delay was explored in order to optimise discrimination of cell types on the basis of delay to spiking. Ca, the time from stimulus onset to the first spike was measured at Vm adjusted to −53 mV (•) and at Vm=−63 mV (○). Equivalent data for the tonic neuron shown in Fig. 3 are also shown for Vm=−59 mV (▪) and Vm =−74 mV (□). Hyperpolarisation increased the delay in both cell types, but the cells were not well differentiated by measurement of the absolute delay. Cb, normalising the delay against the average interspike interval (ISI) revealed that the delay to the first spike was disproportionately long compared with the average interval between spikes in delayed onset cells, especially at hyperpolarised potentials; the same was not true for tonic cells. D, plotting instantaneous frequency (f) against interval ordinate for responses comprising approximately the same total number of action potentials at Vm=−53 mV (•) and Vm =−63 mV (○) revealed an initial increase in f followed by an eventual decrease. This is in contrast to the exponential decrease in f observed in tonic cells (▪) and phasic cells.
Figure 9. Comparison of active membrane properties for quantitative discrimination of cell types.

A, rheobase was determined as the lowest stimulus intensity eliciting at least one action potential. B, the total number of action potentials at rheobase is shown as filled bars and total number of action potentials at 40 pA above rheobase is shown as open bars. C, delay to the first spike at rheobasic stimulation is shown as filled bars and the delay at 40 pA above rheobase is shown as open bars. All data were determined from cells at their resting Vm except in a subset of single spike cells that would not spike when stimulated from their resting Vm. In those cases, responses after adjustment of Vm to −59 mV were analysed (this ‘substitution’ was considered preferable to excluding those cells from analysis, though either solution ultimately provides the same overall result). All bars show means ±s.e.m. Due to inhomogeneity of variances across groups, Kruskal-Wallis tests were applied in place of one-way ANOVAs, and were highly significant for each of the five measures (P < 0.001). D, one of each parameter from parts A-C was used to create a three dimensional scatter plot showing data from all neurons. Each parameters was log transformed in order to distribute the observations more evenly throughout space. Clouds were added to help point out the clustering of neuron types within this parameter space. There is little overlap between the clouds, therein showing that the different cell types can be quantitatively delineated from one another by their combination of response properties. Arrows along each axis indicate where the 3-D space was divided into eight quadrants to generate a 2 ×2 ×2 contingency table (see Results). E, linear discriminant analysis through complete estimation was used to objectively separate the cells into groups pre-defined by spiking pattern. The canonical scores plot is shown, where the X- and Y-axes are the canonical variables that result from the linear combinations of rheobase, response at rheobase, response at 40 pA > rheobase, and delay to response at rheobase that best discriminate between the cell types. Confidence ellipses are centred around the centroid of each group.
Figure 7. Differentiating delayed onset neurons from tonic and phasic neurons.

A, sample responses showing the irregular spiking in delayed onset neurons. This irregularity in spiking pattern contrasted the pattern observed in tonic and phasic cells, where f tended to drift but did not fluctuate erratically. B, the irregularity in firing was quantified for tonic, phasic, and delayed onset neurons as the coefficient of variation (c.v.), defined as standard deviation of f/〈f〉. This was determined for each neuron as the average c.v. across the first three responses (i.e. responses to the three lowest stimulus intensities) comprising four or more spikes. One phasic and one delayed onset neuron which did not exhibit three responses with sufficient spikes were excluded from this analysis. Bars show means ± s.e.m. The ANOVA was significant (P < 0.001), with the delayed onset neurons displaying a significantly higher c.v. than tonic or phasic neurons (Tukey tests; *P < 0.001).
Single spike neurons
Single spike cells offered a number of striking dissimilarities from the other cell types, allowing relatively easy identification (Fig. 8). We were concerned however, that this cell type could represent unhealthy neurons given that damaged neurons may fail to maintain repetitive firing because of their low Rin (Alger et al. 1984). There are three separate lines of evidence to argue that single spike neurons in lamina I constituted a legitimate group and did not simply represent unhealthy examples of other cell types. The first relies on the morphological correlation, in that single spike cells should not correspond to a particular morphological class if they are unhealthy examples of other physiological cell types that comprise multiple morphological classes; however, a correlation was in fact observed (see below). The other arguments are based on physiological data. As summarised in Table 1, single spike cells were well polarised and, while their average Rin was the lowest of all groups (significantly lower than tonic and delayed onset cells; Tukey tests; P < 0.05), there were several examples of cells from other groups with Rin < 500 MΩ that fired repetitively. In addition, both spiking pattern and Rin displayed sensitivity to Vm (Fig. 8). From a depolarised Vm, the cell fired a very short, high frequency burst of action potentials despite a lower Rin than that observed at a hyperpolarised Vm, at which the cell fired only one action potential even in response to extremely strong depolarisation. This indicates that Rin alone, was insufficient to explain the spiking pattern in single spike neurons. The response at −59 mV was never seen to progress beyond four spikes (Fig. 8B), thus precluding confusion between single spike and phasic cells. The effects of the voltage sensitivity of spike number is illustrated by the response of a single spike neuron to brief stimuli applied before and during a slow excitatory synaptic event(Fig. 8D).
Quantitative classification
To support our classification scheme, we quantified a number of response properties to test for natural clustering of cells into identifiable groups. A summary of active response properties shows that each of the four cell types (classified according to spiking pattern after taking precautions, i.e. controlling for Vm and testing with multiple stimulus intensities) have a unique combination of rheobase, responsiveness at and above rheobase, and delay to response at and above rheobase (Fig. 9). In other words, measuring two or more of these quasi-independent parameters provides a sensitive and selective means of identifying cell types independently of the spiking pattern per se. This natural grouping is evident on the scatter plot employing three of the aforementioned response measures (Fig. 9D). A 2 ×2 ×2 contingency table can be created by dividing the 3-D space in Fig. 9D into eight quadrants; the differential distribution was highly significant (χ2 = 28.4; d.f. = 4; P < 0.005), indicating cell types are differentially distributed within this parameter space. Addition of spiking pattern to create a 2 ×2 ×2 ×4 contingency further affirms this point (χ2 = 165; d.f. = 10; P < 0.001), showing the correlation between quantified response properties and more subjectively defined spiking patterns.
While determination of firing pattern and quantification of various response parameters suggested that four legitimate cell types existed within lamina I, we sought to show this more objectively through cluster analysis. The K-means clustering technique groups data into a pre-determined number of groups by maximising between-cluster variation relative to within-cluster variation (using rheobase, response at rheobase, response at 40 pA > rheobase, and delay to response at rheobase as variables) with no a priori knowledge of groups or arbitrarily defined cut-offs. Using a χ2 distance metric, the quality of clustering deteriorated with fewer than four groups (total χ2 = 6544 for n = 3 vs. total χ2 = 7039 for n = 4) and did not improve substantially with greater than four groups (total χ2 = 7126 for n = 5), arguing that four categories is a parsimonious division of the cell population. Based on grouping into four classes, the resultant clusters corresponded very closely to the groups defined by spiking pattern, with 37 of 44 cells being equivalently categorised by the two methods (i.e. cluster analysis vs. observer defined).
In turn, we used linear discriminant analysis through complete estimation (Fig. 9E) to determine how well groups could be objectively identified with a priori knowledge of group membership. This analysis provides linear functions of the variables (the same as used for K-means clustering) that best separate cells into groups predefined by spiking pattern. Discriminant analysis correctly identified 39 of 44 neurons, showing that it is clearly possible to quantitatively differentiate the four cell types. Moreover, this analysis suggested that delay to the onset of spiking was the most valuable variable for this discrimination, though ultimately classification is best achieved through a combination of variables.
Responses to stimulus trains
Figure 10A compares the responses elicited by trains of 20 ms long pulses of comparable amplitude relative to the rheobase of each cell. Tonic and delayed onset cells appeared to rely on summation of these brief inputs in order for spikes to be produced whereas phasic and especially single spike neurons followed high frequency stimulus trains with time-locked spikes. The effects of stimulus frequency on neuron output is reported in Fig. 10B. We further tested whether the ability to follow the stimulus train was influenced by stimulus intensity. On initial inspection of Fig. 10C, the tonic cell appeared to follow high frequency stimulation when the stimulus intensity was sufficiently high; however, the spikes were not well time-locked to the onset of pulses and replacing a train of pulses with a single step depolarisation applying a comparable charge to the cell over the same duration elicited a very similar response. Therefore tonic neurons were simply integrating across the brief inputs rather than following them per se. Contrariwise, when the stimulus intensity applied to the single spike neuron was decreased, the cell abruptly changed from responding to almost every pulse in a time-locked manner to completely failing to follow the stimulus train indicating that the cell did not integrate across inputs (Fig. 10C). Based on these data, one may posit that tonic and delayed onset neurons operate predominantly as integrators whereas phasic and single spike neurons operate predominantly as coincidence detectors.
Figure 10. Different cell types act as integrators or coincidence detectors.

A, sample traces from each of the four different cell types stimulated with trains of 20 ms long depolarising pulses. The tonic cell stimulated with 40 pA > rheobase (×3 rheobase) failed to respond to each pulse and instead appeared to sum the inputs; stimulation at higher frequencies caused greater summation and elicited more spikes. The phasic cell stimulated with 40 pA > rheobase (×1.67 rheobase) was able to follow fairly high frequency stimulation with spikes time locked to each pulse but by 33 Hz it could not follow the stimulus train and fired more irregularly. The delayed onset neuron stimulated with 60 pA > rheobase (× 2 rheobase) responded in a manner similar to the tonic cell, relying on summation for the elicitation of spikes. The single spike neuron stimulated with 60 pA > rheobase (×1.42 rheobase) responded to each of the stimuli in a time locked manner and was able to follow very high frequency trains. Rheobase was determined for each cell by its response to 900 ms long step depolarisations. B, relation between stimulus frequency and cell response. For comparable stimulus intensity relative to rheobase, phasic (▪) and single spike (⋄) neurons tended to respond to each pulse; single spike neurons were especially capable of following high frequency trains. Opposite to this, tonic (•) and delayed onset (▵) neurons required short interpulse intervals for temporal summation but were unreliable in following high frequencies. C, effects of stimulus intensity on response to stimulus trains. At ×6 rheobase, the tonic cell appeared to follow a high frequency stimulus train (40 Hz) though the time locking to pulse onset was poor. The same charge applied to the cell in the form of a constant step depolarisation elicited a very similar spike pattern, showing that this cell type simply integrates its input rather than accurately encoding temporal information. In contrast, the single spike neuron still followed the high frequency stimulus train at × 1.14 rheobase. At rheobase, only one spike was generated by the first pulse and at × 0.86 rheobase no spikes were generated. At all three intensities there was no evidence of temporal summation.
Responses to synaptic input
The pattern of synaptically evoked action potentials (Fig. 11A) was consistent with a spiking pattern elicited by step depolarisations and stimulus trains. The tonic cell fired slowly on top of a prolonged excitatory postsynaptic potential (EPSP) whereas the phasic cell responded with a very fast pair of spikes at the onset of the EPSP. The delayed onset cell failed to respond to the fast synaptic events that typically bombarded this cell type, though it did respond after a ∼200 ms long delay to a prolonged EPSP. Consistent with their high rheobase, single spike neurons were never observed to fire in response to spontaneous synaptic input (even when tonically depolarised) though the frequency of spontaneous EPSPs was in fact roughly tenfold higher in this cell type compared with other cell types and, moreover, this frequency was maintained in the presence of 1 μm bath-applied tetrototoxin suggesting that single spike neurons receive a large number of excitatory synapses.
Figure 11. Synaptically driven spiking and kinetics of the underlying synaptic events.

A, sample traces of typical spiking patterns elicited by spontaneous synaptic input as well as subthreshold synaptic events in the same cell. The onset of synaptic depolarisation is marked by the arrow. Action potentials are shown truncated. The tonic cell is seen to fire relatively slowly (i.e. moderate delay to onset and long interval between spikes) on the peak of an excitatory postsynaptic potential (EPSP), whereas the phasic cell fired two spikes in rapid succession at the onset of the EPSP, in contrast to the delayed onset neuron in which the elicited spike occurred after a significant delay. Single spike neurons were never seen to spike in response to spontaneous synaptic input. B, kinetics of subthreshold spontaneous EPSPs. Traces show the averaged EPSP (≥ 60 events) for a sample cell of each type. T, tonic; P, phasic; DO, delayed onset and SS, single spike. Though fast events predominated for the delayed onset cells (trace labelled DOf), a clearly distinguishable subset of events with a much slower decay time course was observed in this cell type (trace labelled DOs) and occasionally in the phasic and single spike neurons. C, cumulative histograms of decay time constants (τepsp) from fittings of individual synaptic events in the same cells shown in B. Though each cell exhibits a range of τepsp, differences between cells are clearly discernible. D, summary of decay time constants (τepsp) and 10–90 % rise times (RT, 10–90 % of peak) of spontaneous EPSPs from four cells of each type. Bars show means ±s.e.m. The ANOVA was significant for τepsp (P < 0.005), with EPSPs in tonic cells being significantly longer than in other cell types (Tukey tests; *P < 0.01). While RT varied significantly across groups (ANOVA; P < 0.05), no single cell type was significantly different from another (Tukey tests). E, membrane time constant (τm) was insufficient to explain differences in τepsp. Tonic, •; phasic, ▪; delayed onset, ▵; single spike, ⋄. While τm can account for some of the variability of τepsp within a group, the linear regression for pooled data (line, r2= 0.15) was insignificant (t test) and indicates τm cannot explain variability of τepsp between groups. F, tonic and phasic cells tended to have longer RTs than delayed onset and phasic cells. Linear regression of the pooled data (line) indicated that RT can explain relatively little of the variability in τepsp between groups (r2= 0.36; t test; P < 0.05). More importantly, a long RT alone cannot explain the long τepsp in tonic cells given that the RT in phasic cells is equally long though that cell type has a much shorter τepsp.
Properties of synaptic input
The kinetics of the underlying synaptic events also appeared to vary between cell types. We analysed the kinetics of spontaneously occurring, subthreshold EPSPs rather than stimulus-evoked potentials in order to minimise distortion of synaptic kinetics due to the mixed nature of the evoked, compound responses. The kinetics of excitatory synaptic events were investigated in four cells of each type showing frequent spontaneous EPSPs at their resting Vm. Figure 11B shows average EPSPs (from ≥ 60 consecutive events not contaminated by action potentials) for one of each of the cell types. Cumulative histograms illustrate the range of decay time constants (τepsp) within each cell type, and the clear separation between cell types (Fig. 11C). Rise times (10–90 % of peak) and τepsp are summarised in Fig. 11D. Spontaneously occurring EPSPs in tonic cells were significantly longer than events in other cell types (Tukey tests; P < 0.01), except for a small subset of slow EPSPs sometimes observed in the other cell types. Rise times varied significantly across groups (ANOVA; P < 0.05), but no single group was significantly different from another (Tukey tests). Since these events were recorded in current clamp mode, the membrane time constant caused some temporal filtering but was not sufficient to explain the differences in τepsp between cell types (r2 = 0.15; t test; P > 0.13; Fig. 11E). Differences in rise times, which may reflect differences in the membrane time constant and electrotonic filtering of distal inputs, could account for some of the variability in τepsp but was still insufficient for a complete explanation (r2 = 0.336; t test; P < 0.05; Fig. 11F). This is further illustrated by comparing tonic and phasic cells which displayed the same average rise times, but still had significantly different τepsp (Fig. 11D and F). Furthermore, these two cell types had similar resting Vm, suggesting variation in Vm could not explain the difference in kinetics. Even the most hyperpolarised cell type, the single spike neuron, had significantly faster synaptic kinetics than tonic cells when their Vm was adjusted to −59 mV (18.1 ± 5.4 ms; t test; P < 0.01). Consistent with the above three arguments, the variance in τepsp between cell types was still significant after employing the membrane time constant, rise time and resting Vm as co-variates (ANOVA; P < 0.05).
Laminar distribution
Having developed a novel physiological classification scheme, we sought to test whether there was a differential distribution of cell types with laminar depth. Sampled cells were divided into those in the most dorsal (or superficial) part of lamina I (< 40 μm from the white matter and clearly inside the striated region; see Fig. 1), and those towards the border of lamina I and II (30–75 μm from the white matter and which appear close to the border of the striated region). Thirty cells were classified as dorsal lamina I and included representative cells from each physiological and morphological type. There was no statistically significant differential distribution of either morphological (χ2 = 3.8; d.f. = 2; P > 0.15) or physiological (χ2 = 6.3; d.f. = 3; P > 0.09) cell types between the dorsal and ventral divisions. Nonetheless, five of the seven delayed onset cells were partitioned to the border region, suggesting that this cell type may typically be more ventral and may correspond to cells in the dorsal-most extreme of lamina IIa, which corresponds to the dorsal-most portion of lamina IIo in cats and primates (Ribeiro-da-Silva, 1995). No obvious differential distribution of cell types along the medio-lateral axis of lamina I was observed.
Morphological classification
Defining morphological features
The defining morphological features and several examples of labelled cells are shown in Fig. 12. In accordance with past studies (Gobel, 1978a; Lima & Coimbra, 1986; Zhang et al. 1996; Yu et al. 1999), fusiform and pyramidal neurons were differentiated by somatic shape and whether they had two or three primary dendrites, respectively, which displayed relatively sparse branching proximal to the soma. Multipolar cells had four or more primary dendrites though the soma had no particularly consistent shape. The morphological heterogeneity within each cell type was nonetheless substantial and would, for instance, incorporate the A and B subtypes identified by Lima & Coimbra (1986) for both the fusiform and multipolar cells. On the basis of our criteria, the flattened cells of Lima & Coimbra (1986) would be classified as multipolar, though most of our multipolar cells branched quite extensively (see below).
Figure 12. Morphological cell types in lamina I.

All images are shown with the rostro-caudal axis oriented vertically. Panels on left show summed projections of confocal images of labelled neurons with the patch pipette still attached, as viewed in the original parasagittal plane with dorsal towards the left. Panels on right show 3-D reconstructions rotated 30–60 deg between parasagittal and horizontal planes such that morphology is optimally viewed for purposes of classification. Arrows point to axon-like processes. Letters in top right corner of each panel refer to the physiological classification of that cell: T, tonic; P, phasic; DO, delayed onset and SS, single spike. A, fusiform neurons had two primary dendrites emerging from opposite ends of a soma elongated in the rostro-caudal axis. B, pyramidal neurons had three primary dendrites emerging from separate points of a triangularly shaped soma. Summed projections (in the parasagittal plane) show the necessity of resolving cell geometry in the Z-axis for classification, lest pyramidal cells be misclassified as fusiform. C, multipolar neurons had at least four primary dendrites that tended to arborise quite extensively, resulting in comparatively high order branches existing in proximity to the soma.
In six fusiform cells and two pyramidal cells, an axon-like process could be seen emerging from the soma or primary dendrite. In all but one of those neurons, local collateral branching of this axon was not observed although the neurite could occasionally be followed for up to 80 μm; the one exception was atypical in that the neuron displayed a delayed onset firing pattern which is more common amongst multipolar cells (see below). In multipolar cells, one to four thin processes could be seen to emerge from the soma and/or primary dendrites and occasionally branch; however, differentiating these processes from true dendrites and, in turn, identifying them as axons was uncertain but, noteably, such multiple thin processes are consistent with the axon-like processes described by Lima & Coimbra (1986) in their multipolar cells. Overall, axonal labelling was inadequate to draw firm conclusions.
Morphometric analysis
Given the central role of somatic shape for morphological classification, we investigated somatic dimensions by measuring the ratio of rostro-caudal length to dorso-ventral width as well as somatic area as viewed in the parasagittal plane. Consistent with somatic shape, the length:width ratio varied significantly across cell types (Table 2; ANOVA; P < 0.01) based on combined differences in length (fusiform, 20.6 ± 5.0 μm; pyramidal, 18.6 ± 2.7 μm and multipolar, 16.0 ± 2.8 μm) and width (fusiform, 9.5 ± 2.5 μm; pyramidal, 11.0 ± 3.1 μm and multipolar, 11.0 ± 2.8 μm). Based on area measurements, multipolar cells tended to be the smallest cell type (Table 2; ANOVA; P = 0.05). Consistent with a difference in cell size, the thickness of the primary dendrites in multipolar cells was significantly smaller than in the other cell types (Table 2; ANOVA; P < 0.05). Further consistent with their smaller size, multipolar cells tended to have a lower total capacitance than fusiform and pyramidal cells (Table 1). Although there are some giant cells (sometimes referred to as Waldeyer cells) in lamina I, they represent a small minority of the total cells (Willis & Coggeshall, 1991) and are not represented among the neurons sampled in this study.
Table 2.
Morphometric analysis
| Fusiform | Pyramidal | Multipolar | P | |
|---|---|---|---|---|
| Soma rostro-caudal length to dorso-ventral width ratio* | 2.3 ± 0.2 | 1.8 ± 0.2 | 1.5 ± 0.1 | 0.005 |
| Soma area (μm2)* | 176 ± 15 | 161 ± 13 | 136 ± 6 | 0.053 |
| Thickness of primary dendrites (μm)* | 2.5 ± 0.2 | 2.4 ± 0.2 | 1.9 ± 0.1 | 0.028 |
| Ventral spread of dendrites (μm)* | 52 ± 8 | 60 ± 8 | 85 ± 7 | 0.008 |
| Number of primary dendrites | 2 | 3 | 4–7 | — |
| Highest branch order within 60 μm radius† | 3 (1–5) | 3 (1–6) | 5 (3–7) | < 0.001 |
| Spiny‡: yes | 3 | 2 | 9 | 0.153 |
| no | 13 | 7 | 10 |
Data reported as means ±s.e.m. and P values are for one-way ANOVAs
data reported as median (range) and P value is for Kruskal-Wallis test
P value is for X2 test.
Consistent with descriptions by Lima & Coimbra (1986), dendritic spread was greatest in the rostro-caudal axis for all cell types and was particularly remarkable in fusiform cells. Maintaining these dendrites intact is one of the significant benefits of the parasagittal slice over the transverse slice, and we were in fact able to follow labelled dendrites over several hundred micrometres and up to >1 mm in the rostro-caudal axis. We focussed our measurements on the dorso-ventral spread of dendrites given its particular functional relevance for interlaminar communications. The dorso-ventral extent of dendrites varied significantly between cell types (Table 2; ANOVA; P < 0.001), with dendrites of multipolar cells spreading much further ventrally than those of the other cell types. Given that the soma is positioned within ∼20 μm of the dorsal border of this dorso-ventral spread, the dendritic spread is predominantly ventral and presumably well into lamina II in the case of multipolar cells. Compounding this was the extensiveness of dendritic branching, which was significantly higher in multipolar cells (Table 2; Kruskal-Wallis test; P < 0.001) as is clearly evident in Fig. 12. The proportion of spiny cells did not appear to differ significantly between cell types although they were more common amongst multipolar cells (Table 2; χ2 test; P = 0.153).
Correlation between morphological and physiological cell types
A correlation between morphological and physiological cell types was found and is summarised in Table 3 (χ2 = 36.3, d.f. = 6; P < 0.001). As suggested by the examples shown in Fig. 2 and Fig. 12, tonic cells corresponded to fusiform cells, and delayed onset and single spike cells corresponded to multipolar cells. Phasic cells may correspond to pyramidal cells, but this correlation was not as strong as the other groupings. The correlation was unaffected by limiting analysis to the 37 cells ‘correctly’ identified through K-means clustering (see above; χ2 = 36.2; P < 0.001). After limiting the analysis to the 30 cells located most dorsally within lamina I (see above), the correlation also remained statistically significant (χ2 = 18.3; P < 0.01). There were no obvious additional morphological features (e.g. Table 2) that suggested further subdivisions of morphological classes or re-classification to improve this correlation.
Table 3.
Morphological and physiological cell types are correlated
| Fusiform | Pyramidal | Multipolar | Row totals | |
|---|---|---|---|---|
| Tonic | 12 (5.5) | 3 (3.1) | 0 (6.5) | 15 |
| Phasic | 3 (2.9) | 4 (1.6) | 1 (3.5) | 8 |
| Delayed onset | 0 (2.5) | 0 (1.4) | 7 (3.0) | 7 |
| Single spike | 1 (5.1) | 2 (2.9) | 11 (6.0) | 14 |
| Column totals | 16 | 9 | 19 | 44 |
Expected frequencies are shown inside parentheses. x2= 36.3, degrees of freedom = 6; P < 0.001.
DISCUSSION
This study shows that intrinsic membrane properties vary widely between spinal lamina I neurons resulting in qualitative differences in response characteristics within this cell population. We propose a simple classification scheme wherein cells are classified as one of four types (tonic, phasic, delayed onset, or single spike) based on their firing pattern. Pattern of firing in turn relates to other response characteristics which influence the frequency and timing of action potentials elicited under different stimulus conditions. Cluster analysis, differences in synaptic kinetics, and a morphological correlation argue that this physiological classification identifies the natural categories of neurons present in lamina I. The physiological heterogeneity in conjunction with the morphological correlation argues that different components of the circuitry of lamina I possess different signal processing characteristics.
Physiological classification
Thorough characterisation of membrane properties has been previously carried out in the spinal dorsal horn though not specifically in lamina I (Thomson et al. 1989; Yoshimura & Jessell, 1989; Lopez-Garcia & King, 1994; Jo et al. 1998) although the heterogeneity of firing properties of lamina I neurons has been noted (Han et al. 1998). Li et al. (2000) identified two populations of neurons in the marginal zone of the medullary dorsal horn that resemble the tonic and delayed onset cells described here. Yoshimura & Jessell (1989) also described a voltage-sensitive delay to spiking in lamina II neurons. The cell types identified here correspond most closely to those described by Thomson et al. (1989), with good correspondence between our tonic, phasic and single spike categories and their categories 1, 2 and 3, respectively. However, it is important to stress that comparison between studies warrants caution as cells were sampled from different laminae, recorded with different techniques under different conditions, and classified according to different schemes.
The results of this study clearly reveal that using isolated responses can lead to misclassification. For example, with strong stimulation, tonic cells can be misconstrued as phasic cells and vice versa and with mild stimulation, phasic and single spike cells can be indistinguishable by spiking pattern alone. Resting Vm may also have confounding effects as seen when distinguishing between tonic and delayed onset neurons. These confounding influences can be controlled for, but classification is most robust if spiking pattern is considered in combination with other features like the stimulus-response curve, rheobase, AHP kinetics, etc. Thus, while previous studies have certainly highlighted heterogeneity in firing patterns, equating cell types identified in those studies warrants some degree of caution. Hopefully, the signal processing characteristics reflected in the integrative properties and stimulus-response curves presented here will provide a stable reference to facilitate future comparisons.
Correlation between physiological classification and morphology
The morphology and frequency of our fusiform (36 %), pyramidal (20 %), and multipolar (43 %) cells correspond well with that found by Lima & Coimbra (1986) using the Golgi technique in the rat (fusiform, 39 %; pyramidal, 25 %; mutlipolar/flattened, 36 %). This correspondence would argue that our sampling of lamina I neurons for recording was not biased for or against any particular morphological type, except for the giant (Waldeyer) cells which represent a very small proportion of the cell population (Willis & Coggeshall, 1991) and were not sampled in this study.
While no single cell type can be definitively identified as being a projection neuron vs. an excitatory or inhibitory interneuron, the fact that our densely branching multipolar cells do not resemble cell types commonly observed in retrograde labelling studies (Lima & Coimbra, 1988, 1989; Zhang et al. 1996; Yu et al. 1999) may suggest that they represent local interneurons. For instance, slightly more ventrally positioned multipolar cells may actually be stalked cells at the lamina I/II border (Gobel, 1978b; Bennett et al. 1980; Todd & Lewis, 1986) indicating a subset of them may constitute excitatory interneurons (Gobel, 1978b; Todd & McKenzie, 1989). On the other hand, Lima et al. (1993) have provided evidence that some multipolar cells are preferentially GABAergic, suggesting a separate subset may represent local inhibitory interneurons. More firmly establishing such relationships is an important goal for future studies.
Variations in cell morphology and primary afferent input patterns have long been known in lamina I, however, attempts to establish a relationship between these two features have often been unsuccessful (Light et al. 1979; Woolf & Fitzgerald, 1983; Hylden et al. 1986; Rèthelyi et al. 1989). Han et al. (1998) only recently showed that such a relationship may exist among lamina I neurons of the cat, where different morphological cell types respond to different modalities and/or intensities of cutaneous stimulation. They also briefly noted differences in how cell types responded to depolarising current injection suggesting a correspondence between cutaneous input and biophysical properties of the spinal neuron; however, the correlation they describe between morphology and firing pattern does not match that described in this study. Several explanations are possible including differences in the exact basis for physiological classification (e.g. testing with a single stimulus intensity as opposed to a range of intensities) and some of the confounding factors illustrated in this paper (e.g. see Fig. 5). Given the differences in recording conditions, it is also possible that Han and colleagues predominantly sampled different neurons (e.g. larger neurons or neurons in a particular medio-lateral position) which would be consistent with subtle morphological differences between our studies (e.g. dendritic branching in their multipolar neurons was much less dense than that described in the present study).
The correlation between morphological and physiological cell types raises the question of whether the relationship between neuronal form and intrinsic function may be partly causal rather than purely correlative in nature (Connors & Regehr, 1996). For example, the dense dendritic branching proximal to the soma of single spike neurons (multipolar) may explain the high frequency of tetrototoxin-insensitive synaptic events by providing for a large number of input synapses to the cell; such a high number of synapses might be required to increase the likelihood of coincident EPSPs and thus provide the spatial summation necessary to drive these cells to fire, given their high rheobase and fast membrane time constant. In contrast, the long, sparsely branching dendrites of tonic cells (fusiform) may promote electrotonic filtering (and therefore lengthening) of synaptic events and thereby promote integration of inputs by this cell type. Indeed, dendritic geometry has been shown to be important for coincidence detection (Agmon-Snir et al. 1998) and spiking pattern (Mainen & Sejnowski, 1996).
Significance of membrane properties for signal processing
Physiological cell types exhibit significant differences in their stimulus-response properties in both amplitude and time domains. Tonic cells were able to linearly transduce stimulus intensity into firing frequency and tended to sum (or integrate) inputs as evident from responses to stimulus trains. Delayed onset cells were also able to fire repetitively over a range of stimulus intensities, but typically achieved this firing after a pronounced delay and initial slow firing frequency which was sensitive to membrane potential; these properties caused a disproportionately small number of spikes to be elicited by short stimulation compared with prolonged stimulation in this cell type, which was evident in responses to synaptic input and stimulus trains. In contrast, phasic neurons were optimally excited by short stimulation given their rapid spike frequency adaptation and tendency to discontinue firing before the end of the stimulus and, furthermore, tended not to rely on summation of inputs for spike generation. Lastly, the single spike neurons responded with only one action potential (or a very short burst) at the stimulus onset; this cell type was therefore incapable of encoding stimulus intensity through firing frequency but, more than any other cell type, it could follow high frequency stimulus trains.
These transduction properties in conjunction with differences in rheobase and passive membrane properties culminate in differently shaped stimulus-response curves and suggest cell types operate in different modes (see below). This is compounded by the observation that synaptic kinetics vary significantly between cell types: tonic cells exhibited synaptic events with slow kinetics whereas phasic, single spike, and delayed onset cells exhibited predominantly fast synaptic events with only a small minority of EPSPs having slow kinetics. Interestingly, primary afferents display an analogous matching of input with transduction: neurons associated with slowly adapting peripheral receptors respond to somatic depolarisation with a prolonged discharge whereas neurons associated with rapidly adapting receptors respond with a brief discharge (Harper, 1991). Within the deep dorsal horn, a match between cutaneous input and response properties of the postsynaptic cell and/or network also appears to exist (Koerber et al. 1991). It remains to be determined whether the different cell types described in this study encode different stimulus modalities and, by extension, receive different primary afferent input but such a relationship is certainly conceivable.
The output spike trains of the four different cell types described in this study clearly differ as a result of how each cell type processes its input. Contrasting tonic with single spike neurons, synaptic kinetics and intrinsic membrane properties appear to promote integration and coincidence detection, respectively. Single spike neurons require a large amount of coincident input to allow the spatial summation necessary to drive spiking, given that their rheobase is high and that their fast synaptic events and fast membrane time constant do not promote temporal summation (Kempter et al. 1998). Moreover, the short delay to spiking and ability to follow high frequency inputs allow single spike neurons to relay faithfully high frequency information; interestingly, coincidence detectors in the auditory brainstem similarly respond with one spike when tonically depolarised (Wagner, 1994; Agmon-Snir et al. 1998). In contrast, tonic cells respond in a graded fashion over a wide range of stimulus intensities and their slow synaptic events and slow membrane time constant will promote temporal summation, or integration.
The ramifications of these differences in signal processing characteristics will not be fully appreciated until we understand the interconnectivity of cell types and the input generated by cutaneous stimulation that drives this network of cells. Nonetheless, a comprehensive understanding of the sensory processing that occurs in lamina I will require a detailed understanding of the biophysical properties described in this study.
Acknowledgments
This work was supported by Canadian Institutes of Health Research grant MT12942, Natural Science and Engineering Research Council grant 171034 and a team grant from the Québec FCAR. S.A.P. is a recipient of an MD/PhD studentship from CIHR and Y.D.K is a Scholar of the Québec FRSQ. We thank Dr S. Ratté for helpful comments on the manuscript.
REFERENCES
- Agmon-Snir H, Carr CE, Rinzel J. The role of dendrites in auditory coincidence detection. Nature. 1998;393:268–272. doi: 10.1038/30505. [DOI] [PubMed] [Google Scholar]
- Alger BE, Dhanjal SS, Dingledine R, Garthwaite J, Henderson G, King GL, Lipton P, North A, Schwartzkroin PA, Sears TA, Segal M, Whittingham TS, Williams J. Brain slice methods. In: Dingledine R, editor. Brain Slices. New York: Plenum Press; 1984. pp. 381–437. [Google Scholar]
- Barry PH, Lynch JW. Liquid junction potentials and small cell effects in patch-clamp analysis. Journal of Membrane Biology. 1991;121:101–117. doi: 10.1007/BF01870526. [DOI] [PubMed] [Google Scholar]
- Bennett GJ, Abdelmoumene M, Hayashi H, Dubner R. Physiology and morphology of substantia gelatinosa neurons intracellularly stained with horseradish peroxidase. Journal of Comparative Neurology. 1980;194:809–827. doi: 10.1002/cne.901940407. [DOI] [PubMed] [Google Scholar]
- Bester H, Chapman V, Besson J-M, Bernard JF. Physiological properties of the lamina I spinoparabrachial neurons in the rat. Journal of Neurophysiology. 2000;83:2239–2259. doi: 10.1152/jn.2000.83.4.2239. [DOI] [PubMed] [Google Scholar]
- Chéry N, De Koninck Y. Junctional versus extrajunctional glycine and GABAA receptor-mediated IPSCs in identified lamina I neurons of the adult rat spinal cord. Journal of Neuroscience. 1999;19:7342–7355. doi: 10.1523/JNEUROSCI.19-17-07342.1999. [DOI] [PMC free article] [PubMed] [Google Scholar]
- Chéry N, Yu XH, De Koninck Y. Visualization of lamina I of the dorsal horn in live adult rat spinal cord slices. Journal of Neuroscience Methods. 2000;96:133–142. doi: 10.1016/s0165-0270(99)00195-8. [DOI] [PubMed] [Google Scholar]
- Cheunsuang O, Morris R. Spinal lamina I neurons that express neurokinin 1 receptors: morphological analysis. Neuroscience. 2000;97:335–345. doi: 10.1016/s0306-4522(00)00035-x. [DOI] [PubMed] [Google Scholar]
- Christensen BN, Perl ER. Spinal neurons specifically excited by noxious or thermal stimuli: marginal zone of the dorsal horn. Journal of Neurophysiology. 1970;33:293–307. doi: 10.1152/jn.1970.33.2.293. [DOI] [PubMed] [Google Scholar]
- Connor JA, Stevens CF. Prediction of repetitive firing behaviour from voltage clamp data on an isolated neurone soma. Journal of Physiology. 1971;213:31–53. doi: 10.1113/jphysiol.1971.sp009366. [DOI] [PMC free article] [PubMed] [Google Scholar]
- Connors BW, Gutnick MJ. Intrinsic firing patterns of diverse neocortical neurons. Trends in Neurosciences. 1990;13:99–104. doi: 10.1016/0166-2236(90)90185-d. [DOI] [PubMed] [Google Scholar]
- Connors BW, Regehr WG. Neuronal firing: does function follow form. Current Biology. 1996;6:1560–1562. doi: 10.1016/s0960-9822(02)70771-9. [DOI] [PubMed] [Google Scholar]
- Craig AD. Touch, Temperature, and Pain in Health and Disease. WA, USA: Seattle; 1994. Spinal and supraspinal processing of specific pain and temperature; pp. 421–437. [Google Scholar]
- Craig AD. The functional anatomy of lamina I and its role in post-stroke pain. Progress in Brain Research. 2000;129:137–151. doi: 10.1016/S0079-6123(00)29010-9. [DOI] [PubMed] [Google Scholar]
- Craig AD, Kniffki K-D. Spinothalamic lumbosacral lamina I cells responsive to skin and muscle stimulation in the cat. Journal of Physiology. 1985;365:197–221. doi: 10.1113/jphysiol.1985.sp015767. [DOI] [PMC free article] [PubMed] [Google Scholar]
- Craig AD, Krout K, Andrew D. Quantitative response characteristics of thermoreceptive and nociceptive lamina I spinothalamic neurons in the cat. Journal of Neurophysiology. 2001;86:1459–1480. doi: 10.1152/jn.2001.86.3.1459. [DOI] [PubMed] [Google Scholar]
- Crill WE, Schwindt P. Ionic mechanisms underlying excitation-to-frequency transduction: studies by voltage clamp methods. Archives Italiennes de Biologie. 1984;122:31–41. [PubMed] [Google Scholar]
- Dodt H-U, Frick A, Kampe K, Zieglgansberger W. NMDA and AMPA receptors on neocortical neurons are differentially distributed. European Journal of Neuroscience. 1998;10:3351–3357. doi: 10.1046/j.1460-9568.1998.00338.x. [DOI] [PubMed] [Google Scholar]
- Engel J, Schultens HA, Schild D. Small conductance potassium channels cause an activity-dependent spike frequency adaptation and make the transfer function of neurons logarithmic. Biophysical Journal. 1999;76:1310–1319. doi: 10.1016/S0006-3495(99)77293-0. [DOI] [PMC free article] [PubMed] [Google Scholar]
- Gobel S. Golgi studies of the neurons in layer I of the dorsal horn of the medulla (trigeminal nucleus caudalis) Journal of Comparative Neurology. 1978a;180:375–393. doi: 10.1002/cne.901800212. [DOI] [PubMed] [Google Scholar]
- Gobel S. Golgi studies of the neurons in layer II of the dorsal horn of the medulla (trigeminal nucleus caudalis) Journal of Comparative Neurology. 1978b;180:395–413. doi: 10.1002/cne.901800213. [DOI] [PubMed] [Google Scholar]
- Gustafsson B. Afterpotentials and transduction properties in different types of central neurones. Archives Italiennes de Biologie. 1984;122:17–30. [PubMed] [Google Scholar]
- Han ZS, Zhang ET, Craig AD. Nociceptive and thermoreceptive lamina I neurons are anatomically distinct. Nature Neuroscience. 1998;1:218–225. doi: 10.1038/665. [DOI] [PubMed] [Google Scholar]
- Harper AA. Similarities between some properties of the soma and sensory receptors of primary afferent neurones. Experimental Physiology. 1991;76:369–377. doi: 10.1113/expphysiol.1991.sp003504. [DOI] [PubMed] [Google Scholar]
- Hille B. Ionic Channels of Excitable Membranes. Sunderland, MA, USA: Sinauer Associates; 1992. [Google Scholar]
- Hylden JL, Hayashi H, Dubner R, Bennett GJ. Physiology and morphology of the lamina I spinomesencephalic projection. Journal of Comparative Neurology. 1986;247:505–515. doi: 10.1002/cne.902470410. [DOI] [PubMed] [Google Scholar]
- Jack JJB, Noble D, Tsien RY. Electric Current Flow in Excitable Cells. Oxford, UK: Clarendon Press; 1975. [Google Scholar]
- Jo YH, Stoeckel ME, Schlichter R. Electrophysiological properties of cultured neonatal rat dorsal horn neurons containing GABA and met-enkephalin-like immunoreactivity. Journal of Neurophysiology. 1998;79:1583–1586. doi: 10.1152/jn.1998.79.3.1583. [DOI] [PubMed] [Google Scholar]
- Kang J, Huguenard JR, Prince DA. Voltage-gated potassium channels activated during action potentials in layer V neocortical pyramidal neurons. Journal of Neurophysiology. 2000;83:70–80. doi: 10.1152/jn.2000.83.1.70. [DOI] [PubMed] [Google Scholar]
- Kempter R, Gertner W, van Hemmen JL. How the threshold of a neuron determines its capacity for coincidence detection. Biosystems. 1998;48:105–112. doi: 10.1016/s0303-2647(98)00055-0. [DOI] [PubMed] [Google Scholar]
- Koch C. Biophysics of Computation. New York: Oxford University Press; 1999. [Google Scholar]
- Koerber HR, Seymour AW, Mendell LM. Tuning of spinal networks to frequency components of spike trains in individual afferents. Journal of Neuroscience. 1991;11:3178–3187. doi: 10.1523/JNEUROSCI.11-10-03178.1991. [DOI] [PMC free article] [PubMed] [Google Scholar]
- König P, Engel AK, Singer W. Integrator or coincidence detector? The role of the cortical neuron revisited. Trends in Neurosciences. 1996;19:130–137. doi: 10.1016/s0166-2236(96)80019-1. [DOI] [PubMed] [Google Scholar]
- Laing I, Todd AJ, Heizmann CW, Schmidt HH. Subpopulations of GABAergic neurons in laminae I-III of rat spinal dorsal horn defined by coexistence with classical transmitters, peptides, nitric oxide synthase or parvalbumin. Neuroscience. 1994;61:123–132. doi: 10.1016/0306-4522(94)90065-5. [DOI] [PubMed] [Google Scholar]
- Li YQ, Li H, Yang K, Kaneko T, Mizuno N. Morphologic features and electrical membrane properties of projection neurons in the marginal layer of the medullary dorsal horn of the rat. Journal of Comparative Neurology. 2000;424:24–36. doi: 10.1002/1096-9861(20000814)424:1<24::aid-cne2>3.0.co;2-m. [DOI] [PubMed] [Google Scholar]
- Light AR. The Initial Processing of Pain and Its Decending Control: Spinal and Trigeminal Systems. Basel, Switzerland: Karger; 1992. [Google Scholar]
- Light AR, Trevino DL, Perl ER. Morphological features of functionally defined neurons in the marginal zone and substantia gelatinosa of the spinal dorsal horn. Journal of Comparative Neurology. 1979;186:151–171. doi: 10.1002/cne.901860204. [DOI] [PubMed] [Google Scholar]
- Lima D. Functional anatomy of spinofugal nociceptive pathways. Pain Reviews. 1997;4:1–19. [Google Scholar]
- Lima D, Avelino A, Coimbra A. Morphological characterization of marginal (lamina I) neurons immunoreactive for substance P, enkephalin, dynorphin and gamma-aminobutyric acid in the rat spinal cord. Journal of Chemical Neuroanatomy. 1993;6:43–52. doi: 10.1016/0891-0618(93)90006-p. [DOI] [PubMed] [Google Scholar]
- Lima D, Coimbra A. A Golgi study of the neuronal population of the marginal zone (lamina I) of the rat spinal cord. Journal of Comparative Neurology. 1986;244:53–71. doi: 10.1002/cne.902440105. [DOI] [PubMed] [Google Scholar]
- Littlewood NK, Todd AJ, Spike RC, Watt C, Shehab SA. The types of neuron in spinal dorsal horn which possess neurokinin-1 receptors. Neuroscience. 1995;66:597–608. doi: 10.1016/0306-4522(95)00039-l. [DOI] [PubMed] [Google Scholar]
- Llinás RR. The intrinsic electrophysiological properties of mammalian neurons: insights into central nervous system function. Science. 1988;242:1654–1664. doi: 10.1126/science.3059497. [DOI] [PubMed] [Google Scholar]
- Lopez-Garcia JA, King AE. Membrane properties of physiologically classified rat dorsal horn neurons in vitro: correlation with cutaneous sensory afferent input. European Journal of Neuroscience. 1994;6:998–1007. doi: 10.1111/j.1460-9568.1994.tb00594.x. [DOI] [PubMed] [Google Scholar]
- Ma W, Ribeiro-da-Silva A, De Koninck Y, Radhakrishnan V, Henry JL, Cuello AC. Quantitative analysis of substance P-immunoreactive boutons on physiologically characterized dorsal horn neurons in the cat lumbar spinal cord. Journal of Comparative Neurology. 1996;376:45–64. doi: 10.1002/(SICI)1096-9861(19961202)376:1<45::AID-CNE3>3.0.CO;2-O. [DOI] [PubMed] [Google Scholar]
- Mainen ZF, Sejnowski TJ. Influence of dendritic structure on firing pattern in model neocortical neurons. Nature. 1996;382:363–366. doi: 10.1038/382363a0. [DOI] [PubMed] [Google Scholar]
- Mantyh PW, Rogers SD, Honore P, Allen BJ, Ghilardi JR, Li J, Daughters RS, Lappi DA, Wiley RG, Simone DA. Inhibition of hyperalgesia by ablation of lamina I spinal neurons expressing the substance P receptor. Science. 1997;278:275–279. doi: 10.1126/science.278.5336.275. [DOI] [PubMed] [Google Scholar]
- Morisset V, Nagy F. Nociceptive integration in the rat spinal cord: role of non-linear membrane properties of deep dorsal horn neurons. European Journal of Neuroscience. 1998;10:3642–3652. doi: 10.1046/j.1460-9568.1998.00370.x. [DOI] [PubMed] [Google Scholar]
- Perl ER. Pain and nociception. In: Darian-Smith I, editor. Sensory Processes. Bethesda, MD, USA: American Physiological Society; 1984. pp. 915–975. [Google Scholar]
- Prescott SA, De Koninck Y. Membrane properties of identified lamina I neurons in the adult rat spinal cord dorsal horn. Society for Neuroscience Abstracts. 1999;25:149. [Google Scholar]
- Prescott SA, De Koninck Y. Voltage sensitivity of integrative properties in lamina I and II neurons of the adult rat spinal dorsal horn. Society for Neuroscience Abstracts. 2000;26:1140. [Google Scholar]
- Rèthelyi M, Light AR, Perl ER. Synaptic ultrastructure of functionally and morphologically characterized neurons of the superficial spinal dorsal horn of cat. Journal of Neuroscience. 1989;9:1846–1863. doi: 10.1523/JNEUROSCI.09-06-01846.1989. [DOI] [PMC free article] [PubMed] [Google Scholar]
- Ribeiro-da-Silva A. Substantia gelatinosa of spinal cord. In: Paxinos G, editor. The Rat Nervous System. Sydney, Australia: Academic Press; 1995. pp. 47–59. [Google Scholar]
- Rinzel J, Ermentrout GB. Analysis of neural excitability and oscillations. In: Koch C, Segev I, editors. Methods in Neuronal Modeling: From Ions to Networks. Cambridge, MA, USA: MIT Press; 1998. pp. 251–291. [Google Scholar]
- Staley KJ, Otis TS, Mody I. Membrane properties of dentate gyrus granule cells: comparison of sharp microelectrode and whole-cell recordings. Journal of Neurophysiology. 1992;67:1346–1358. doi: 10.1152/jn.1992.67.5.1346. [DOI] [PubMed] [Google Scholar]
- Thomson AM, West DC, Headley PM. Membrane characteristics and synaptic responsiveness of superficial dorsal horn neurons in a slice preparation of adult rat spinal cord. European Journal of Neuroscience. 1989;1:479–488. doi: 10.1111/j.1460-9568.1989.tb00354.x. [DOI] [PubMed] [Google Scholar]
- Todd AJ, Lewis SG. The morphology of Golgi-stained neurons in lamina II of the rat spinal cord. Journal of Anatomy. 1986;149:113–119. [PMC free article] [PubMed] [Google Scholar]
- Todd AJ, McKenzie J. GABA-immunoreactive neurons in the dorsal horn of the rat spinal cord. Neuroscience. 1989;31:799–806. doi: 10.1016/0306-4522(89)90442-9. [DOI] [PubMed] [Google Scholar]
- Trevino DL. The origin and projections of a spinal nociceptive and thermoreceptive pathway. In: Zotterman Y, editor. Sensory Functions of the Skin. Oxford, UK: Pergamon Press; 1976. pp. 367–376. [Google Scholar]
- Velumian AA, Carlen PL. Differential control of three after-hyperpolarizations in rat hippocampal neurones by intracellular calcium buffering. Journal of Physiology. 1999;517:201–216. doi: 10.1111/j.1469-7793.1999.0201z.x. [DOI] [PMC free article] [PubMed] [Google Scholar]
- Wagner T. Intrinsic properties of identified neurones in the central nucleus of mouse inferior colliculus. Neuroreport. 1994;6:89–93. doi: 10.1097/00001756-199412300-00024. [DOI] [PubMed] [Google Scholar]
- Willis WD. The Pain System: The Neural Basis of Nociceptive Transmission in the Mammalian Nervous System. Basel, Switzerland: Karger; 1985. [PubMed] [Google Scholar]
- Willis WD, Coggeshall RE. Sensory Mechanisms of the Spinal Cord. New York: Plenum Press; 1991. [Google Scholar]
- Woolf CJ, Fitzgerald M. The properties of neurones recorded in the superficial dorsal horn of the rat spinal cord. Journal of Comparative Neurology. 1983;221:313–328. doi: 10.1002/cne.902210307. [DOI] [PubMed] [Google Scholar]
- Yoshimura M, Jessell TM. Membrane properties of rat substantia gelatinosa neurons in vitro. Journal of Neurophysiology. 1989;62:109–118. doi: 10.1152/jn.1989.62.1.109. [DOI] [PubMed] [Google Scholar]
- Yu XH, Zhang ET, Craig AD, Shigemoto R, Ribeiro-da-Silva A, De Koninck Y. NK-1 receptor immunoreactivity in distinct morphological types of lamina I neurons of the primate spinal cord. Journal of Neuroscience. 1999;19:3545–3555. doi: 10.1523/JNEUROSCI.19-09-03545.1999. [DOI] [PMC free article] [PubMed] [Google Scholar]
- Zhang ET, Han ZS, Craig AD. Morphological classes of spinothalamic lamina I neurons in the cat. Journal of Comparative Neurology. 1996;367:537–549. doi: 10.1002/(SICI)1096-9861(19960415)367:4<537::AID-CNE5>3.0.CO;2-5. [DOI] [PubMed] [Google Scholar]
- Zhang L, Weiner JL, Valiante TA, Velumian AA, Watson PL, Jahromi SS, Schertzer S, Pennefather P, Carlen PL. Whole-cell recording of the Ca2+-dependent slow afterhyperpolarization in hippocampal neurones: effects of internally applied anions. Pflügers Archiv. 1994;426:247–253. doi: 10.1007/BF00374778. [DOI] [PubMed] [Google Scholar]