

Abstract
Auditory nerve fibres make large excitatory synaptic contacts, the endbulbs of Held, with bushy cells in the anteroventral cochlear nucleus (AVCN). We have used serial-section electron microscopy to reconstruct seven endbulbs of Held in contact with three different AVCN bushy cells from a 25-day-old rat, as a basis for interpreting our previous physiological results at this connection. Four endbulbs of Held contacting the same bushy cell were completely reconstructed. The number of separate synaptic specializations within these endbulbs varied from 85 to 217, with a mean of 155. Detailed measurements were obtained from high magnification segments of four endbulbs contacting three different bushy cells. Large variability was found in the size of synaptic specializations within an individual endbulb. The size of postsynaptic densities (PSDs) varied between endbulbs (mean PSD area 0.03, 0.07, 0.07 and 0.18 μm2; n = 4 endbulbs). The number of morphologically docked vesicles at individual specializations within the same endbulb varied considerably (between 1 and 102). The mean number of morphologically docked vesicles per specialization differed between endbulbs (mean numbers of docked vesicles per specialization = 2.1, 3.7, 5.3, 14.8; n = 4 endbulbs). Despite these large differences, the density of docked vesicles per square micron of PSD was similar between endbulbs (54, 80, 81, 83 docked vesicles per μm2; n = 4 endbulbs). Within an endbulb, a linear relationship was found between the number of docked vesicles and PSD area, and between PSD area and the number of undocked vesicles within 150 nm of the active zone. The ratio of undocked vesicles (< 150 nm) to docked vesicles ranged from 2 to 5 in different endbulbs (n = 4 endbulbs). These structural observations are discussed in relation to the functional properties of synaptic transmission between endbulbs of Held and bushy cells in the AVCN.
Synaptic structure plays a key role in most theories of synaptic transmission (Walmsley et al. 1998). Quantal models relate the strength of synaptic transmission between neurons to the total number of release sites (or number of available vesicles), the probability of release at each site, and the postsynaptic response at all sites. The probability of release may be influenced by structural features such as the number of docked vesicles per release site, which in turn may be related to the size of the presynaptic active zone (Walmsley et al. 1998; Schikorski & Stevens, 1999). The number of activated postsynaptic receptor channels is determined by the concentration and time course of neurotransmitter in the synaptic cleft, which also depends on structural features such as the geometry and volume of the cleft and extrajunctional region (Clements, 1996). The postsynaptic response may be influenced by the number and density of postsynaptic receptors, which in turn may be related to the size of the postsynaptic density (Nusser et al. 1997; Lim et al. 1999; MacKenzie et al. 1999; Nusser, 2000). At connections involving multiple contacts, where release sites are closely spaced, there is the possibility of accumulation of neurotransmitter in the synaptic cleft following simultaneous release of neurotransmitter from multiple active zones, and potential interactions between adjacent specializations (Trussell et al. 1993; Barbour et al. 1994; Silver et al. 1996).
In the present study, we have investigated the ultrastructural details of large auditory nerve terminals (endbulbs of Held; Lenn & Reese, 1966; Cant & Morest, 1979; Ryugo & Sento, 1991; Ryugo et al. 1996, 1997), contacting bushy cells in the anteroventral cochlear nucleus (AVCN). In the rat AVCN, previous electron microscopy has confirmed the characteristically large endbulbs of Held (Gentschev & Sotelo, 1973; Sotelo et al. 1976; Neises et al. 1982; Rees et al. 1985; Wang et al. 1998), but no detailed serial-section reconstruction studies have been reported. Serial-section reconstructions are essential for revealing the complete morphology of synaptic connections. We have performed serial-section electron microscopy to examine and reconstruct endbulb-bushy cell connections in the rat AVCN in order to provide insight into our physiological observations (Isaacson & Walmsley, 1995a, b, 1996; Bellingham et al. 1998, 1999; Oleskevich & Walmsley, 2000; Oleskevich et al. 2000). Our results provide quantitative information on the morphology of endbulbs, on the number, size and proximity of endbulb release sites, and on the distribution of the populations of morphologically docked and undocked synaptic vesicles within these terminals.
METHODS
A 25-day-old Wistar rat was anaesthetized by intraperitoneal injection of sodium pentobarbitone (35 mg kg−1), and perfused (transcardiac) with phosphate buffer (0.1 m), followed by 2.5 % glutaraldehyde and 2.5 % paraformaldehyde in 0.1 m phosphate buffer (pH 7.2− 7.4), according to the University Animal Ethics Committee guidelines and approval. (A 25-day-old rat was specifically chosen since it represents a developmental age at which transmission is mediated by AMPA receptors, with little or no contribution from NMDA receptors which are present earlier in development (Isaacson & Walmsley, 1995b; Bellingham et al. 1998). In addition, it is technically very difficult to obtain viable slices of AVCN for physiological experiments using rats older than about 3 weeks, and we wished to obtain structural information relevant to our electrophysiological results.) Following perfusion, the brainstem was removed and the rostral half of the anteroventral cochlear nucleus blocked for subsequent electron microscopy. The tissue was post-fixed overnight in the same fixative at 4 °C. The tissue underwent secondary fixation in 1 % OsO4 for 1 h, was dehydrated through a graded series of alcohols, and embedded in Spurr's resin (Spurr, 1969). Serial sections approximately 100 nm thick (silver/gold) were cut using a Diatome diamond knife and a Reichert Ultracut microtome. Sections were collected on copper single slot grids (2 × 1 mm) coated with collodion nitrocellulose film. Sections were dried overnight, then drop stained for contrast with 1 % aqueous uranyl acetate/lead citrate (Reynolds, 1963). Sections were examined and photographed under a Jeol JEM-1200EXII TEM. Endbulbs of Held were serially photographed at a range of magnifications (magnification 2000, 5000, 8000 and 10 000). The photographic negatives (8 × 10 cm) were scanned using a high resolution scanner (4800 dpi, Flextight Precision, Imacon Inc., Copenhagen, Denmark). Using an image reconstruction and measurement system (MCID-M5, Imaging Research Inc.), endbulb contacts and synaptic specializations were traced in each section with the imaging measurement tools. Synaptic specializations were identified (and defined) by the presence of a postsynaptic density (PSD) and synaptic cleft, and at least one vesicle within 150 nm of the presynaptic zone opposite the PSD. (In all but a few cases, synaptic specializations exhibited multiple morphologically docked vesicles.) The software image alignment and reconstruction routines were then used to create a three dimensional rendering of the cell, with its endbulb contacts.
High magnification (× 8000) images were used to examine a restricted region of four endbulbs contacting three different AVCN bushy cells. In this analysis, PSDs were carefully measured and vesicles associated with the synaptic specialization were plotted. Vesicles were identified as morphologically docked (no space between the vesicle and presynaptic membranes), or undocked but within 150 nm of the presynaptic specialization immediately opposite the PSD.
Measurements were made of PSD area and circumference, as well as the distances between nearest neighbour PSDs, using the measuring tools in the MCID software package. Statistical significance of correlations was determined using the Spearman non-parametric correlation test.
RESULTS
Figure 1 shows an electron-micrograph of an endbulb of Held (eb) contacting a bushy cell (bc) in the AVCN of a 25-day-old rat. Serial-section reconstructions revealed that this cell was contacted by four large endbulbs, each endbulb illustrated in different colours in Fig. 2A and B (showing two different rotations). Each endbulb was traced back to a separate myelinated nerve fibre. Interestingly, it appears that the endbulbs are generally well-separated over the surface of the cell, avoiding large regions of close apposition with each other. The four endbulbs are illustrated separately in Fig. 2C–F, showing the best en face rotation for each endbulb.
Figure 1. Electron-micrograph of an endbulb of Held (eb) contact with the soma of a bushy cell (bc) in the rat anteroventral cochlear nucleus (AVCN).
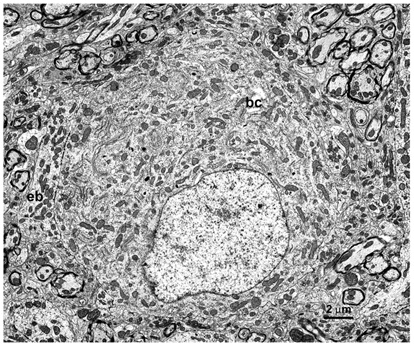
This bushy cell was used in the serial-section reconstructions and micrographs shown in Figs 2–7. Photomicrograph taken at × 2000.
Figure 2. Serial-section reconstructions of four endbulbs of Held contacting the same bushy cell.
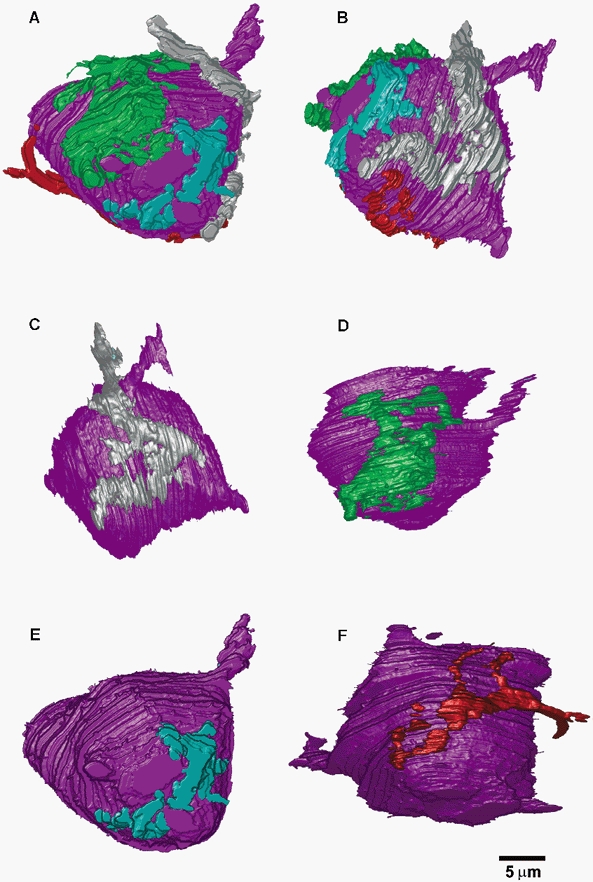
A and B, two different rotations demonstrate that four different endbulbs (cyan, green, silver, red) contact the bushy cell (purple). C-F, each endbulb is shown individually at the best en face rotation.
Figure 3A–E shows high magnification, sequential electron-micrographs of one of the endbulbs (green) shown in Fig. 2. Figure 3A illustrates a myelinated auditory axon (asterisk) giving rise to a large endbulb of Held. Numerous specializations with pre- and postsynaptic thickenings can be observed between the endbulb and the postsynaptic cell (arrowheads, Fig. 3A). Serial-section reconstructions were necessary to determine the total number and morphology of specializations within the endbulbs. The distribution of specializations, reconstructed from serial sections, is shown in Fig. 4A and B. The number of specializations in each endbulb was 85 (cyan), 115 (red), 201 (green) and 217 (silver), producing an average number of 155 specializations per endbulb. Figure 4C shows an en face view of the one of these endbulbs (green), which was determined to be the most suitable for further detailed analysis, because the cutting angle produced the clearest view of specializations and associated vesicles. This endbulb exhibited 201 separate specializations (Fig. 4D), and a histogram of the PSD areas is plotted in Fig. 5. The distribution of PSD areas is highly skewed, with a mean value of 0.066 ± 0.12 μm2. The separation between adjacent specializations was also measured, with a mean closest neighbour distance of 0.15 ± 0.13 μm.
Figure 3. Electron-micrographs of synaptic contacts within the same endbulb of Held.
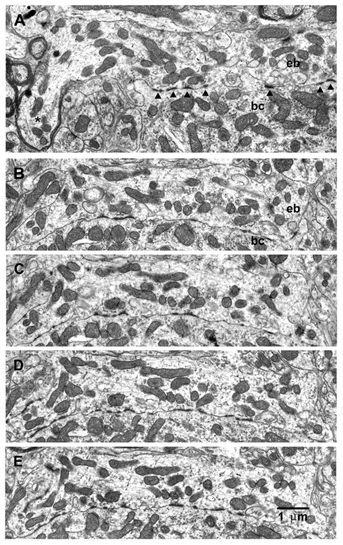
A, a myelinated auditory axon (*) giving rise to a large endbulb containing synaptic specializations (arrowheads), defined by characteristic postsynaptic densities (PSDs), well-defined synaptic clefts and clusters of synaptic vesicles (see high-magnification photomicrographs in Fig. 6). B-E, electron-micrographs of four serial sections of the same endbulb of Held shown in A. This is the endbulb represented in green in Fig. 2. Section numbers are: A = 148, B = 114, C = 115, D = 116, E = 117. Photomicrographs were taken at × 5000.
Figure 4. Endbulbs of Held contain many separate synaptic contacts.
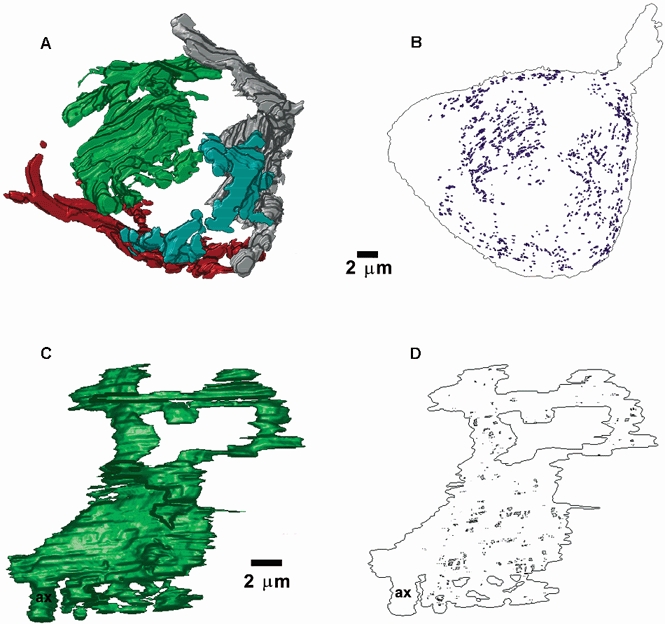
A and B, four endbulbs of Held (A) and corresponding synaptic contacts at the same rotation, for all four endbulbs, reconstructed from serial sections (B). C and D, the green endbulb (C) and its synaptic contacts (D), at higher magnification and at the best en face rotation.
Figure 5. Large variability in PSD areas from a single endbulb of Held.
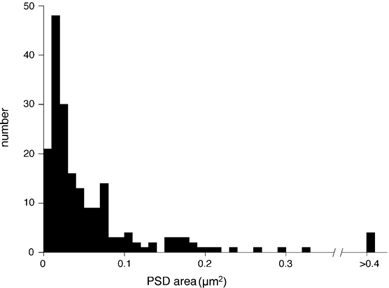
The histogram represents measurements made of the areas of PSDs within the endbulb shown in green in Figs 2 and 4 (see text for details).
The distribution of synaptic vesicles at synaptic specializations was determined from high magnification electron-micrographs of a section of the (green) endbulb illustrated in Fig. 2 and Fig. 4. Sequential sections of three different specializations are shown in the electron-micrographs of Fig. 6. Obvious clusters of vesicles (vc) can be observed in association with the same synaptic specialization, identified in serial-section reconstructions (Fig. 6A–I). Figure 7A shows a reconstruction of 45 specializations, together with the morphologically docked vesicles, i.e. no separation between the vesicle and terminal membranes. (For interest, all ‘morphologically docked’ vesicles have been plotted, including those which are not associated with synaptic specializations, but are in contact with the terminal membrane. It is obvious that there are very few vesicles in close apposition with the terminal membrane outside the synaptic specialization regions, representing only 1 % of the total population. Therefore, the likelihood of including a vesicle randomly apposed to but not specifically docked at a specialization is very low.) Figure 7B shows a plot of the number of docked vesicles versus PSD area, for these 45 specializations. As seen on the plot, there is an excellent linear correlation between the number of docked vesicles and PSD area (Spearman test, P < 0.0001). On average, there were 14.8 morphologically docked vesicles per specialization. A linear regression fit to the data exhibited a slope of 79 docked vesicles per μm2. Further analysis of this relationship revealed that the correlation between PSD area and number of docked vesicles becomes non-significant for PSD areas less than 0.05 μm2, which is expected since there are very few docked vesicles (mean = 2). However, the relationship still holds, on average, for these small PSD areas. The sum of PSD areas and the total number of docked vesicles for PSD areas less than 0.05 μm2 is plotted (open triangle) in Fig. 7B. This point is close to the linear regression line for the whole population.
Figure 6. Clusters of vesicles at endbulb synaptic contacts.
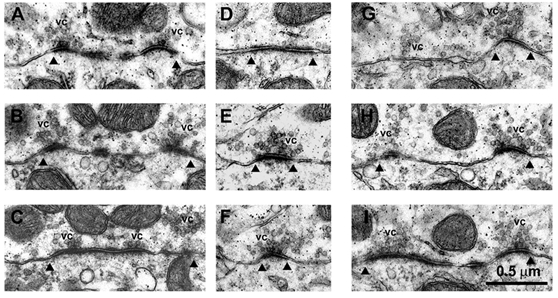
Sequential sections of three different contacts within the same endbulb (green, Figs 2 and 4). A-C, sequential sections (section no. 115, 117, 119) through the same synaptic contact, as determined from serial-section reconstructions. D-F (section no. 141, 142, 144) and G-I (section no. 141, 142, 144), sequential sections through two other synaptic contacts within the same endbulb. Arrowheads indicate the outer boundaries of each synaptic contact, and vesicle clusters are indicated by ‘vc’. Photomicrographs taken at × 8000.
Figure 7. Numbers of morphologically docked vesicles correlate with PSD area at endbulb synaptic contacts.
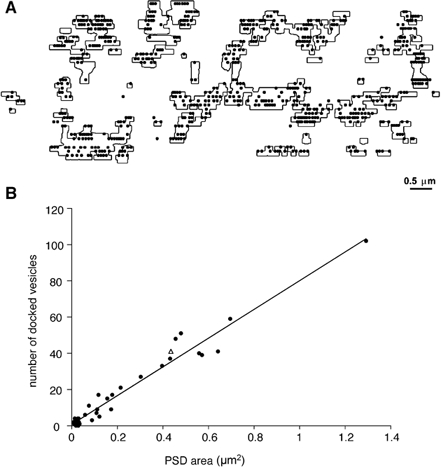
A, high magnification reconstruction of 45 individual synaptic contacts within the same endbulb (outlines), together with morphologically docked vesicles. B, a plot of the number of morphologically docked vesicles versus PSD areas for the 45 synaptic contacts shown in A. The sum of PSD areas and the total number of docked vesicles for PSD areas less than 0.05 μm2 is shown (▵). The continuous line is linear regression fit to the data.
The number of vesicles which are not morphologically docked, but are within 150 nm of the presynaptic membrane of each synaptic specialization, was also determined for this same bouton. Figure 8A shows that there is an excellent linear correlation between the number of undocked vesicles (< 150 nm) and PSD area (Spearman test, P < 0.0001). A linear regression fit to the data produced a slope of 144 vesicles per μm2. Figure 8B shows a plot of the number of docked vesicles versus undocked vesicles (< 150 nm), for the same population of 45 specializations. Again, there is an excellent linear correlation (Spearman test, P < 0.0001). The slope of a linear regression fit to this plot shows that for every docked vesicle, there are 1.8 undocked vesicles within 150 nm of a specialization, on average. The linear relationships between docked, undocked (< 150 nm) and PSD areas demonstrate that these properties of synaptic specializations seem to simply scale according to PSD area.
Figure 8. Correlation between the number of undocked vesicles within 150 nm of active zone, the PSD area and the number of docked vesicles.
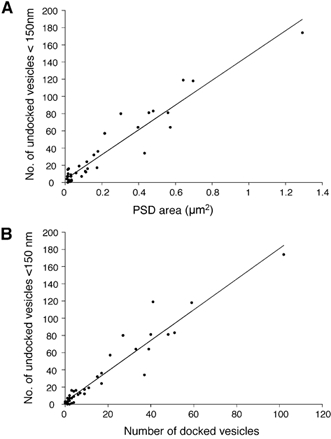
A and B, data from the same section of endbulb shown in Fig. 7. Straight lines in A and B are linear regression fits to the data (see text for details).
Detailed reconstructions of segments of a further three endbulbs in the AVCN of the same 25-day-old rat were obtained for comparison. Table 1 summarizes the data from all four endbulbs. Endbulb 2 (Table 1) shows measurements taken from a portion of the silver endbulb in Fig. 2. Interestingly, there were considerable differences in some measures (mean PSD size, mean numbers of docked and undocked vesicles) for the two endbulbs contacting the same cell (Table 1, cell A, endbulbs 1, 2), and for the two endbulbs contacting different cells (Table 1, cells B and C) in the same AVCN. Other measures, such as the mean numbers of vesicles per area of PSD, were similar across endbulbs. For endbulbs 1, 2 and 4 (Table 1) there was a significant correlation between PSD area and number of docked vesicles (Spearman test, P < 0.05). This relationship was not significant for endbulb 3, most probably because it exhibited only small synaptic specializations and correspondingly small numbers of docked vesicles per specialization. However, there was a significant correlation between PSD area and the number of undocked vesicles (< 150 nm) for this and the other three endbulbs. In addition, there was a significant correlation for all four endbulbs between the numbers of docked vesicles and the numbers of undocked vesicles (< 150 nm; Spearman test, P < 0.05).
Table 1.
Summary of PSD sizes and associated vesicle numbers from four different endbulbs
| Endbulb 1 Cell A | Endbulb 2 Cell A | Endbulb 3 Cell B | Endbulb 4 Cell C | |
|---|---|---|---|---|
| Mean PSD area (μm2) | 0.18 | 0.07 | 0.03 | 0.07 |
| (number in sample) | (n = 45) | (n = 38) | (n = 21) | (n = 12) |
| Range of PSD areas (μm2) | 0.01–0.70 | 0.01–0.18 | 0.01–0.06 | 0.02–0.16 |
| Mean no. docked vesicles per PSD | 14.8 | 5.3 | 2.1 | 3.7 |
| Mean no. docked vesicles per μm2 of PSD | 83.6 | 80.3 | 80.7 | 53.6 |
| Mean no. undocked vesicles (< 150 nm) per PSD | 29.1 | 26.2 | 6.4 | 18.6 |
| Mean ratio of undocked (< 150 nm) to docked vesicles | 2.0 | 4.9 | 3.0 | 5.0 |
Measurements were obtained from reconstructions of portions of endbulbs in the AVCN from the same 25-day-old rat. Two endbulbs contacted the same postsynaptic neuron (Cell A), and the other two contacted different neurons (Cells B and C). Numbers in parentheses indicate the total number of specializations for which the measurements were made.
DISCUSSION
Multiple endbulb innervation of bushy cells
Many AVCN bushy cells receive more than one endbulb of Held, and such convergence has been shown to improve synchronization of the bushy cell output discharge with an auditory tone input, over that of individual auditory nerve fibres (Joris et al. 1994). One bushy cell reconstructed in our present study was contacted by four endbulbs of Held. Interestingly, these four terminals appeared to be well separated from each other around the bushy cell soma. Functionally, this arrangement would minimize potential cross-talk between endbulbs, as might occur if large amounts of glutamate were released by these terminals (e.g. spillover of glutamate from one endbulb to another could desensitize postsynaptic glutamate receptors or activate presynaptic metabotropic glutamate receptors of a neighbouring endbulb; Takahashi et al. 1996). The presence of glia, which were observed surrounding the endbulbs (data not shown; see also Cant & Morest, 1979), may be important in minimizing interactions between endbulbs via transmitter uptake.
Endbulbs do not receive presynaptic contacts
Transmitter release from rat endbulbs is severely reduced by the activation of presynaptic GABAB receptors (Walmsley, unpublished observation). In the spinal cord, GABAergic presynaptic inhibition is due to conventional presynaptic contacts with synaptic terminals (Walmsley et al. 1995). However, such axo-axonic synapses have rarely been observed in the rat AVCN (Gentschev & Sotelo, 1973), and no such direct presynaptic contacts were observed on endbulbs of Held in the present study. Thus, if activation of endbulb GABA receptors occurs physiologically, it must be due to spillover of GABA from inhibitory terminals. This possibility is supported by our recent study showing that GABA may be released from terminals on AVCN bushy cells in sufficient concentration to activate presynaptic GABAB receptors on glycinergic terminals (Lim et al. 2000).
Endbulbs in the rat AVCN exhibit large numbers of synaptic specializations
Serial-section reconstruction of four endbulbs contacting the same bushy cell revealed a mean of 155 synaptic specializations (range 85 to 217). This number is comparable to the mean value of the quantal parameter, N = 142, obtained in our previous electrophysiological studies on the endbulb-bushy cell connection in rat AVCN slices (using variance-mean analysis of quantal release parameters; Oleskevich et al. 2000). Quantal studies usually relate the quantal parameter, N, to either the number of fusion-ready vesicles or to the number of release sites (Walmsley et al. 1998). Our results suggest that N may approximate the number of synaptic specializations at endbulb-bushy cell connections (but see discussions below).
Endbulb synaptic specializations are closely spaced
Many rat endbulb specializations exhibit complex shapes and extend over a considerable distance (> 0.5 μm; Fig. 7A). Morphologically docked vesicles are found over the full extent of these large specializations, and there is no obvious single location at which vesicles are tightly clustered and which may constitute a single release site. It seems most plausible that vesicles could be released from any location within the presynaptic active zone. In this case, the number of postsynaptic receptors activated will depend on the location of the released vesicle within the active zone (Uteshev & Pennefather, 1996). In addition, many of the specializations are in close proximity to each other. Unless there are strong diffusion barriers (which are not evident under the electron microscope), it is possible that transmitter released from the edge of one specialization may diffuse and activate the postsynaptic receptors of a neighbouring specialization (Fig. 7A). These structural factors may contribute to the large variability observed in the amplitude of miniature excitatory synaptic currents recorded in all bushy cells (Isaacson & Walmsley, 1995a, b, 1996).
Under conditions of high release probability (high extracellular calcium concentrations or application of phorbol esters; Oleskevich & Walmsley, 2000), transmitter release at the rat endbulb-bushy cell connection can result in postsynaptic receptor desensitization (Oleskevich et al. 2000). This desensitization could result from interactions between specializations (spillover of transmitter to adjacent sites) or multivesicular release from several locations within the same active zone (Tong & Jahr, 1994). In this regard, channels and glial protrusions between the endbulb and bushy cell membranes have been observed in previous studies (Cant & Morest, 1979) and were confirmed in the present study (data not shown). These glia may act as transmitter uptake sites to reduce glutamate accumulation in the extensive apposition region between endbulbs and bushy cells.
Large variability in endbulb PSD areas
Our reconstructions show that the distribution of endbulb PSD areas is highly skewed, with very few specializations over 0.4 μm2, similar to distributions at glutamatergic synapses in the hippocampus (Schikorski & Stevens, 1999) and spinal cord (Pierce & Mendell, 1993). Our previous electrophysiological results have shown that both AMPA and NMDA receptors underlie the synaptic current at endbulb-bushy cell connections in early neonatal rats, but after 3 weeks postnatal, the NMDA component is absent and the synaptic current is exclusively generated by the activation of AMPA receptors (Isaacson & Walmsley, 1995b; Bellingham et al. 1998). In the present study, results were obtained from the AVCN of a 25-day-old rat, an age at which there is only AMPA receptor-mediated transmission. At endbulb release sites, if the postsynaptic AMPA receptors are saturated by the release of the contents of a single vesicle, then the amplitude of the postsynaptic current will be determined by the total number of available AMPA receptors in the postsynaptic density (Clements, 1996; Walmsley et al. 1998). Under the receptor saturation hypothesis, if the number of receptors in the postsynaptic density is proportional to the area of the postsynaptic specialization, then the highly skewed distribution of endbulb PSD areas would be expected to result in a highly skewed distribution of spontaneous mEPSCs. (The shape of the distribution of mEPSC amplitudes also depends on the spontaneous release rate at all release sites; Walmsley, 1995.) However, our electrophysiological experiments have shown that spontaneous mEPSC distributions in AVCN bushy cells are not highly skewed, and that many can be reasonably well fitted by a Gaussian distribution (Isaacson & Walmsley, 1995a). This discrepancy argues against postsynaptic AMPA receptor saturation at endbulb release sites. Interestingly, at early postnatal ages (1–2 weeks), the distribution of the amplitude of the NMDA receptor-mediated mEPSCs in bushy cells is highly skewed, while the AMPA receptor-mediated mEPSC distribution is not (B. Walmsley, unpublished observation). One interpretation is that NMDA receptors are close to saturation, while the AMPA receptors are not.
Number of docked vesicles is directly proportional to PSD area
The number of morphologically docked vesicles at individual specializations within the same endbulb varied considerably (range 1 to 102; n = 4 endbulbs). Based on the average number of vesicles per active zone, the total number of morphologically docked vesicles in two completely reconstructed endbulbs was approximately 1200 and 3000. As pointed out by Schikorski and Stevens (1999), the population of morphologically docked vesicles is a superset of the population of vesicles which are docked and primed, ready for release, i.e. the ‘readily releasable pool’ (Stevens & Tsujimoto, 1995; Rosenmund & Stevens, 1996). A linear relationship between numbers of docked vesicles and PSD areas in the same endbulb was observed, in agreement with previous observations at conventional small boutons (Pierce & Mendell, 1993; Schikorski & Stevens, 1999). In addition, a linear relationship was found between the numbers of undocked vesicles within 150 nm of the active zone and PSD area. The mean number of docked vesicles per specialization also varied greatly between endbulbs (range 2.1 to 14.8, Table 1). However, despite this greater than sevenfold range, the number of docked vesicles per μm2 of PSD was found to be surprisingly similar between endbulbs (one- to twofold range; 54 to 83; Table 1). These results suggest that the major difference between specializations is simply the size of the PSDs, both within the same endbulb or between different endbulbs.
What are the functional consequences of different numbers of docked vesicles at individual specializations ? It has been suggested that the probability of vesicular release depends on the number of docked and primed vesicles at an active zone (Murthy et al. 1997; Walmsley et al. 1998; Schikorski & Stevens, 1999). Since there is a linear relationship between the number of docked vesicles and PSD area, release probability may also be proportional to PSD area. In this case, the large variability between synaptic specializations in the number of docked vesicles would result in considerable non-uniform release probabilities at the same endbulb (Walmsley et al. 1988; Walmsley, 1991; Harris & Sultan, 1995; Dobrunz & Stevens, 1997). Furthermore, there should also be large differences in mean release probability between endbulbs. Such a difference has been found in our previous study which used variance-mean analysis to examine mean release probability at endbulb-bushy cell connections in the rat AVCN (Oleskevich et al. 2000). This study found that mean release probability varied from Pr= 0.30 to 0.95 (average Pr= 0.55, n = 10 endbulbs; Oleskevich et al. 2000). Although suggestive, it will clearly be important to test the relationship more directly by obtaining morphological measurements from the same endbulb-bushy cell connections for which electrophysiological recordings have been obtained.
Number of undocked vesicles is proportional to number of docked vesicles
A correlation was found between undocked vesicles < 150 nm from the specialization to morphologically docked vesicles in the same endbulb. These undocked vesicles may constitute a population of reserve vesicles which can be quickly recruited to the active zone during high-frequency stimulation. In support of this proposal, Morimoto et al. (1998) have found that paired-pulse facilitation is greater at Xenopus nerve-muscle synapses with the same number of morphologically docked vesicles but an increased number of vesicles within 100–300 nm from the plasmalemma. In addition, it has been proposed that the amount of paired-pulse facilitation (or depression) at a synapse may be related to the ratio of the number of reserve to the number of readily releasable vesicles (Oleskevich et al. 2000). Although the total number of docked vesicles varies considerably between specializations, our results show that the ratio of undocked vesicles < 150 nm to the number of docked vesicles is approximately the same for synaptic specializations within the same endbulb, suggesting that the paired-pulse response may also be similar at these specializations. However, differences were found in the ratio of docked to undocked (< 150 nm) vesicles between endbulbs, with a range from 2.0 to 5.0 (Table 1), implying that there may be differences in paired-pulse responses between endbulbs. Supporting evidence for this suggestion comes from a previous study showing that endbulb synapses in the rat AVCN exhibit large differences in the amount of paired-pulse depression or facilitation, with some connections exhibiting facilitation and some exhibiting depression (Oleskevich et al. 2000; see also Bellingham & Walmsley, 1999, for discussion of paired pulse depression at the rat endbulb-bushy cell connection). Endbulbs also exhibit considerable depression of release during high frequency trains of impulses (Oleskevich & Walmsley, 2000). One of the major contributors to this high frequency depression is likely to be vesicle depletion, and it will be useful to obtain electrophysiological results on the number of vesicles in the readily releasable pool (Schneggenburger et al. 1999) to compare with the number of morphologically docked and neighbouring undocked vesicles.
Source of morphological variability between endbulbs
In the mammalian AVCN, there are two major types of bushy cell, spherical and globular (Wu & Oertel, 1984). Spherical bushy cells receive the largest endbulbs, while globular bushy cells receive more numerous but smaller ‘modified’ endbulbs, arising from auditory nerves. Auditory nerves spontaneously discharge nerve impulses, even in the absence of sound. Some auditory nerves have high spontaneous discharge frequencies, while others have relatively low discharge frequencies (Liberman, 1991). Interestingly, Ryugo et al. (1996) used electron microscopy of physiologically identified endbulbs and found that endbulbs arising from auditory nerves of high spontaneous rate had more numerous but smaller synaptic specializations. Furthermore, Ryugo et al. (1997) also showed that the endbulbs of congenitally deaf cats contained larger synaptic specializations than those of normal cats. Both lines of evidence suggest that auditory nerve activity is associated with endbulb morphology (Ryugo et al. 1996, 1997). Our results in the rat AVCN also show differences in the mean size and range of synaptic specializations between endbulbs. It would clearly be interesting to study the electrophysiological properties of synaptic transmission at endbulb-bushy cell connections arising from auditory nerves of known spontaneous discharge rate and sensitivity.
REFERENCES
- Barbour B, Keller BU, Llano I, Marty A. Prolonged presence of glutamate during excitatory synaptic transmission to cerebellar Purkinje cells. Neuron. 1994;12:1331–1343. doi: 10.1016/0896-6273(94)90448-0. [DOI] [PubMed] [Google Scholar]
- Bellingham MC, Lim R, Walmsley B. Developmental changes in EPSC quantal size and quantal content at a central glutamatergic synapse in rat. Journal of Physiology. 1998;511:861–869. doi: 10.1111/j.1469-7793.1998.861bg.x. [DOI] [PMC free article] [PubMed] [Google Scholar]
- Bellingham MC, Walmsley B. A novel presynaptic inhibitory mechanism underlies paired pulse depression at a fast central synapse. Neuron. 1999;23:159–170. doi: 10.1016/s0896-6273(00)80762-x. [DOI] [PubMed] [Google Scholar]
- Cant NB, Morest DK. The bushy cells in the anteroventral cochlear nucleus of the cat. A study with the electron microscope. Neuroscience. 1979;4:1925–1945. doi: 10.1016/0306-4522(79)90066-6. [DOI] [PubMed] [Google Scholar]
- Clements JD. Transmitter timecourse in the synaptic cleft: its role in central synaptic function. Trends in Neurosciences. 1996;19:163–171. doi: 10.1016/s0166-2236(96)10024-2. [DOI] [PubMed] [Google Scholar]
- Dobrunz LE, Stevens CF. Heterogeneity of release probability, facilitation, and depletion at central synapses. Neuron. 1997;18:995–1008. doi: 10.1016/s0896-6273(00)80338-4. [DOI] [PubMed] [Google Scholar]
- Gentschev T, Sotelo C. Degenerative patterns in the ventral cochlear nucleus of the rat after primary deafferentation. An ultrastructural study. Brain Research. 1973;62:37–60. doi: 10.1016/0006-8993(73)90618-5. [DOI] [PubMed] [Google Scholar]
- Harris KM, Sultan P. Variation in the number, location and size of synaptic vesicles provides an anatomical basis for the nonuniform probability of release at hippocampal CA1 synapses. Neuropharmacology. 1995;34:1387–1395. doi: 10.1016/0028-3908(95)00142-s. [DOI] [PubMed] [Google Scholar]
- Isaacson JS, Walmsley B. Counting quanta: direct measurements of transmitter release at a central synapse. Neuron. 1995a;15:875–884. doi: 10.1016/0896-6273(95)90178-7. [DOI] [PubMed] [Google Scholar]
- Isaacson JS, Walmsley B. Receptors underlying excitatory synaptic transmission in slices of the rat anteroventral cochlear nucleus. Journal of Neurophysiology. 1995b;73:964–973. doi: 10.1152/jn.1995.73.3.964. [DOI] [PubMed] [Google Scholar]
- Isaacson JS, Walmsley B. Amplitude and time course of spontaneous and evoked excitatory postsynaptic currents in bushy cells of the anteroventral cochlear nucleus. Journal of Neurophysiology. 1996;76:1566–1571. doi: 10.1152/jn.1996.76.3.1566. [DOI] [PubMed] [Google Scholar]
- Joris PX, Carney LH, Smith PH, Yin TC. Enhancement of neural synchronization in the anteroventral cochlear nucleus. I. Responses to tones at the characteristic frequency. Journal of Neurophysiology. 1994;71:1022–1036. doi: 10.1152/jn.1994.71.3.1022. [DOI] [PubMed] [Google Scholar]
- Lenn NJ, Reese TS. The fine structure of nerve endings in the nucleus of the trapezoid body and the ventral cochlear nucleus. American Journal of Anatomy. 1966;118:375–389. doi: 10.1002/aja.1001180205. [DOI] [PubMed] [Google Scholar]
- Liberman MC. Central projections of auditory-nerve fibers of differing spontaneous rate. I. Anteroventral cochlear nucleus. Journal of Comparative Neurology. 1991;313:240–258. doi: 10.1002/cne.903130205. [DOI] [PubMed] [Google Scholar]
- Lim R, Alvarez FJ, Walmsley B. Quantal size is correlated with receptor cluster area at glycinergic synapses in the rat brainstem. Journal of Physiology. 1999;516:505–512. doi: 10.1111/j.1469-7793.1999.0505v.x. [DOI] [PMC free article] [PubMed] [Google Scholar]
- Lim R, Alvarez FJ, Walmsley B. GABA mediates presynaptic inhibition at glycinergic synapses in an auditory brainstem nucleus. Journal of Physiology. 2000;525:447–459. doi: 10.1111/j.1469-7793.2000.t01-1-00447.x. [DOI] [PMC free article] [PubMed] [Google Scholar]
- MacKenzie PJ, Kenner GS, Prange O, Shayan H, Umemiya M, Murphy TH. Ultrastructural correlates of quantal synaptic function at single CNS synapses. Journal of Neuroscience. 1999;19:1–7. doi: 10.1523/JNEUROSCI.19-12-j0003.1999. [DOI] [PMC free article] [PubMed] [Google Scholar]
- Morimoto T, Wang XH, Poo MM. Overexpression of synaptotagmin modulates short-term synaptic plasticity at developing neuromuscular junctions. Neuroscience. 1998;82:969–978. doi: 10.1016/s0306-4522(97)00343-6. [DOI] [PubMed] [Google Scholar]
- Murthy VN, Sejnowski TJ, Stevens CF. Heterogeneous release properties of visualized individual hippocampal synapses. Neuron. 1997;18:599–612. doi: 10.1016/s0896-6273(00)80301-3. [DOI] [PubMed] [Google Scholar]
- Neises GR, Mattox DE, Gulley RL. The maturation of the end bulb of Held in the rat anteroventral cochlear nucleus. Anatomical Record. 1982;204:271–279. doi: 10.1002/ar.1092040312. [DOI] [PubMed] [Google Scholar]
- Nusser Z. AMPA and NMDA receptors: similarities and differences in their synaptic distribution. Current Opinion in Neurobiology. 2000;10:337–341. doi: 10.1016/s0959-4388(00)00086-6. [DOI] [PubMed] [Google Scholar]
- Nusser Z, Cull-Candy S, Farrant M. Differences in synaptic GABA(A) receptor number underlie variation in GABA mini amplitude. Neuron. 1997;19:697–709. doi: 10.1016/s0896-6273(00)80382-7. [DOI] [PubMed] [Google Scholar]
- Oleskevich S, Clements J, Walmsley B. Release probability modulates short-term plasticity at a giant terminal. Journal of Physiology. 2000;524:513–523. doi: 10.1111/j.1469-7793.2000.00513.x. [DOI] [PMC free article] [PubMed] [Google Scholar]
- Oleskevich S, Walmsley B. Phosphorylation regulates spontaneous and evoked transmitter release at a giant terminal in the rat auditory brainstem. Journal of Physiology. 2000;526:349–357. doi: 10.1111/j.1469-7793.2000.t01-1-00349.x. [DOI] [PMC free article] [PubMed] [Google Scholar]
- Pierce JP, Mendell LM. Quantitative ultrastructure of Ia boutons in the ventral horn: scaling and positional relationships. Journal of Neuroscience. 1993;13:4748–4763. doi: 10.1523/JNEUROSCI.13-11-04748.1993. [DOI] [PMC free article] [PubMed] [Google Scholar]
- Rees S, Guldner FH, Aitkin L. Activity dependent plasticity of postsynaptic density structure in the ventral cochlear nucleus of the rat. Brain Research. 1985;325:370–374. doi: 10.1016/0006-8993(85)90343-9. [DOI] [PubMed] [Google Scholar]
- Reynolds ES. The use of lead citrate at high pH as an electron opaque stain in electron microscopy. Journal of Cell Biology. 1963;17:208. doi: 10.1083/jcb.17.1.208. [DOI] [PMC free article] [PubMed] [Google Scholar]
- Rosenmund C, Stevens CF. Definition of the readily releasable pool of vesicles at hippocampal synapses. Neuron. 1996;16:1197–1207. doi: 10.1016/s0896-6273(00)80146-4. [DOI] [PubMed] [Google Scholar]
- Ryugo DK, Pongstaporn T, Huchton DM, Niparko JK. Ultrastructural analysis of primary endings in deaf white cats: morphologic alterations in endbulbs of Held. Journal of Comparative Neurology. 1997;385:230–244. doi: 10.1002/(sici)1096-9861(19970825)385:2<230::aid-cne4>3.0.co;2-2. [DOI] [PubMed] [Google Scholar]
- Ryugo DK, Sento S. Synaptic connections of the auditory nerve in cats: relationship between endbulbs of Held and spherical bushy cells. Journal of Comparative Neurology. 1991;305:35–48. doi: 10.1002/cne.903050105. [DOI] [PubMed] [Google Scholar]
- Ryugo DK, Wu MM, Pongstaporn T. Activity-related features of synapse morphology: a study of endbulbs of Held. Journal of Comparative Neurology. 1996;365:141–158. doi: 10.1002/(SICI)1096-9861(19960129)365:1<141::AID-CNE11>3.0.CO;2-T. [DOI] [PubMed] [Google Scholar]
- Schikorski T, Stevens CF. Quantitative fine-structural analysis of olfactory cortical synapses. Proceedings of the National Academy of Sciences of the USA. 1999;96:4107–4112. doi: 10.1073/pnas.96.7.4107. [DOI] [PMC free article] [PubMed] [Google Scholar]
- Schneggenburger R, Meyer AC, Neher E. Released fraction and total size of a pool of immediately available transmitter quanta at a calyx synapse. Neuron. 1999;23:399–409. doi: 10.1016/s0896-6273(00)80789-8. [DOI] [PubMed] [Google Scholar]
- Silver RA, Cull-Candy SG, Takahashi T. Non-NMDA glutamate receptor occupancy and open probability at a rat cerebellar synapse with single and multiple release sites. Journal of Physiology. 1996;494:231–250. doi: 10.1113/jphysiol.1996.sp021487. [DOI] [PMC free article] [PubMed] [Google Scholar]
- Sotelo C, Gentschev T, Zamora AJ. Gap junctions in ventral cochlear nucleus of the rat. A possible new example of electrotonic junctions in the mammalian CNS. Neuroscience. 1976;1:5–7. doi: 10.1016/0306-4522(76)90041-5. [DOI] [PubMed] [Google Scholar]
- Spurr AR. A low viscosity resin embedding medium for electron microscopy. Journal of Ultrastructural Research. 1969;26:31–43. doi: 10.1016/s0022-5320(69)90033-1. [DOI] [PubMed] [Google Scholar]
- Stevens CF, Tsujimoto T. Estimates for the pool size of releasable quanta at a single central synapse and for the time required to refill the pool. Proceedings of the National Academy of Sciences of the USA. 1995;92:846–849. doi: 10.1073/pnas.92.3.846. [DOI] [PMC free article] [PubMed] [Google Scholar]
- Takahashi T, Forsythe ID, Tsujimoto T, Barnes-Davies M, Onodera K. Presynaptic calcium current modulation by a metabotropic glutamate receptor. Science. 1996;274:594–597. doi: 10.1126/science.274.5287.594. [DOI] [PubMed] [Google Scholar]
- Tong G, Jahr CE. Multivesicular release from excitatory synapses of cultured hippocampal neurons. Neuron. 1994;12:51–59. doi: 10.1016/0896-6273(94)90151-1. [DOI] [PubMed] [Google Scholar]
- Trussell LO, Zhang S, Raman IM. Desensitization of AMPA receptors upon multiquantal neurotransmitter release. Neuron. 1993;10:1185–1196. doi: 10.1016/0896-6273(93)90066-z. [DOI] [PubMed] [Google Scholar]
- Uteshev VV, Pennefather PS. A mathematical description of miniature postsynaptic current generation at central nervous system synapses. Biophysical Journal. 1996;71:1256–1266. doi: 10.1016/S0006-3495(96)79325-6. [DOI] [PMC free article] [PubMed] [Google Scholar]
- Walmsley B. Central synaptic transmission: Studies at the connection between primary afferent fibres and dorsal spinocerebellar tract neurones in Clarke's column of the spinal cord. Progress in Neurobiology. 1991;36:391–423. doi: 10.1016/0301-0082(91)90017-u. [DOI] [PubMed] [Google Scholar]
- Walmsley B. Interpretation of ‘quantal’ peaks in distributions of evokedsynaptic transmission at central synapses. Proceedings of the Royal Society B. 1995;261:245–250. doi: 10.1098/rspb.1995.0144. [DOI] [PubMed] [Google Scholar]
- Walmsley B, Alvarez FJ, Fyffe REW. Diversity of structure and function at mammalian central synapses. Trends in Neurosciences. 1998;21:81–88. doi: 10.1016/s0166-2236(97)01170-3. [DOI] [PubMed] [Google Scholar]
- Walmsley B, Edwards FR, Tracey DJ. Non-uniform release probabilities underlie quantal synaptic transmission at a mammalian excitatory central synapse. Journal of Neurophysiology. 1988;60:889–908. doi: 10.1152/jn.1988.60.3.889. [DOI] [PubMed] [Google Scholar]
- Walmsley B, Graham B, Nicol MJ. A serial-EM and simulation study of presynaptic inhibition along a group Ia afferent collateral in the cat spinal cord. Journal of Neurophysiology. 1995;74:616–623. doi: 10.1152/jn.1995.74.2.616. [DOI] [PubMed] [Google Scholar]
- Wang Y-X, Wenthold RJ, Ottersen OP, Petralia RS. Endbulb synapses in the anteroventral cochlear nucleus express a specific subset of AMPA-type glutamate receptor subunits. Journal of Neuroscience. 1998;18:1148–1160. doi: 10.1523/JNEUROSCI.18-03-01148.1998. [DOI] [PMC free article] [PubMed] [Google Scholar]
- Wu SH, Oertel D. Intracellular injection with horseradish peroxidase of physiologically characterized stellate and bushy cells in slices of mouse anteroventral cochlear nucleus. Journal of Neuroscience. 1984;4:1577–1588. doi: 10.1523/JNEUROSCI.04-06-01577.1984. [DOI] [PMC free article] [PubMed] [Google Scholar]